| Param | Original file | Final file |
|---|---|---|
| Filename | modeM0/AS1C02_003T01_9000000924_06730cztM0_level2.evt | modeM0/AS1C02_003T01_9000000924_06730cztM0_level2_quad_clean.evt |
| Size (bytes) | 1,932,785,280 | 416,675,520 |
| Size | 1.8 GB | 397.4 MB |
| Events in quadrant A | 13,690,426 | 2,691,670 |
| Events in quadrant B | 14,064,524 | 2,714,965 |
| Events in quadrant C | 13,399,548 | 2,643,573 |
| Events in quadrant D | 15,387,425 | 2,544,586 |
| Mode M9 | |||
|---|---|---|---|
| Quadrant | BADHDUFLAG | Total packets | Discarded packets |
| A | 0 | 65 | 0 |
| B | 0 | 65 | 0 |
| C | 0 | 65 | 0 |
| D | 0 | 65 | 0 |
| Mode SS | |||
|---|---|---|---|
| Quadrant | BADHDUFLAG | Total packets | Discarded packets |
| A | 0 | 602 | 0 |
| B | 0 | 602 | 0 |
| C | 0 | 602 | 0 |
| D | 0 | 602 | 0 |
| Mode M0 | |||
|---|---|---|---|
| Quadrant | BADHDUFLAG | Total packets | Discarded packets |
| A | 0 | 61259 | 7 |
| B | 0 | 62078 | 6 |
| C | 0 | 60834 | 6 |
| D | 0 | 65486 | 6 |
| Quadrant | Total seconds | Saturated seconds | Saturation percentage |
|---|---|---|---|
| A | 29477 | 364 | 1.234861% |
| B | 29477 | 430 | 1.458764% |
| C | 29477 | 282 | 0.956678% |
| D | 29477 | 470 | 1.594463% |
Noise dominated data is calculated using 1-second bins in cleaned event files. If a bin has >2000 counts, and if more than 50% of those come from <1% of pixels, then it is considered to be noise-dominated and hence unusable.
| Quadrant | # 1 sec bins | Bins with >0 counts | Bins with >2000 counts | High rate bins dominated by noise | Noise dominated (total time) | Noise dominated (detector-on time) | Marked lightcurve |
|---|---|---|---|---|---|---|---|
| A | 36017 | 29482 | 0 | 0 | 0.00% | 0.00% | 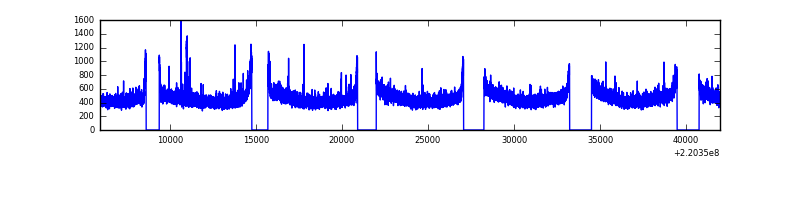 |
| B | 36017 | 29482 | 47 | 47 | 0.13% | 0.16% | 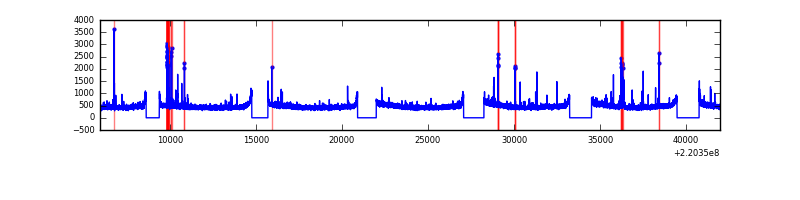 |
| C | 36017 | 29482 | 12 | 12 | 0.03% | 0.04% | 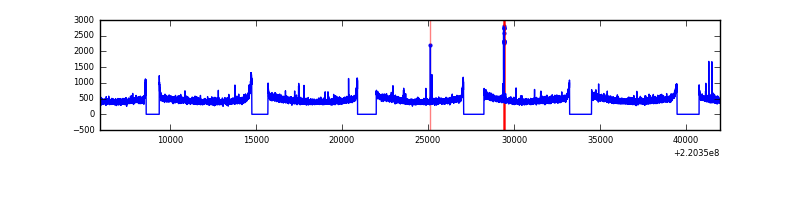 |
| D | 36017 | 29482 | 195 | 195 | 0.54% | 0.66% |  |
Top three noisy pixels from each quadrant. If the there are fewer than three noisy pixels in the level2.evt file, extra rows are filled as -1
| Pixel properties | Quadrant properties | ||||||
|---|---|---|---|---|---|---|---|
| Quadrant | DetID | PixID | Counts | Sigma | Mean | Median | Sigma |
| A | 14 | 111 | 125010 | 173.76 | 3487 | 3418 | 699.8 |
| A | 8 | 15 | 123868 | 172.13 | 3487 | 3418 | 699.8 |
| A | 0 | 226 | 32995 | 42.27 | 3487 | 3418 | 699.8 |
| B | 10 | 252 | 346744 | 518.79 | 3521 | 3442 | 661.7 |
| B | 12 | 111 | 69073 | 99.18 | 3521 | 3442 | 661.7 |
| B | 4 | 81 | 65495 | 93.77 | 3521 | 3442 | 661.7 |
| C | 12 | 16 | 50385 | 59.96 | 3395 | 3417 | 783.3 |
| C | 9 | 247 | 37135 | 43.04 | 3395 | 3417 | 783.3 |
| C | 7 | 223 | 34734 | 39.98 | 3395 | 3417 | 783.3 |
| D | 8 | 195 | 1324918 | 1619.5 | 3359 | 3261 | 816.1 |
| D | 2 | 33 | 433669 | 527.4 | 3359 | 3261 | 816.1 |
| D | 2 | 14 | 235953 | 285.13 | 3359 | 3261 | 816.1 |
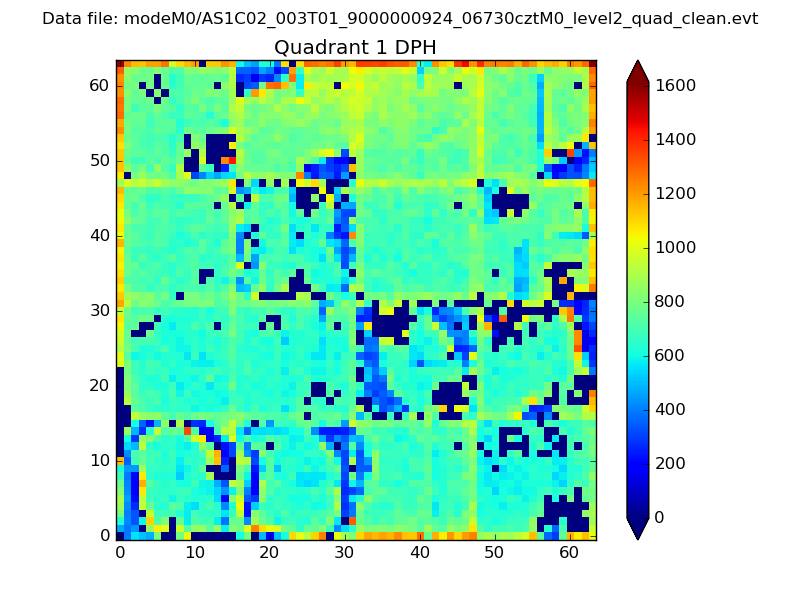
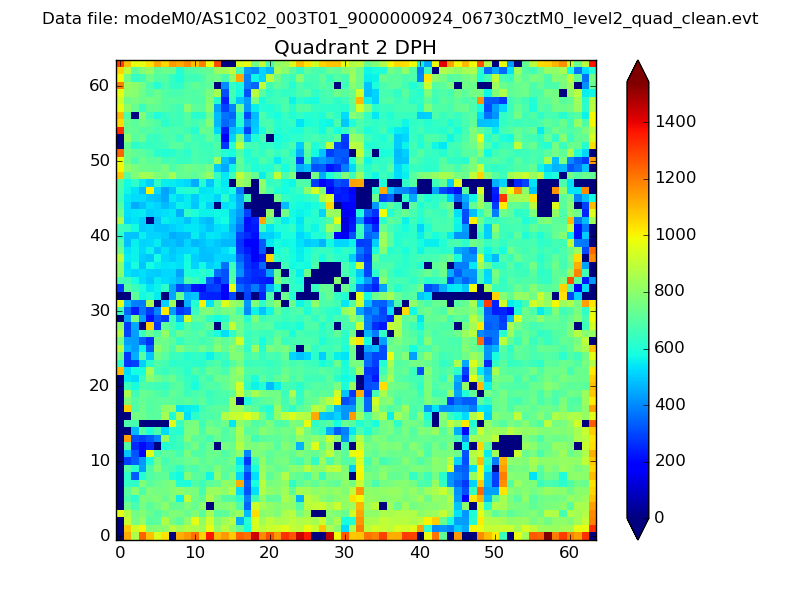
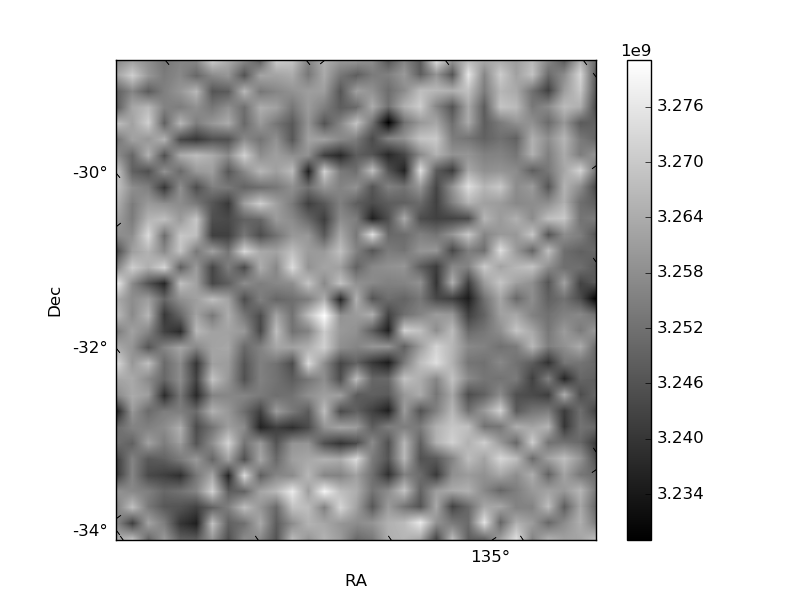
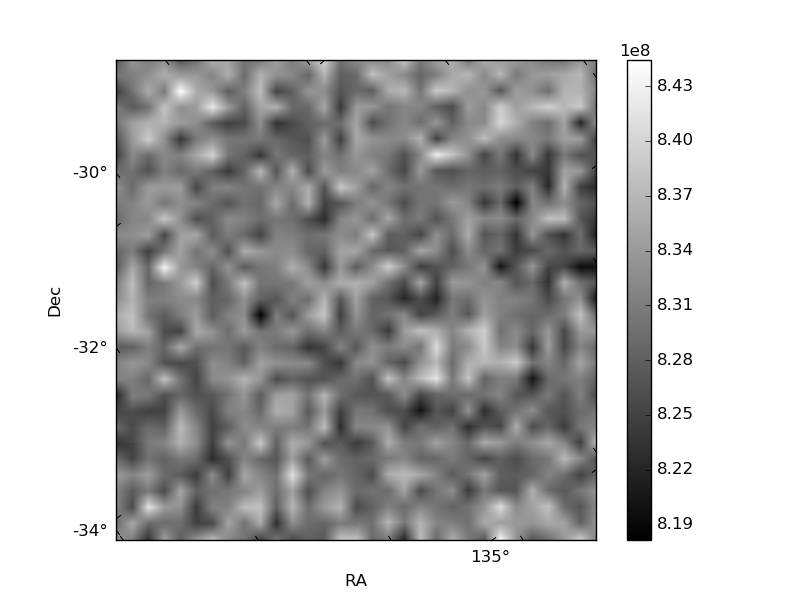
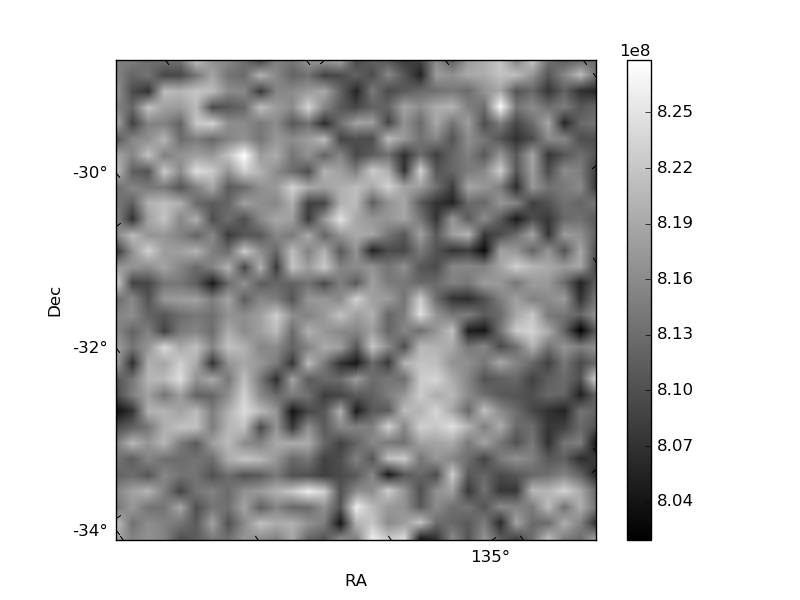
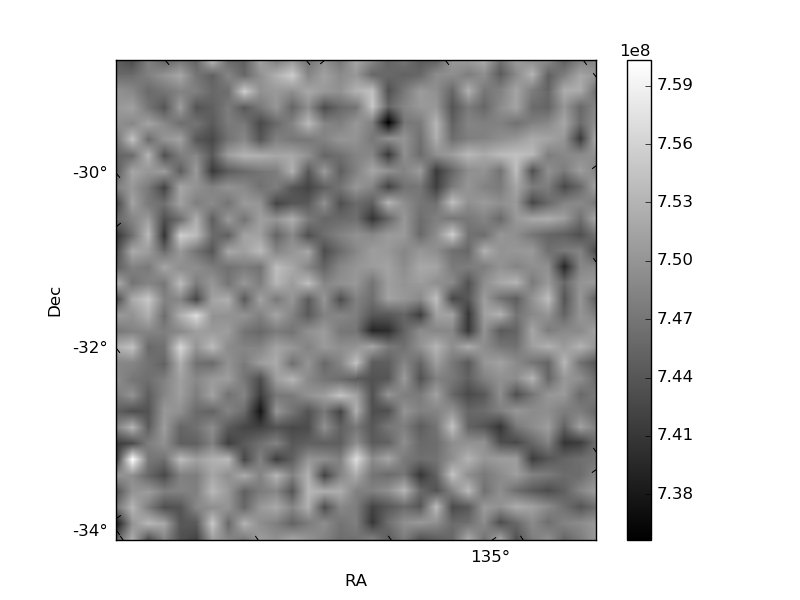
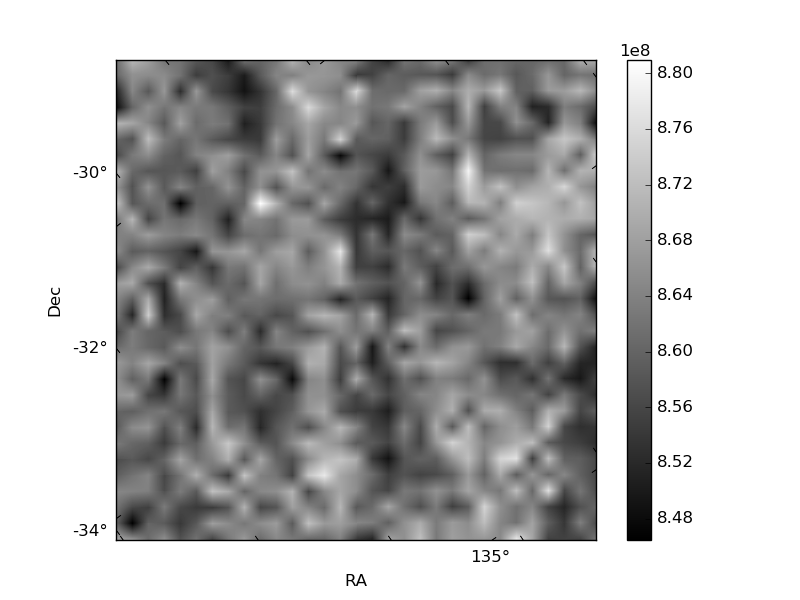
Histogram calculated using DETX and DETY for each event in the final _common_clean file
| Quadrant A | 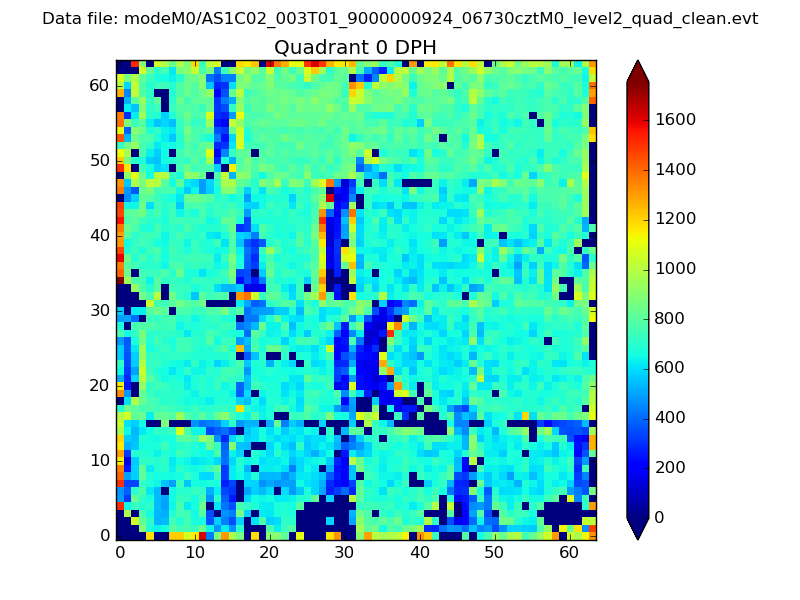 |
 |
Quadrant B |
|---|---|---|---|
| Quadrant D | 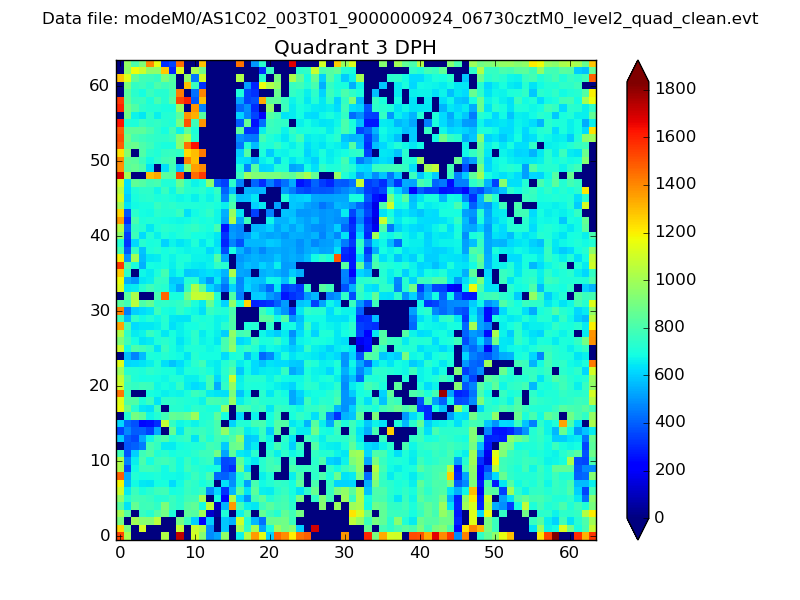 |
 |
Quadrant C |
| Plot type | Count rate plots | Images |
|---|---|---|
| Comparison with Poisson distribution Blue bars denote a histogram of data divided into 1 sec bins. Red curve is a Poisson curve with rate = median count rate of data. |
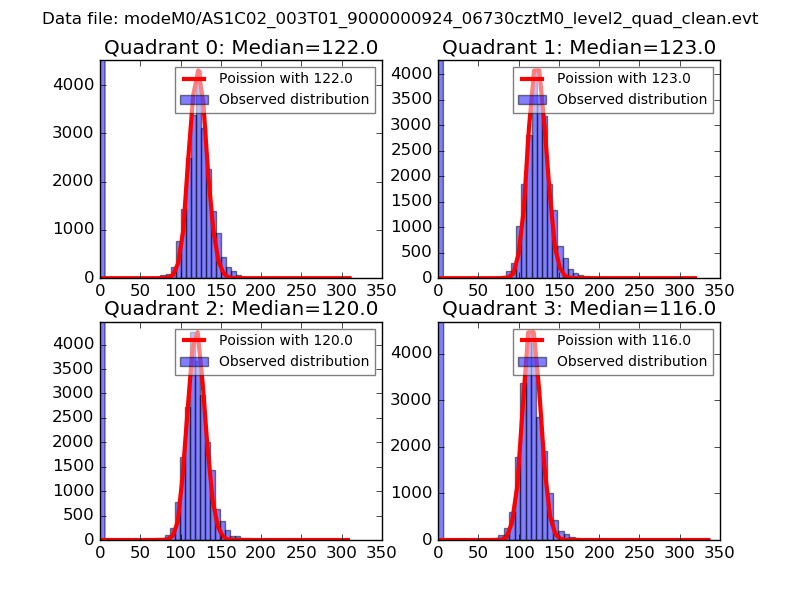 |
 |
| Quadrant-wise count rates Data is divided into 100 sec bins |
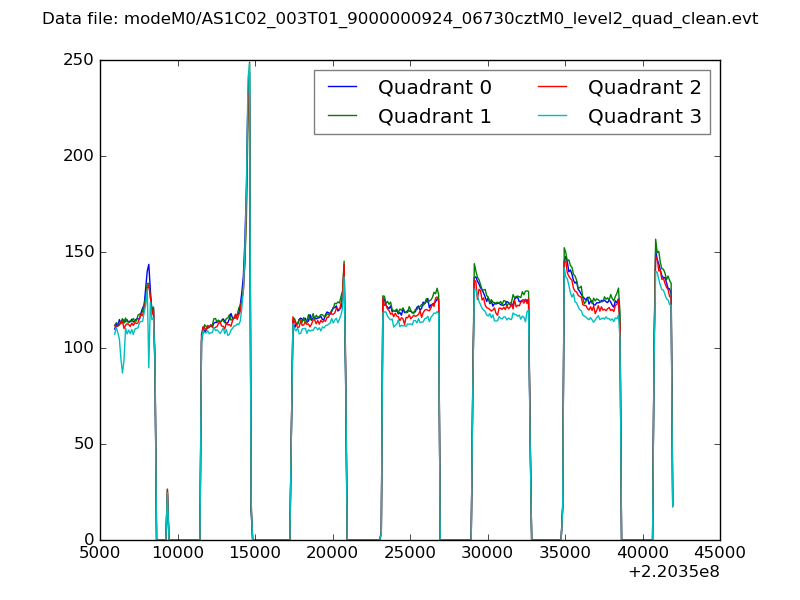 |
|
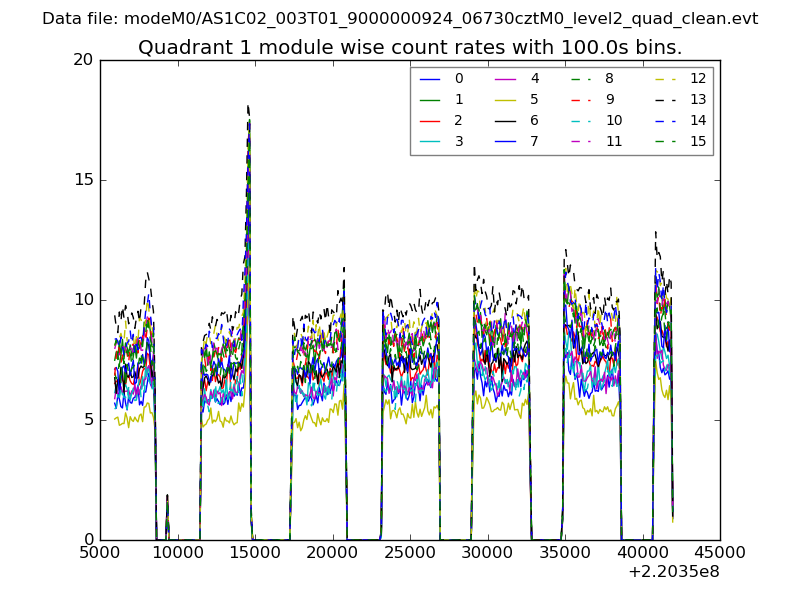
| Module-wise count rates for Quadrant A Data is divided into 100 sec bins |
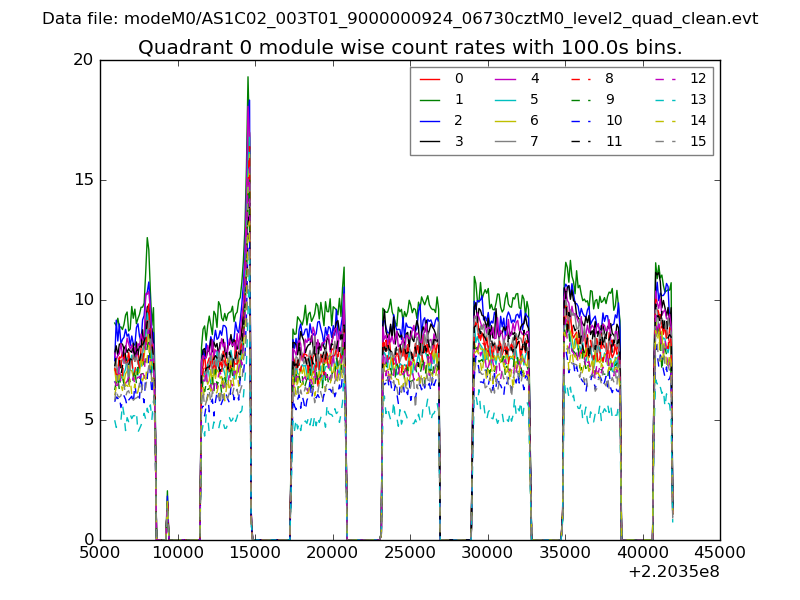 |
 |
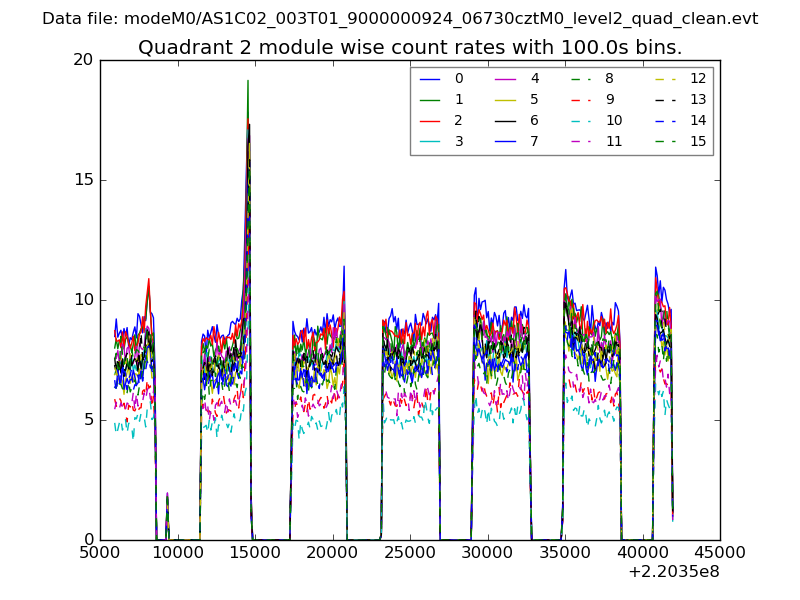
| Module-wise count rates for Quadrant B Data is divided into 100 sec bins |
 |
 |
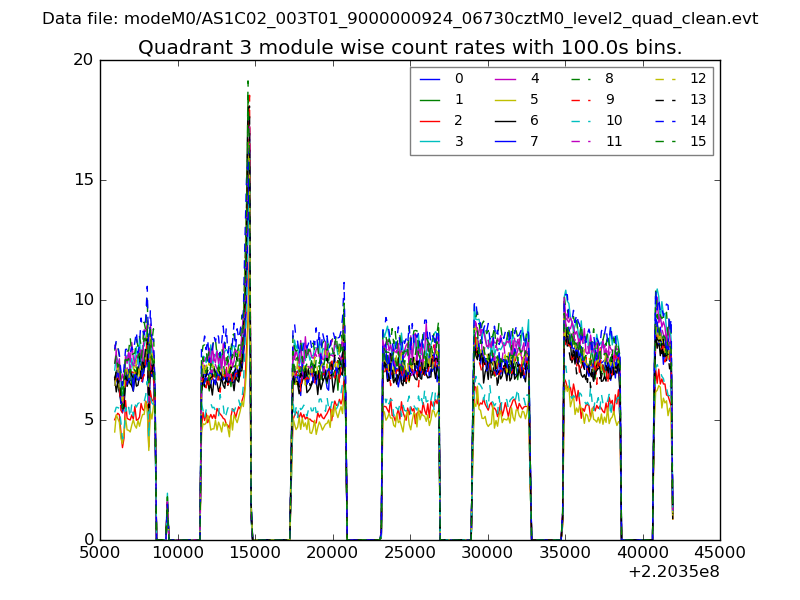
| Module-wise count rates for Quadrant C Data is divided into 100 sec bins |
 |
 |
| Module-wise count rates for Quadrant D Data is divided into 100 sec bins |
 |
 |
| Parameter | Plot |
|---|---|
| CZT HV Monitor | 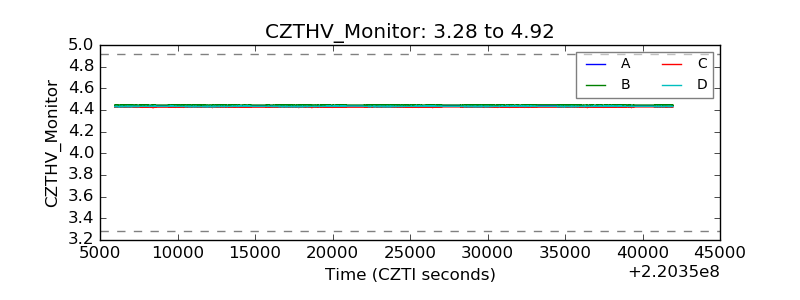 |
| D_VDD | 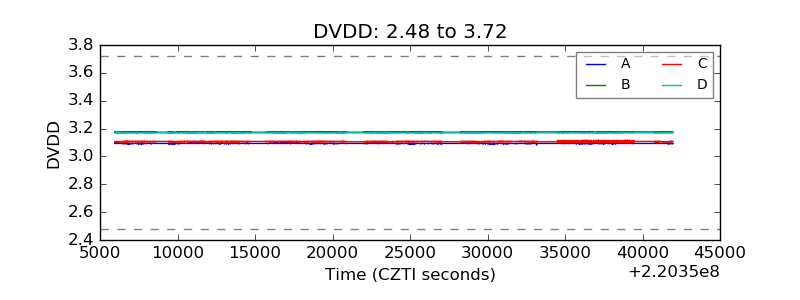 |
| Temperature 1 | 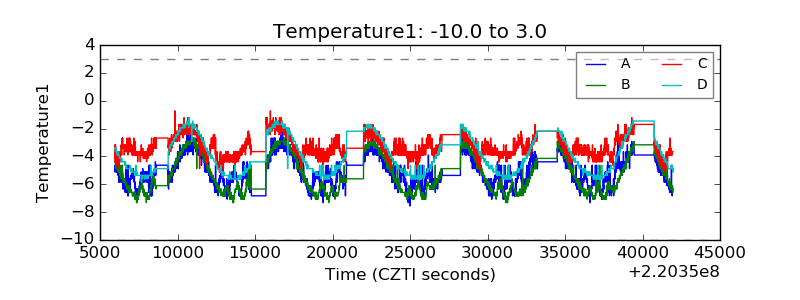 |
| Veto HV Monitor | 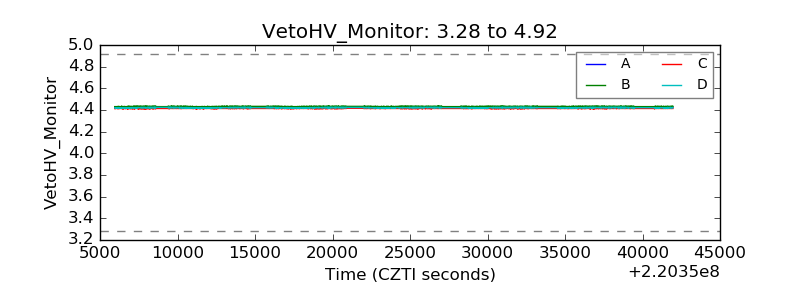 |
| Veto LLD | 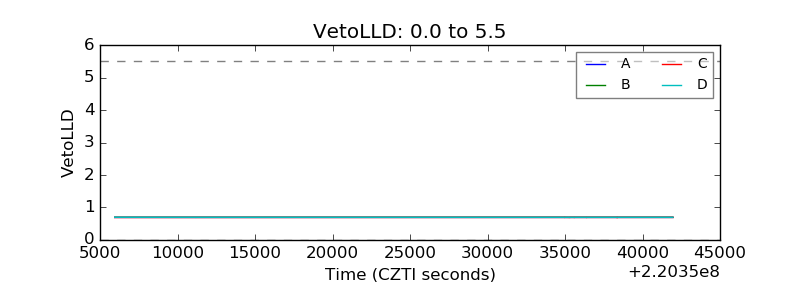 |
| Alpha Counter | 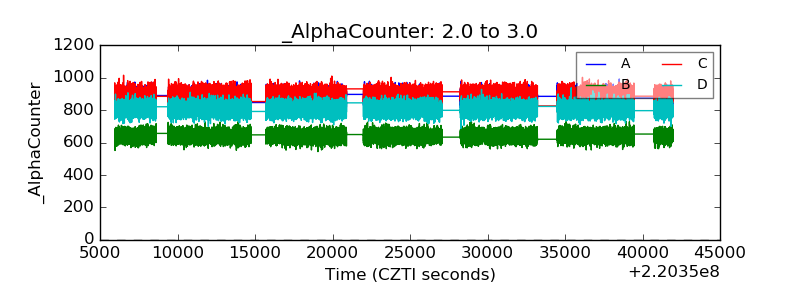 |
| _CPM_Rate | 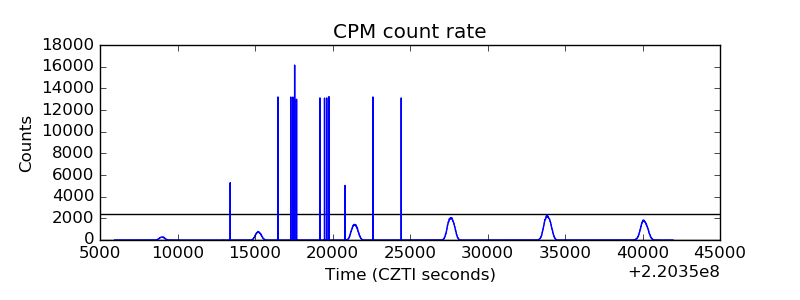 |
| CZT Counter | 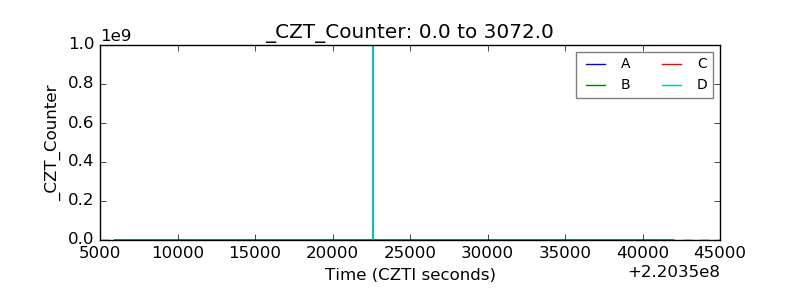 |
| +2.5 Volts monitor |  |
| +5 Volts monitor | 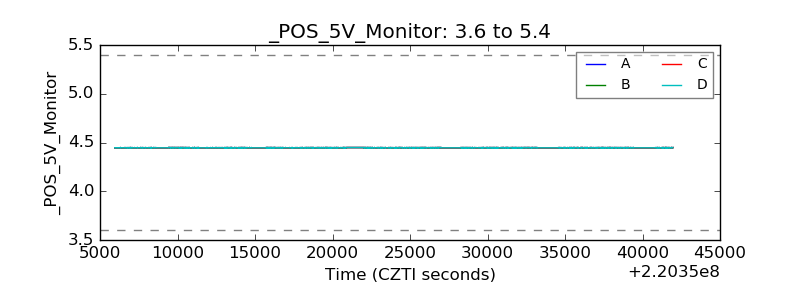 |
| _ROLL_ROT | 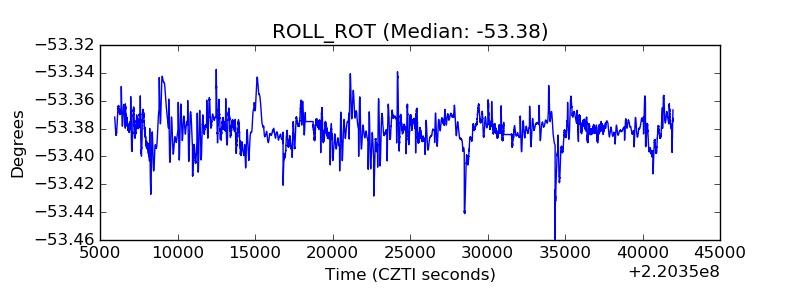 |
| _Roll_DEC | 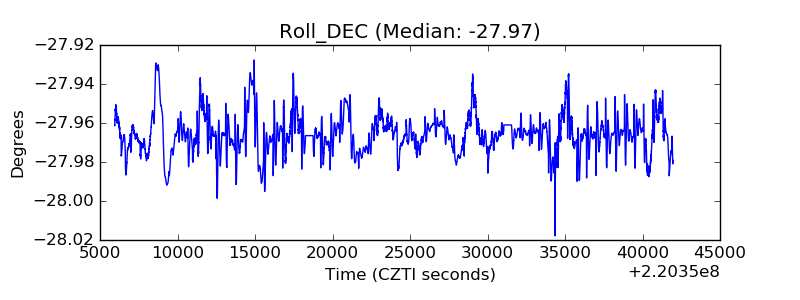 |
| _Roll_RA | 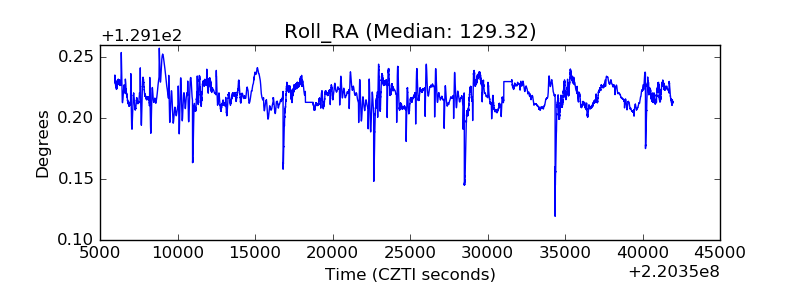 |
| Veto Counter | 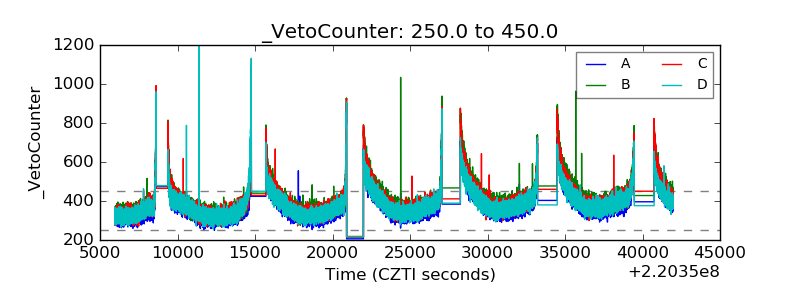 |