| Param | Original file | Final file |
|---|---|---|
| Filename | modeM0/AS1C02_003T01_9000000924_06731cztM0_level2.evt | modeM0/AS1C02_003T01_9000000924_06731cztM0_level2_quad_clean.evt |
| Size (bytes) | 438,304,320 | 104,970,240 |
| Size | 418.0 MB | 100.1 MB |
| Events in quadrant A | 3,144,075 | 687,362 |
| Events in quadrant B | 3,204,701 | 704,379 |
| Events in quadrant C | 3,121,340 | 674,470 |
| Events in quadrant D | 3,344,156 | 641,555 |
| Mode M9 | |||
|---|---|---|---|
| Quadrant | BADHDUFLAG | Total packets | Discarded packets |
| A | 0 | 25 | 0 |
| B | 0 | 25 | 0 |
| C | 0 | 25 | 0 |
| D | 0 | 25 | 0 |
| Mode SS | |||
|---|---|---|---|
| Quadrant | BADHDUFLAG | Total packets | Discarded packets |
| A | 0 | 142 | 0 |
| B | 0 | 142 | 0 |
| C | 0 | 142 | 0 |
| D | 0 | 142 | 0 |
| Mode M0 | |||
|---|---|---|---|
| Quadrant | BADHDUFLAG | Total packets | Discarded packets |
| A | 0 | 13994 | 3 |
| B | 0 | 14090 | 2 |
| C | 0 | 14037 | 2 |
| D | 0 | 14802 | 2 |
| Quadrant | Total seconds | Saturated seconds | Saturation percentage |
|---|---|---|---|
| A | 6751 | 83 | 1.229447% |
| B | 6751 | 101 | 1.496075% |
| C | 6751 | 65 | 0.962820% |
| D | 6751 | 72 | 1.066509% |
Noise dominated data is calculated using 1-second bins in cleaned event files. If a bin has >2000 counts, and if more than 50% of those come from <1% of pixels, then it is considered to be noise-dominated and hence unusable.
| Quadrant | # 1 sec bins | Bins with >0 counts | Bins with >2000 counts | High rate bins dominated by noise | Noise dominated (total time) | Noise dominated (detector-on time) | Marked lightcurve |
|---|---|---|---|---|---|---|---|
| A | 9306 | 6752 | 0 | 0 | 0.00% | 0.00% | 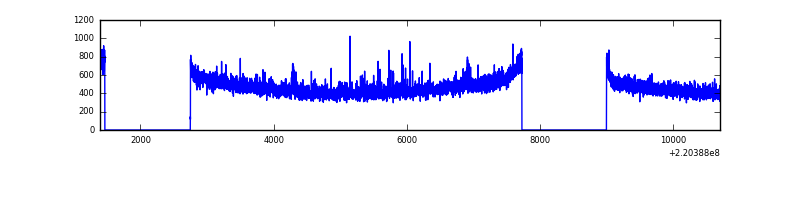 |
| B | 9306 | 6752 | 0 | 0 | 0.00% | 0.00% | 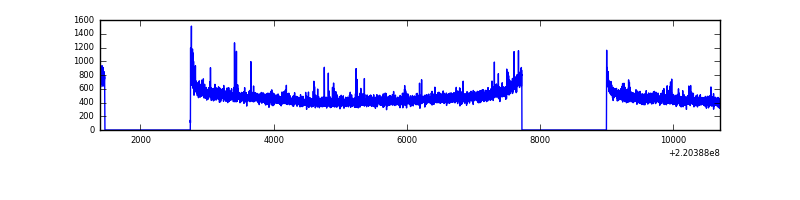 |
| C | 9306 | 6752 | 0 | 0 | 0.00% | 0.00% | 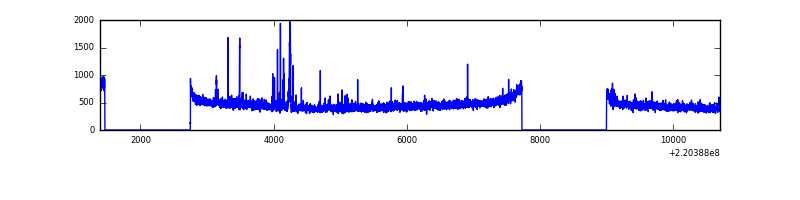 |
| D | 9306 | 6752 | 33 | 33 | 0.35% | 0.49% | 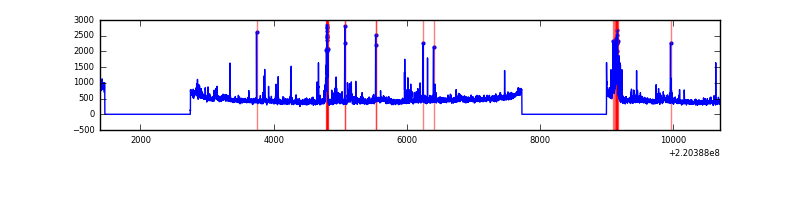 |
Top three noisy pixels from each quadrant. If the there are fewer than three noisy pixels in the level2.evt file, extra rows are filled as -1
| Pixel properties | Quadrant properties | ||||||
|---|---|---|---|---|---|---|---|
| Quadrant | DetID | PixID | Counts | Sigma | Mean | Median | Sigma |
| A | 8 | 15 | 44883 | 271.12 | 798 | 783 | 162.7 |
| A | 13 | 251 | 15433 | 90.07 | 798 | 783 | 162.7 |
| A | 14 | 111 | 10801 | 61.59 | 798 | 783 | 162.7 |
| B | 4 | 81 | 34447 | 219.6 | 810 | 791 | 153.3 |
| B | 12 | 111 | 15744 | 97.57 | 810 | 791 | 153.3 |
| B | 0 | 236 | 15011 | 92.78 | 810 | 791 | 153.3 |
| C | 12 | 16 | 70610 | 388.01 | 777 | 781 | 180.0 |
| C | 10 | 22 | 10996 | 56.76 | 777 | 781 | 180.0 |
| C | 13 | 61 | 6073 | 29.41 | 777 | 781 | 180.0 |
| D | 2 | 152 | 126419 | 674.71 | 765 | 743 | 186.3 |
| D | 2 | 33 | 72291 | 384.11 | 765 | 743 | 186.3 |
| D | 8 | 195 | 68372 | 363.07 | 765 | 743 | 186.3 |
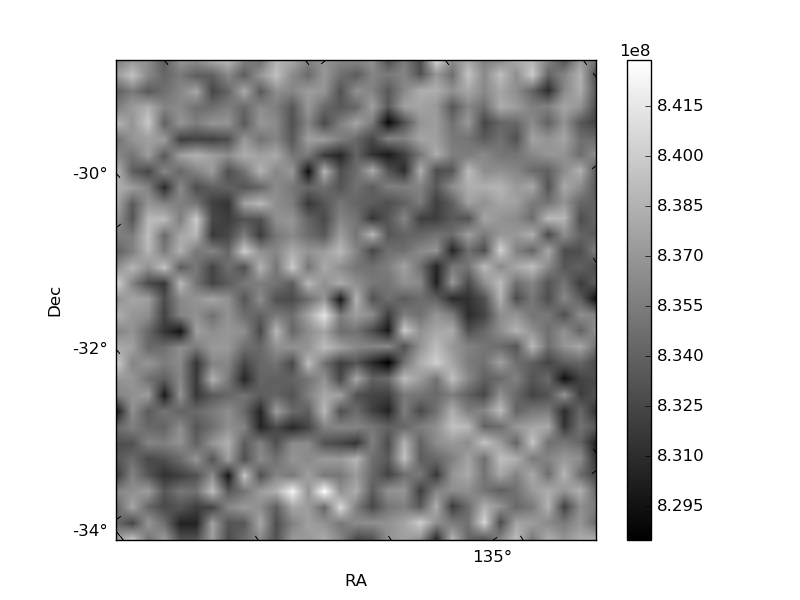
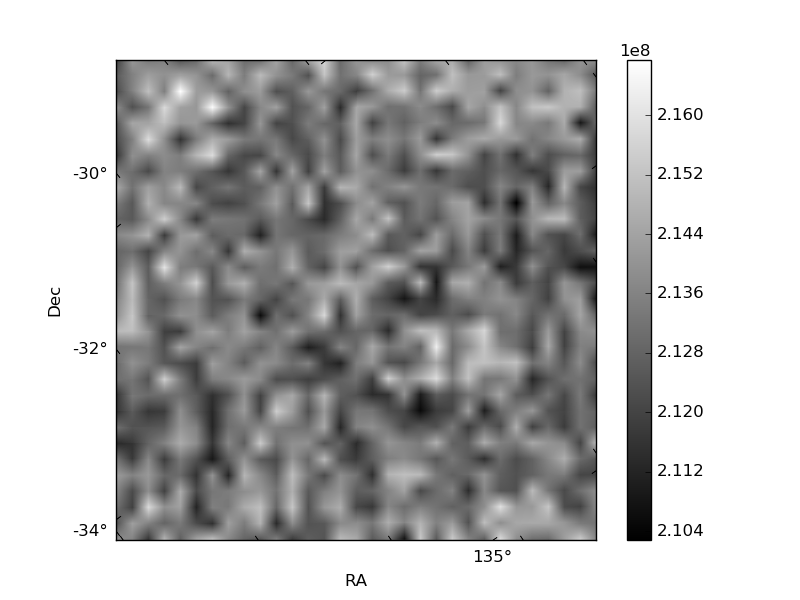
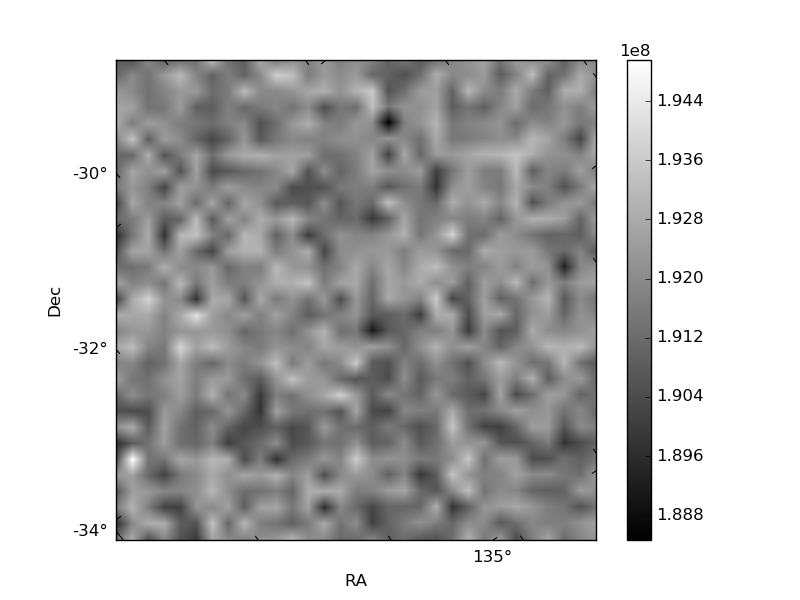
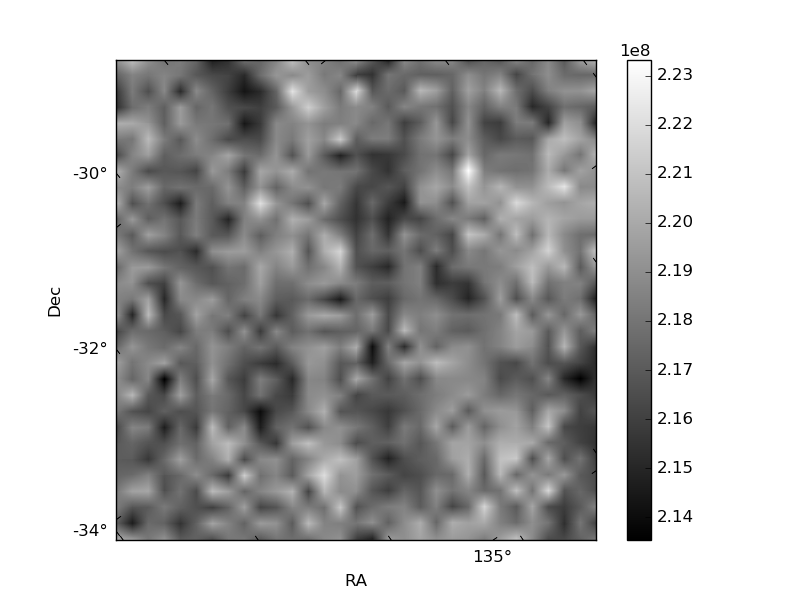
Histogram calculated using DETX and DETY for each event in the final _common_clean file
| Quadrant A | 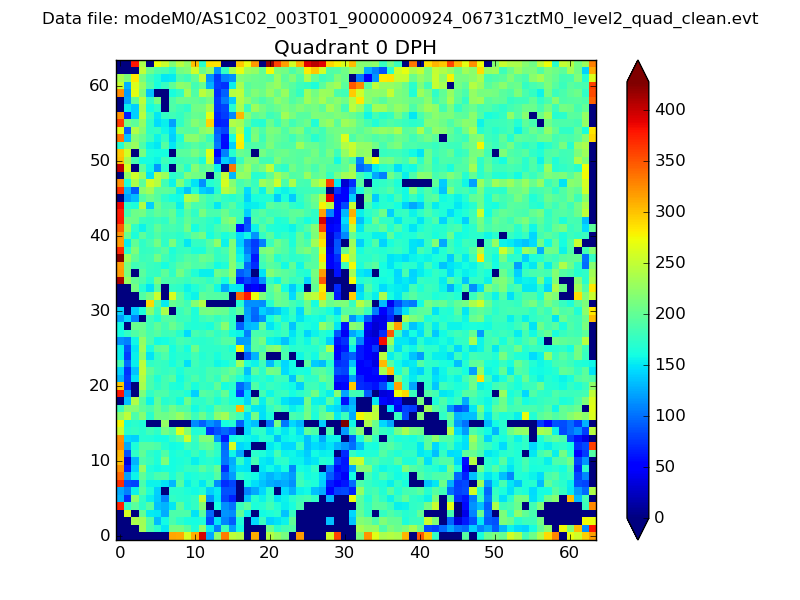 |
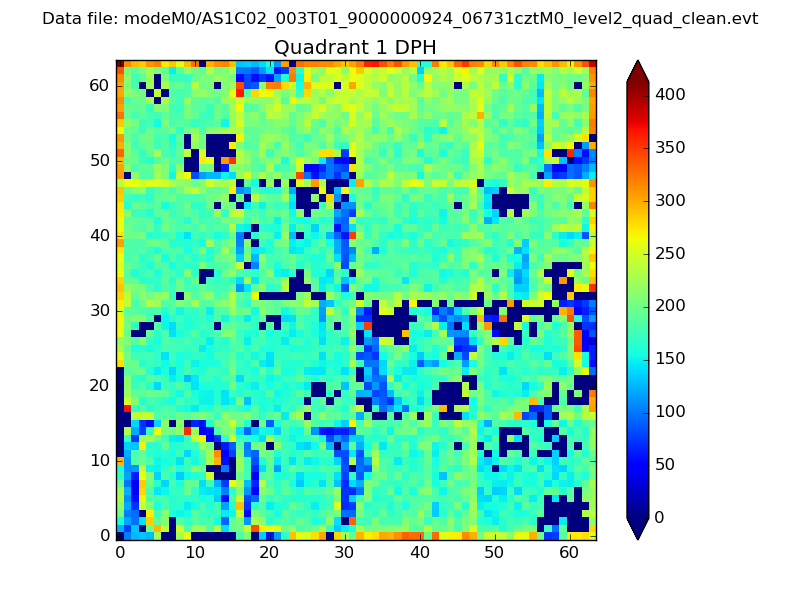 |
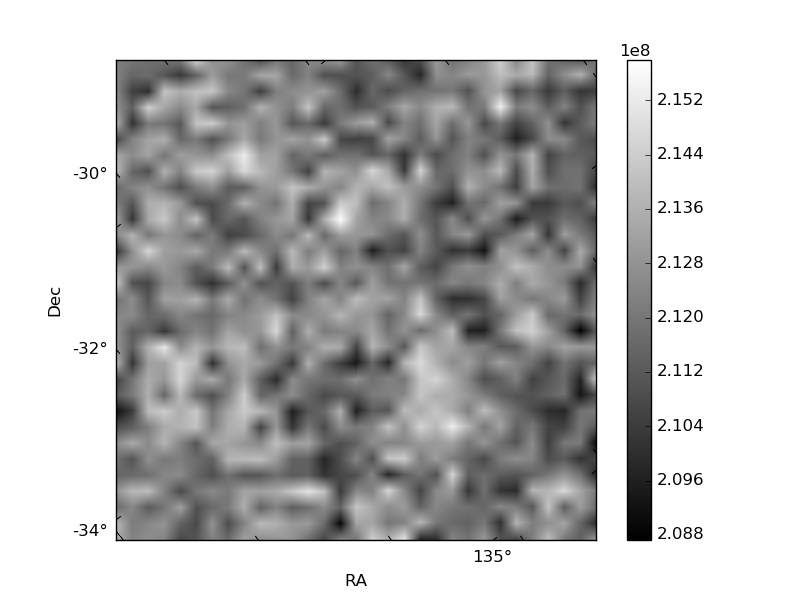
Quadrant B |
|---|---|---|---|
| Quadrant D | 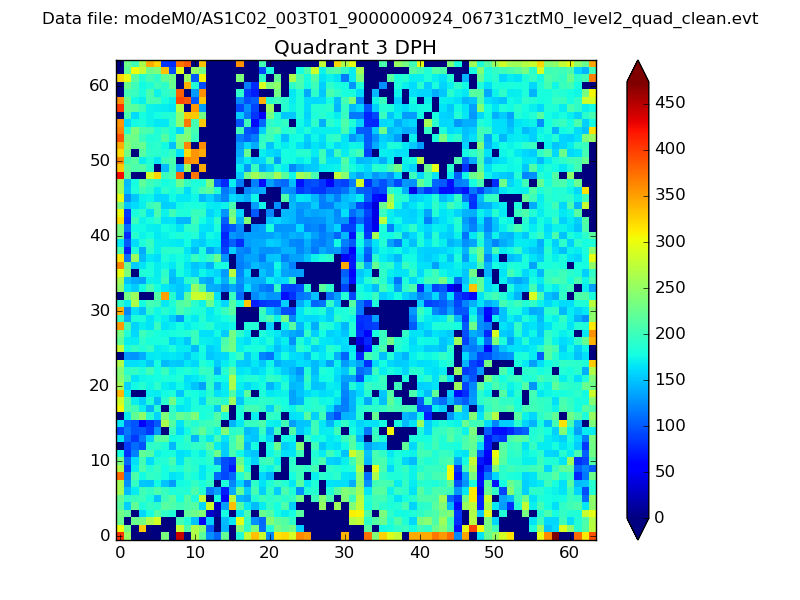 |
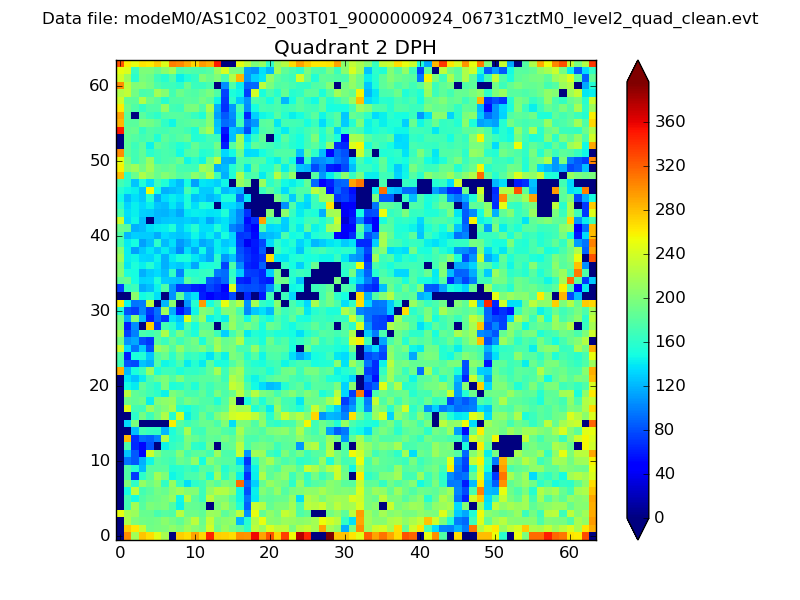 |
Quadrant C |
| Plot type | Count rate plots | Images |
|---|---|---|
| Comparison with Poisson distribution Blue bars denote a histogram of data divided into 1 sec bins. Red curve is a Poisson curve with rate = median count rate of data. |
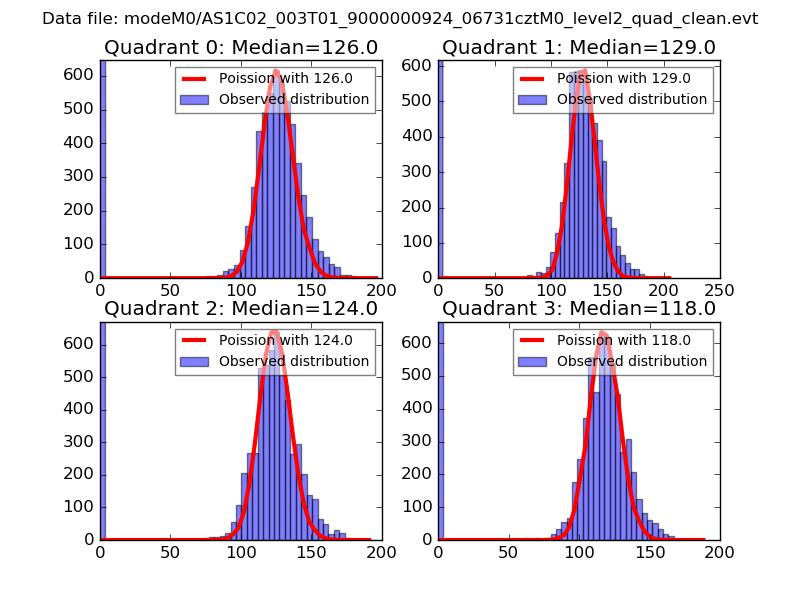 |
 |
| Quadrant-wise count rates Data is divided into 100 sec bins |
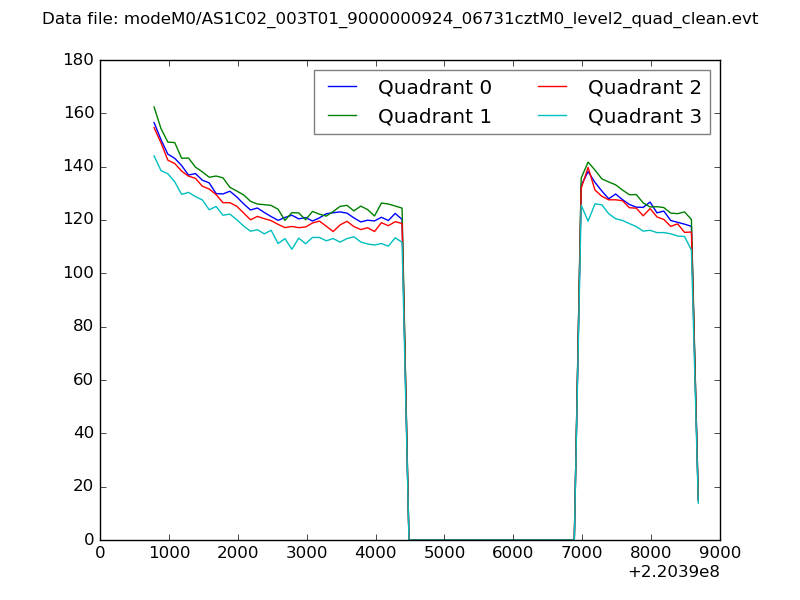 |
|
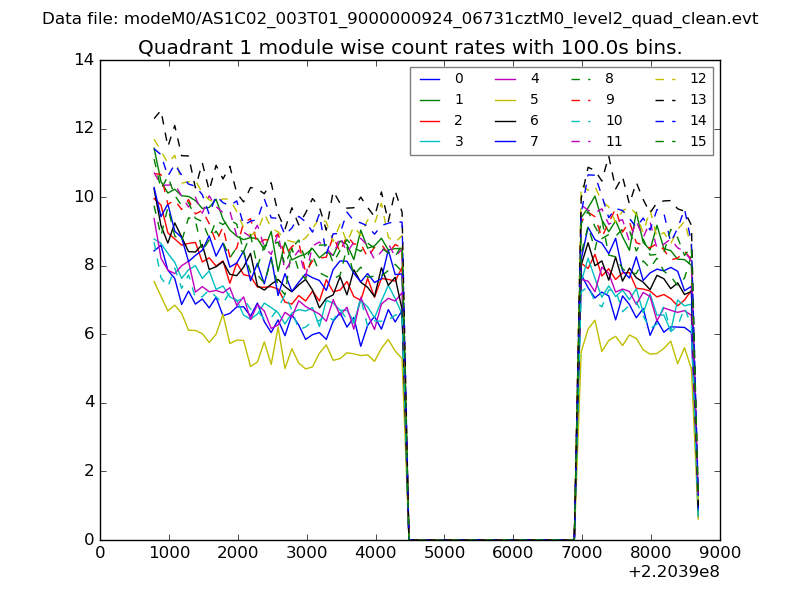
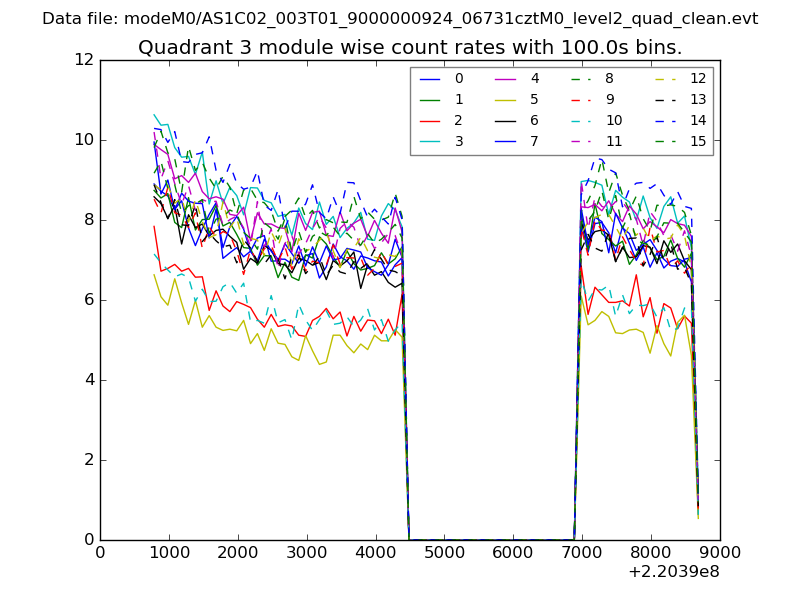
| Module-wise count rates for Quadrant A Data is divided into 100 sec bins |
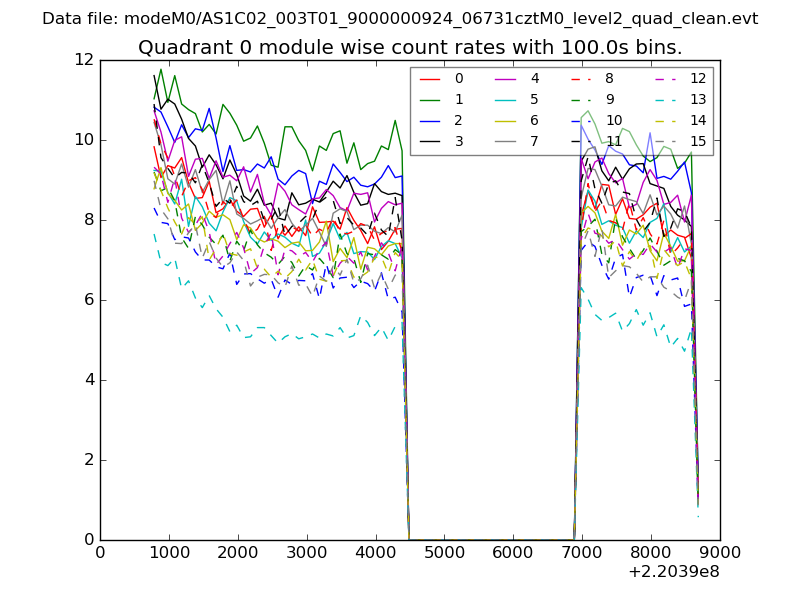 |
 |
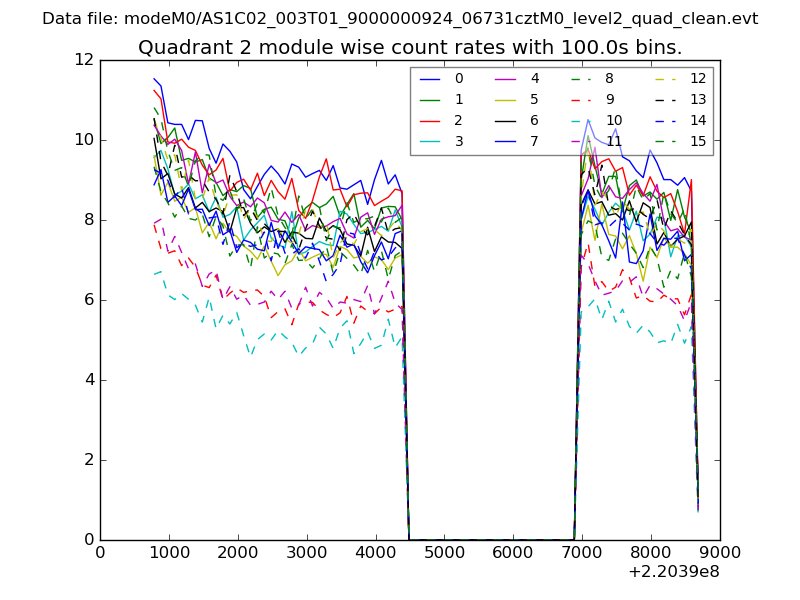
| Module-wise count rates for Quadrant B Data is divided into 100 sec bins |
 |
 |
| Module-wise count rates for Quadrant C Data is divided into 100 sec bins |
 |
 |
| Module-wise count rates for Quadrant D Data is divided into 100 sec bins |
 |
 |
| Parameter | Plot |
|---|---|
| CZT HV Monitor | 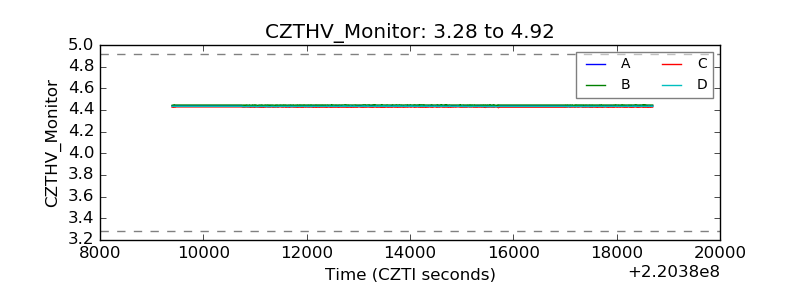 |
| D_VDD | 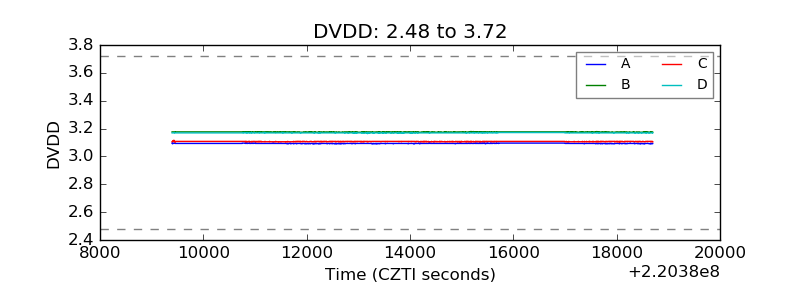 |
| Temperature 1 | 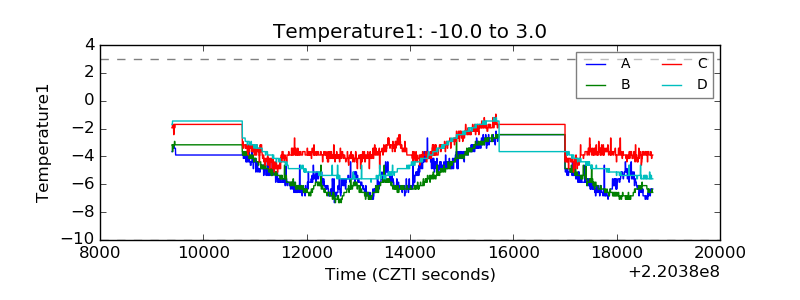 |
| Veto HV Monitor | 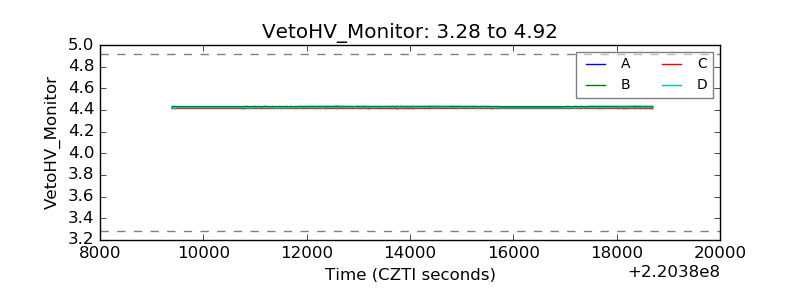 |
| Veto LLD | 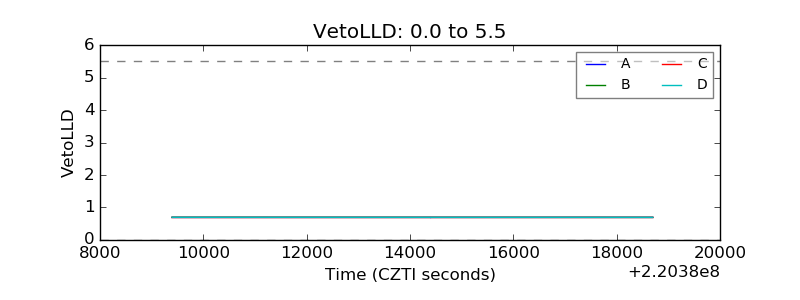 |
| Alpha Counter | 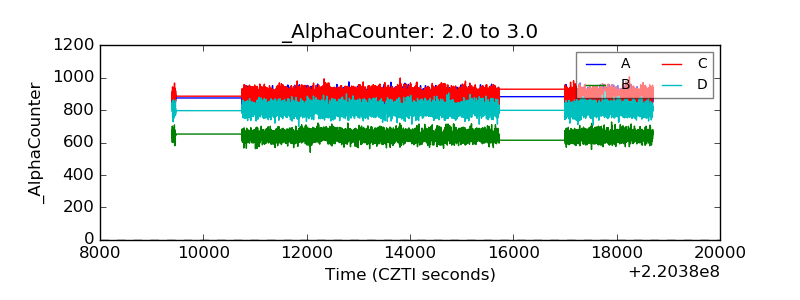 |
| _CPM_Rate | 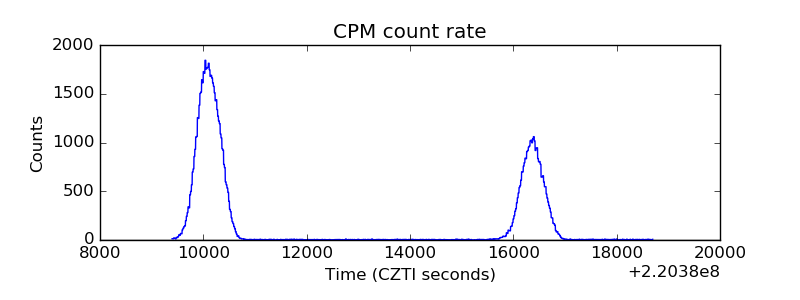 |
| CZT Counter | 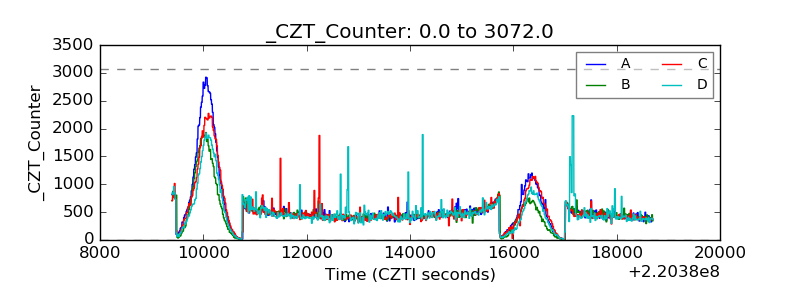 |
| +2.5 Volts monitor |  |
| +5 Volts monitor |  |
| _ROLL_ROT | 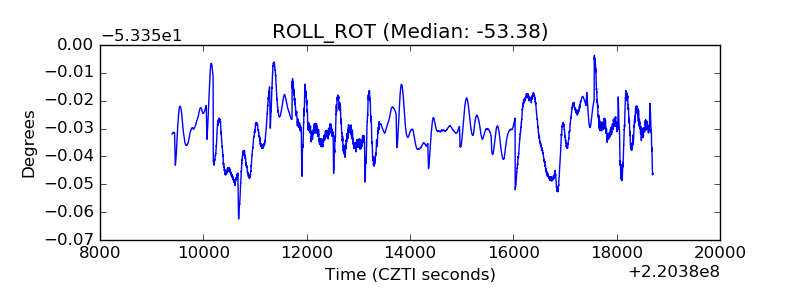 |
| _Roll_DEC | 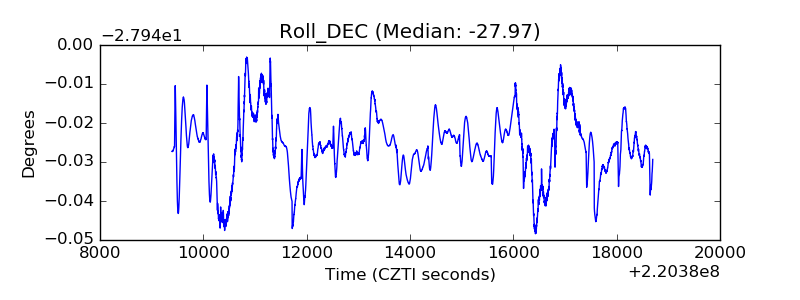 |
| _Roll_RA | 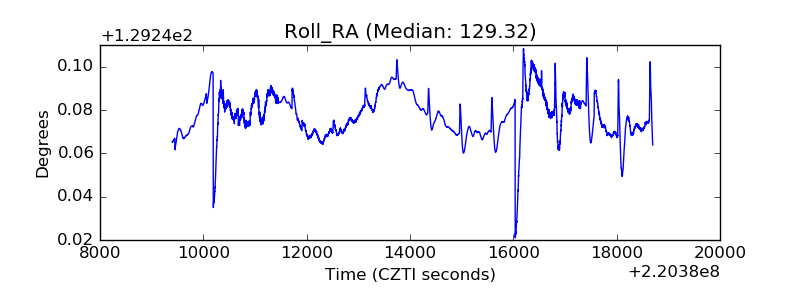 |
| Veto Counter | 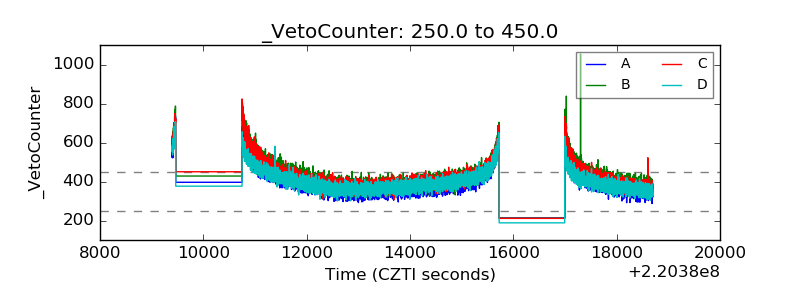 |