| Param | Original file | Final file |
|---|---|---|
| Filename | modeM0/AS1C02_003T01_9000000924_06732cztM0_level2.evt | modeM0/AS1C02_003T01_9000000924_06732cztM0_level2_quad_clean.evt |
| Size (bytes) | 449,026,560 | 93,749,760 |
| Size | 428.2 MB | 89.4 MB |
| Events in quadrant A | 3,224,472 | 597,750 |
| Events in quadrant B | 3,361,959 | 608,879 |
| Events in quadrant C | 3,141,740 | 588,839 |
| Events in quadrant D | 3,399,856 | 561,296 |
| Mode M9 | |||
|---|---|---|---|
| Quadrant | BADHDUFLAG | Total packets | Discarded packets |
| A | 0 | 22 | 0 |
| B | 0 | 22 | 0 |
| C | 0 | 22 | 0 |
| D | 0 | 22 | 0 |
| Mode SS | |||
|---|---|---|---|
| Quadrant | BADHDUFLAG | Total packets | Discarded packets |
| A | 0 | 144 | 0 |
| B | 0 | 144 | 0 |
| C | 0 | 144 | 0 |
| D | 0 | 144 | 0 |
| Mode M0 | |||
|---|---|---|---|
| Quadrant | BADHDUFLAG | Total packets | Discarded packets |
| A | 0 | 14568 | 3 |
| B | 0 | 14848 | 2 |
| C | 0 | 14371 | 2 |
| D | 0 | 15255 | 2 |
| Quadrant | Total seconds | Saturated seconds | Saturation percentage |
|---|---|---|---|
| A | 6918 | 71 | 1.026308% |
| B | 6918 | 97 | 1.402139% |
| C | 6918 | 22 | 0.318011% |
| D | 6918 | 68 | 0.982943% |
Noise dominated data is calculated using 1-second bins in cleaned event files. If a bin has >2000 counts, and if more than 50% of those come from <1% of pixels, then it is considered to be noise-dominated and hence unusable.
| Quadrant | # 1 sec bins | Bins with >0 counts | Bins with >2000 counts | High rate bins dominated by noise | Noise dominated (total time) | Noise dominated (detector-on time) | Marked lightcurve |
|---|---|---|---|---|---|---|---|
| A | 9218 | 6919 | 0 | 0 | 0.00% | 0.00% | 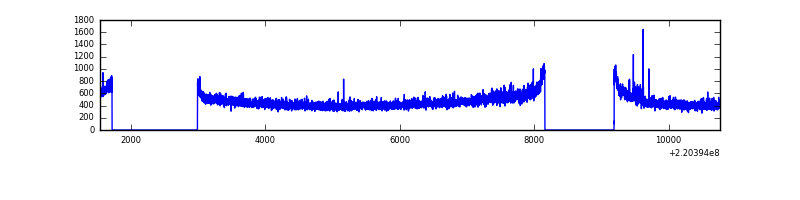 |
| B | 9218 | 6919 | 20 | 20 | 0.22% | 0.29% | 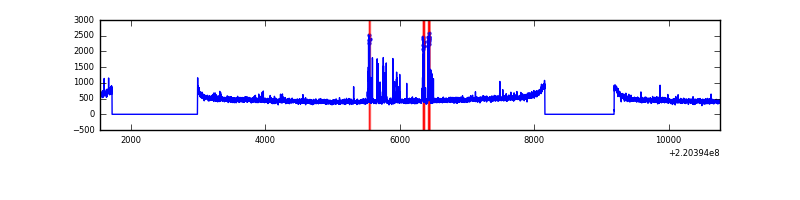 |
| C | 9218 | 6919 | 0 | 0 | 0.00% | 0.00% | 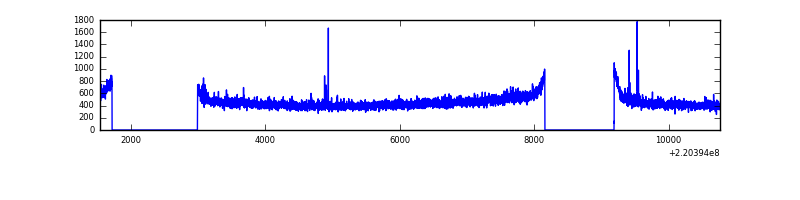 |
| D | 9218 | 6919 | 24 | 24 | 0.26% | 0.35% |  |
Top three noisy pixels from each quadrant. If the there are fewer than three noisy pixels in the level2.evt file, extra rows are filled as -1
| Pixel properties | Quadrant properties | ||||||
|---|---|---|---|---|---|---|---|
| Quadrant | DetID | PixID | Counts | Sigma | Mean | Median | Sigma |
| A | 8 | 15 | 39184 | 230.92 | 812 | 794 | 166.2 |
| A | 14 | 111 | 34773 | 204.39 | 812 | 794 | 166.2 |
| A | 13 | 251 | 27502 | 160.65 | 812 | 794 | 166.2 |
| B | 4 | 81 | 166735 | 1055.79 | 823 | 805 | 157.2 |
| B | 12 | 111 | 16354 | 98.94 | 823 | 805 | 157.2 |
| B | 11 | 111 | 12911 | 77.03 | 823 | 805 | 157.2 |
| C | 12 | 16 | 34474 | 183.0 | 792 | 794 | 184.0 |
| C | 9 | 16 | 8214 | 40.32 | 792 | 794 | 184.0 |
| C | 13 | 61 | 6240 | 29.59 | 792 | 794 | 184.0 |
| D | 2 | 152 | 109156 | 564.91 | 782 | 759 | 191.9 |
| D | 8 | 195 | 99802 | 516.16 | 782 | 759 | 191.9 |
| D | 2 | 33 | 85398 | 441.09 | 782 | 759 | 191.9 |
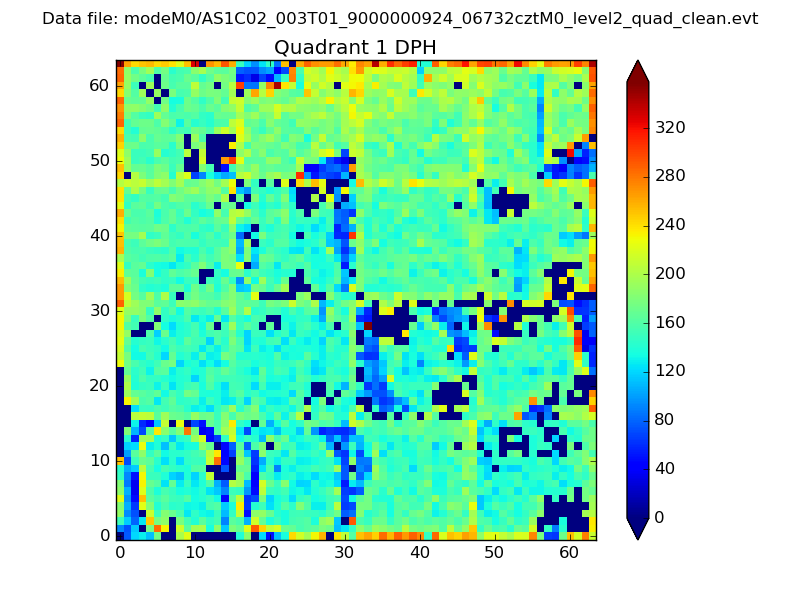
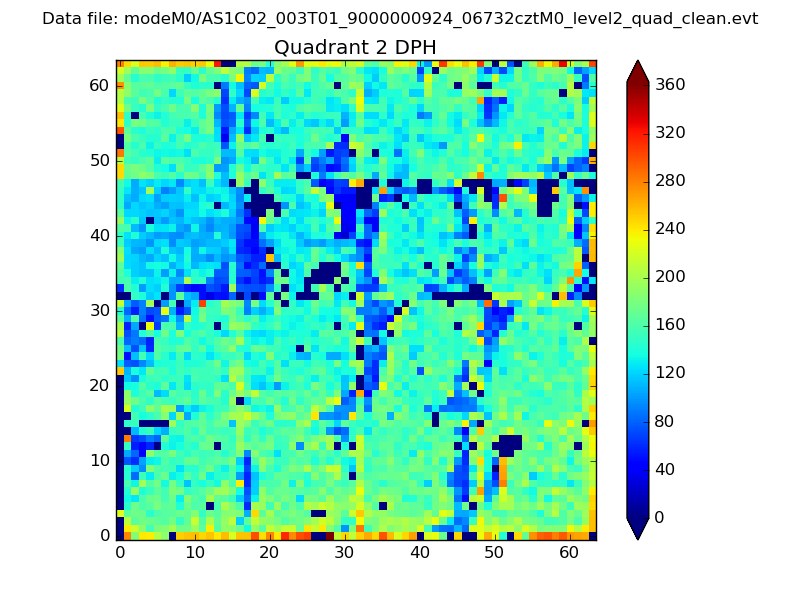
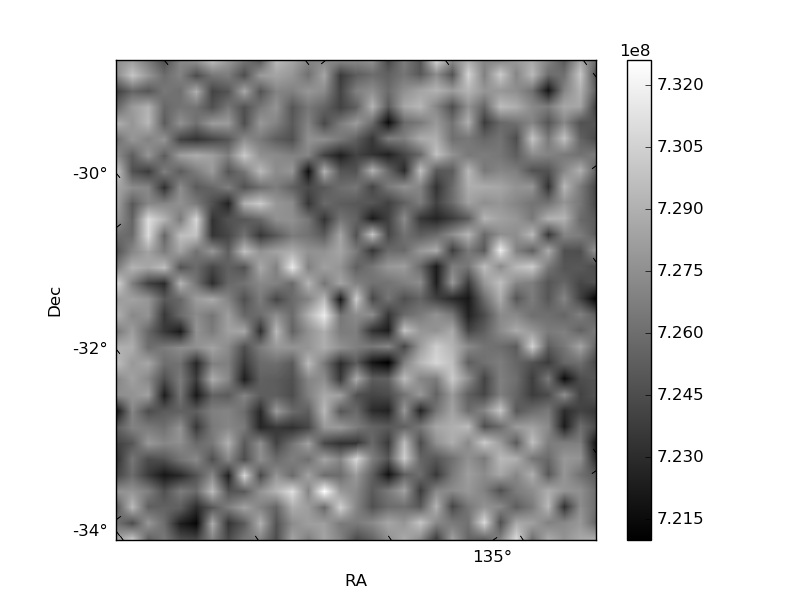
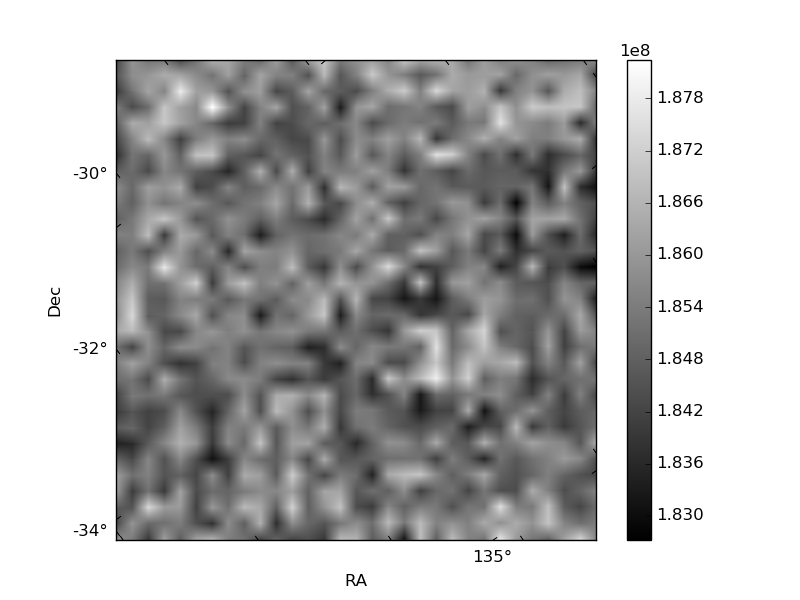
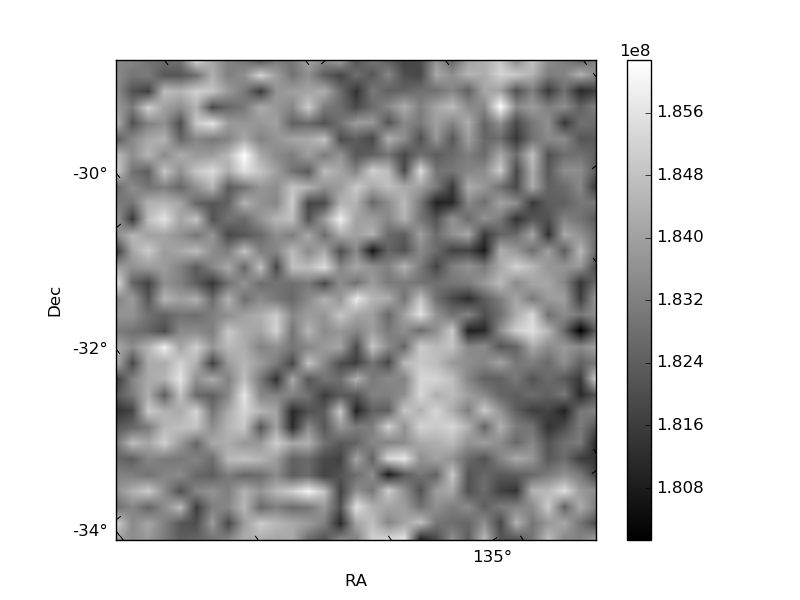
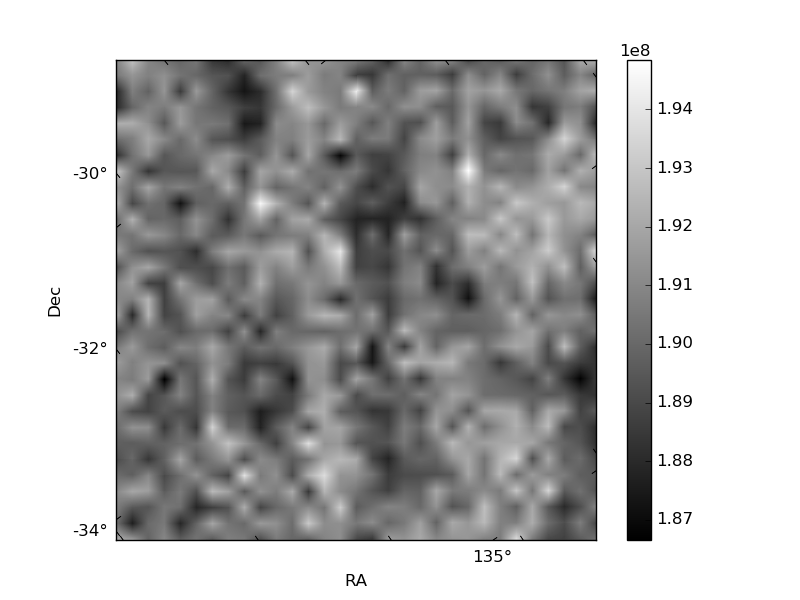
Histogram calculated using DETX and DETY for each event in the final _common_clean file
| Quadrant A | 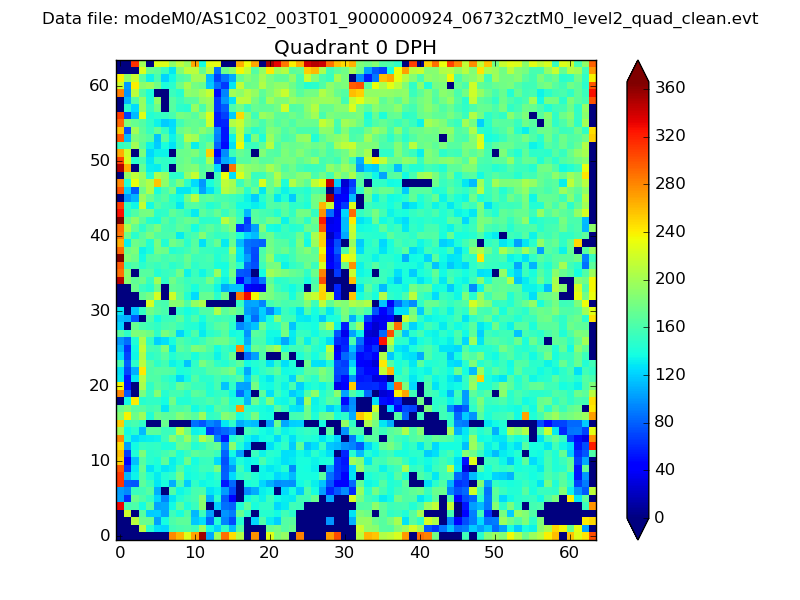 |
 |
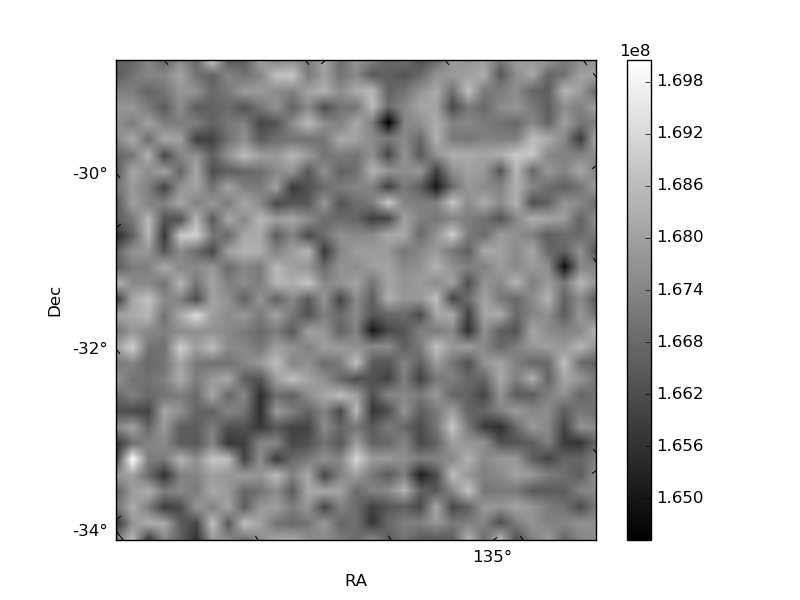
Quadrant B |
|---|---|---|---|
| Quadrant D | 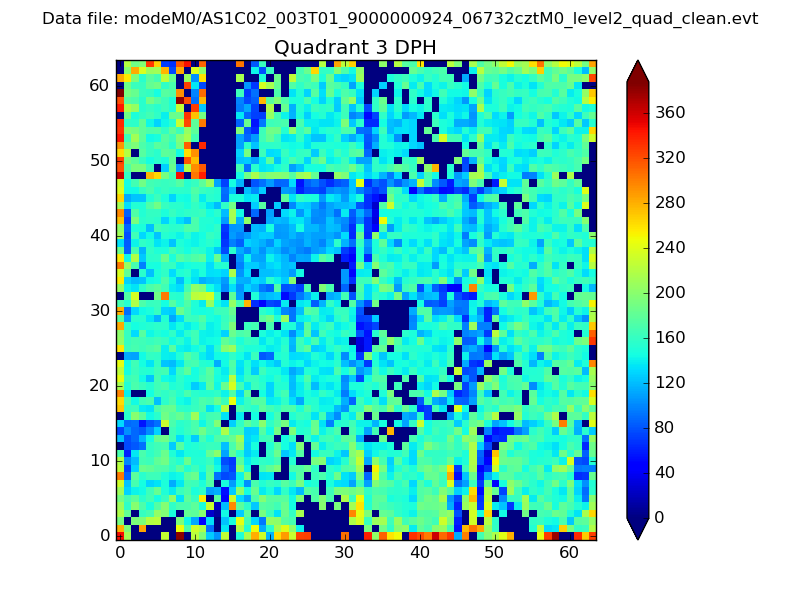 |
 |
Quadrant C |
| Plot type | Count rate plots | Images |
|---|---|---|
| Comparison with Poisson distribution Blue bars denote a histogram of data divided into 1 sec bins. Red curve is a Poisson curve with rate = median count rate of data. |
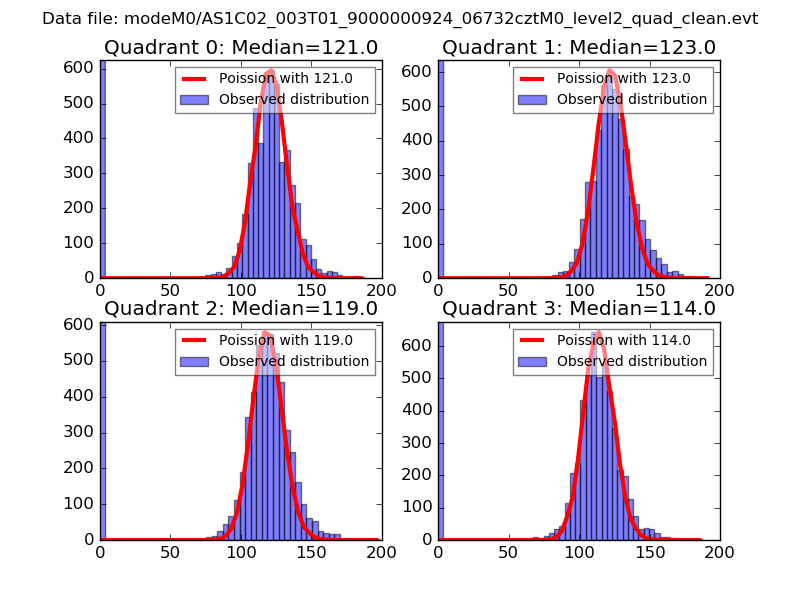 |
 |
| Quadrant-wise count rates Data is divided into 100 sec bins |
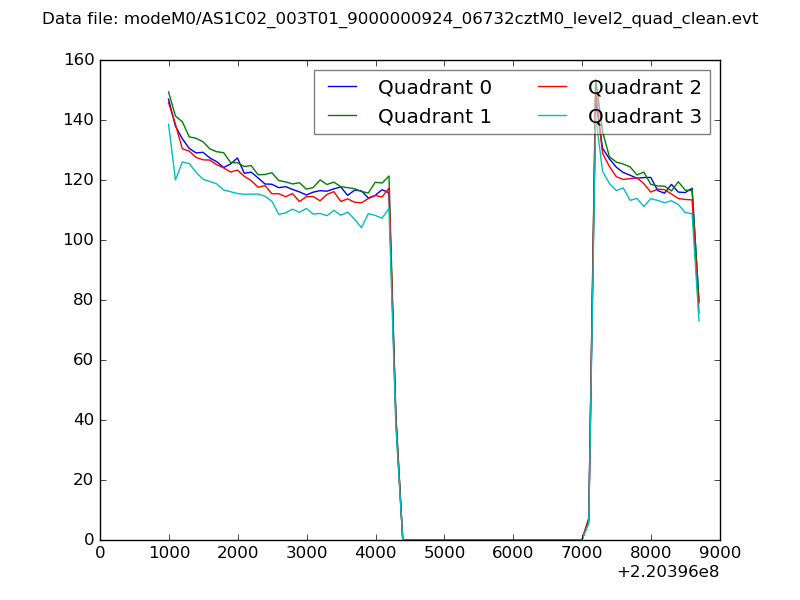 |
|
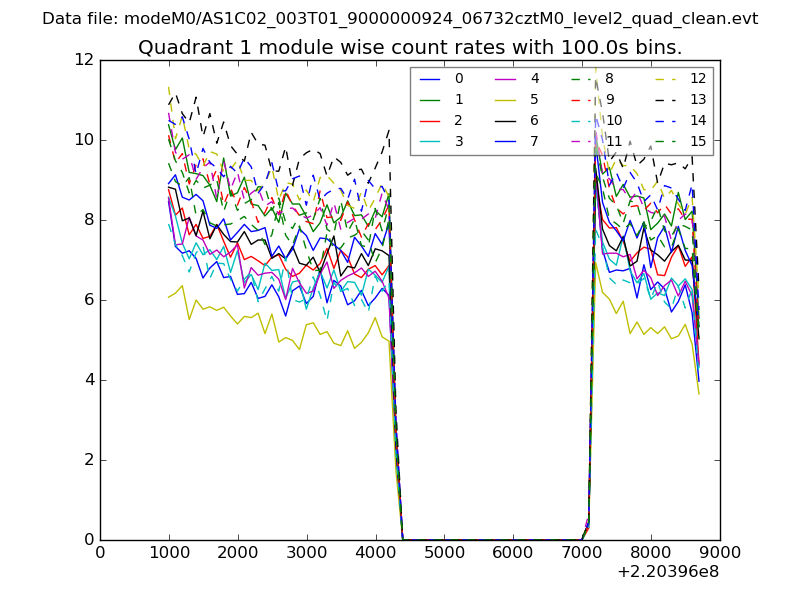
| Module-wise count rates for Quadrant A Data is divided into 100 sec bins |
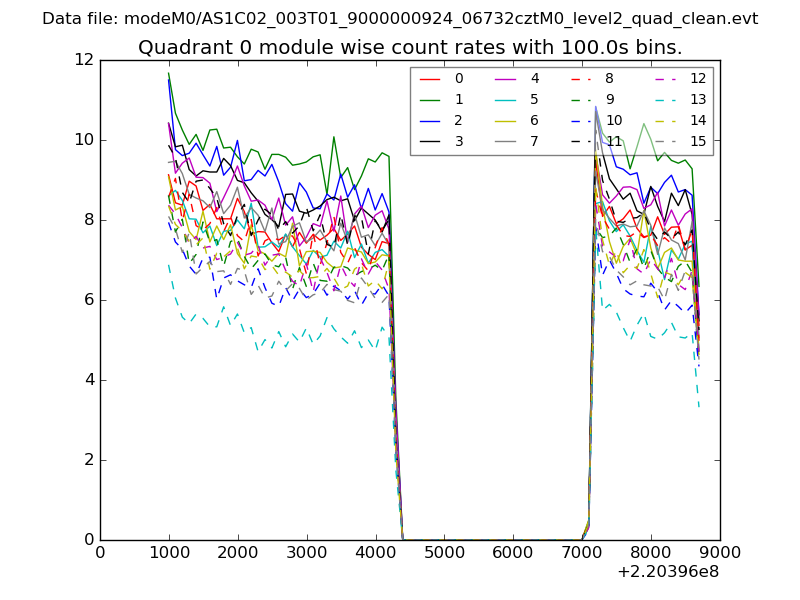 |
 |
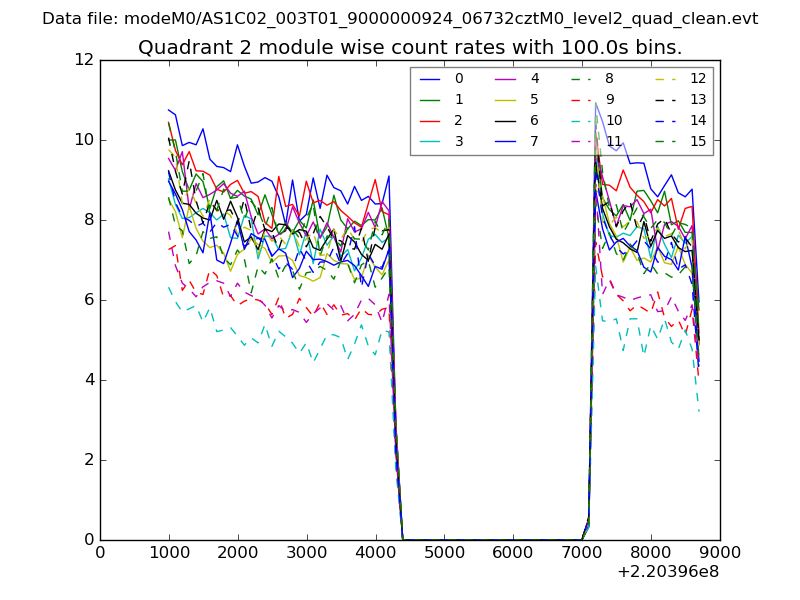
| Module-wise count rates for Quadrant B Data is divided into 100 sec bins |
 |
 |
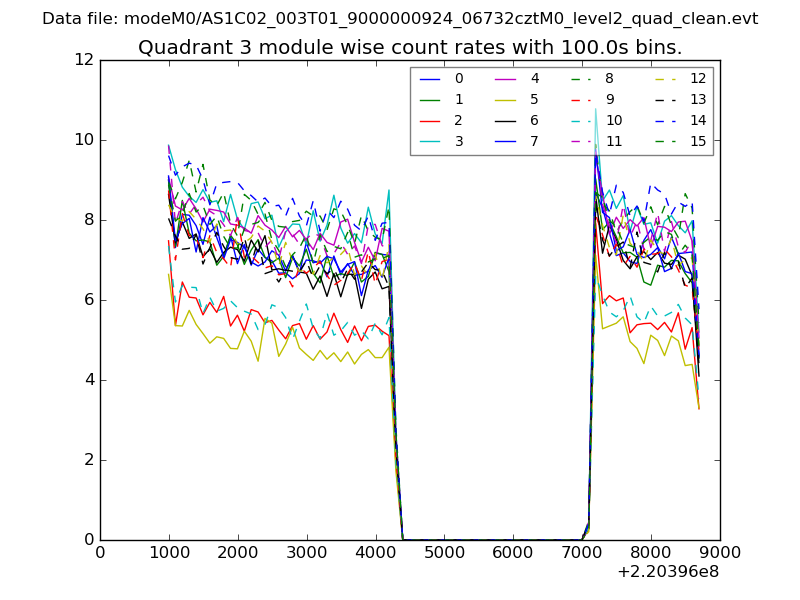
| Module-wise count rates for Quadrant C Data is divided into 100 sec bins |
 |
 |
| Module-wise count rates for Quadrant D Data is divided into 100 sec bins |
 |
 |
| Parameter | Plot |
|---|---|
| CZT HV Monitor | 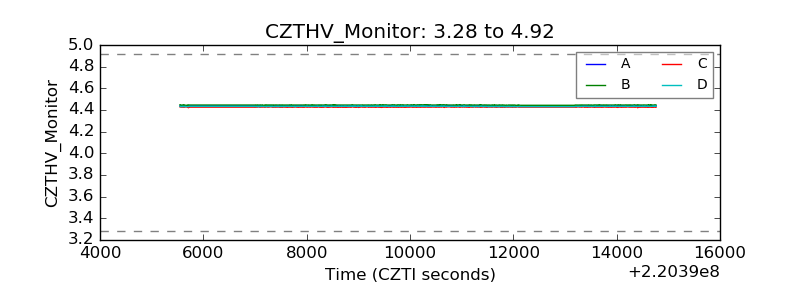 |
| D_VDD | 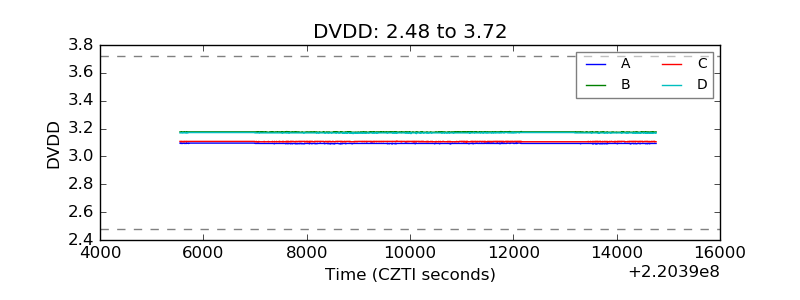 |
| Temperature 1 | 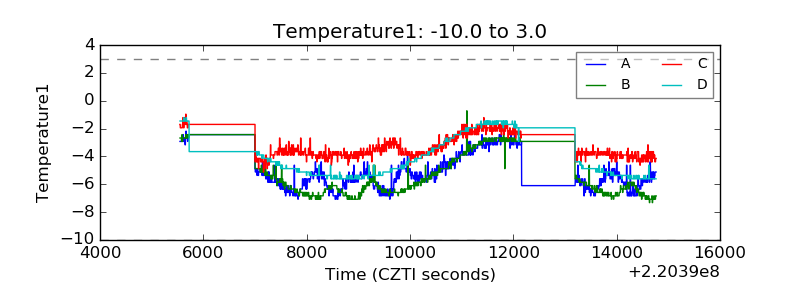 |
| Veto HV Monitor | 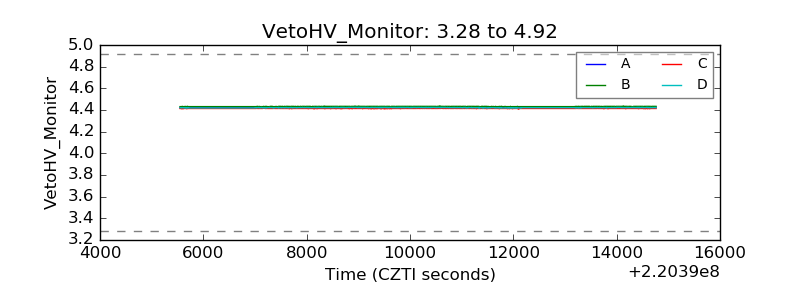 |
| Veto LLD | 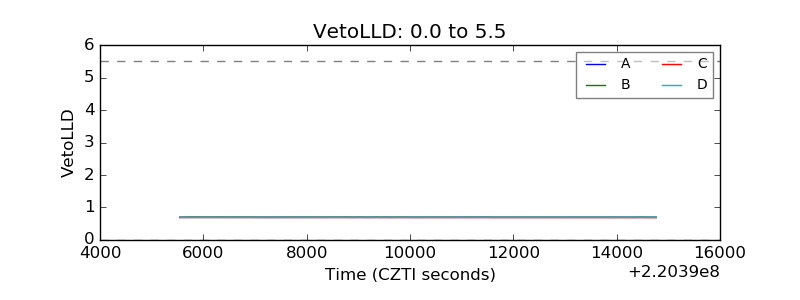 |
| Alpha Counter | 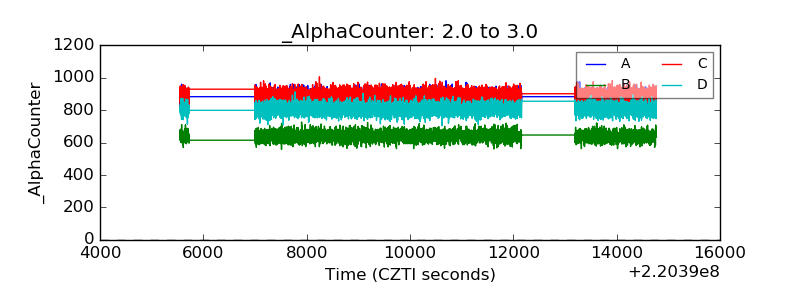 |
| _CPM_Rate | 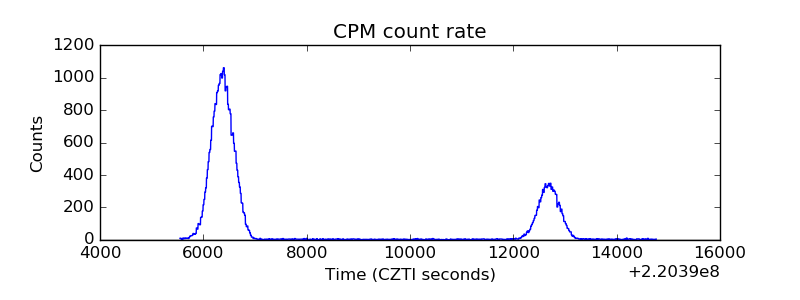 |
| CZT Counter | 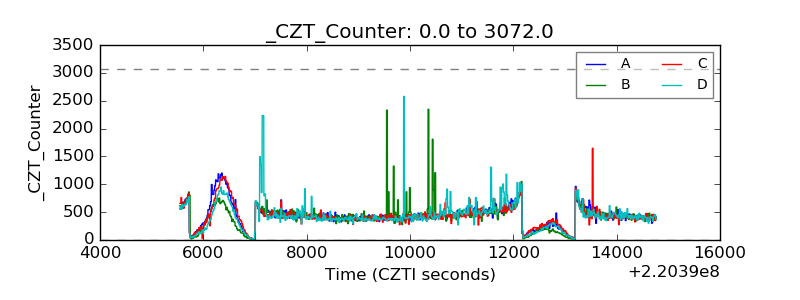 |
| +2.5 Volts monitor |  |
| +5 Volts monitor |  |
| _ROLL_ROT | 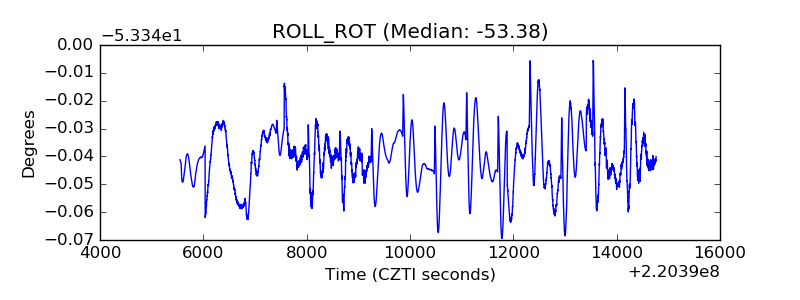 |
| _Roll_DEC | 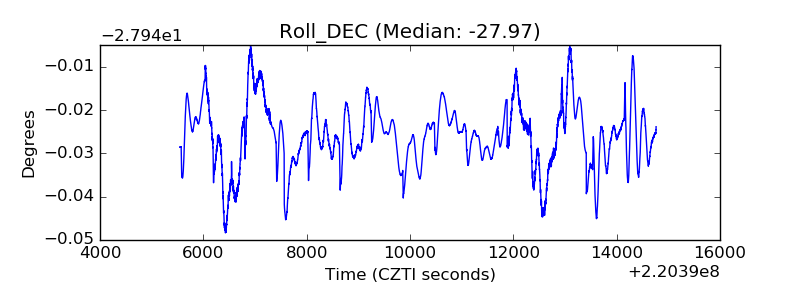 |
| _Roll_RA | 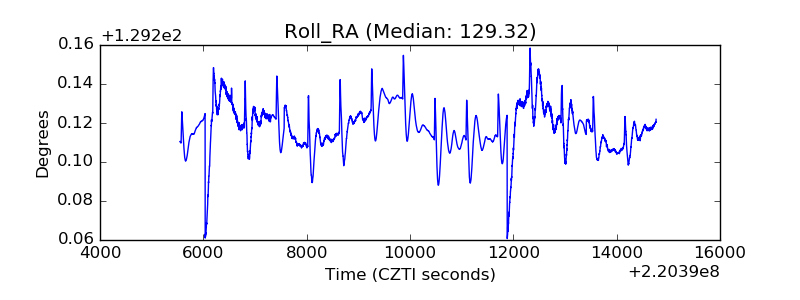 |
| Veto Counter | 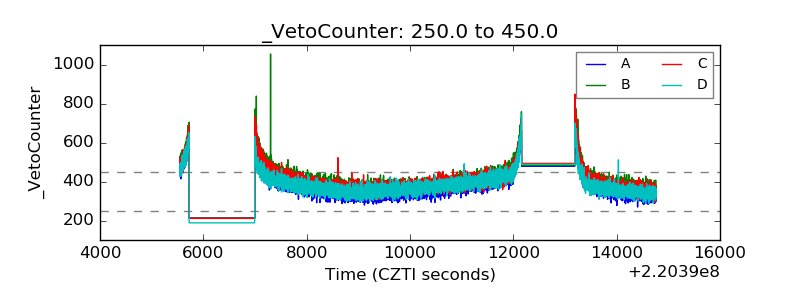 |