| Param | Original file | Final file |
|---|---|---|
| Filename | modeM0/AS1C02_003T01_9000000924_06734cztM0_level2.evt | modeM0/AS1C02_003T01_9000000924_06734cztM0_level2_quad_clean.evt |
| Size (bytes) | 485,743,680 | 98,346,240 |
| Size | 463.2 MB | 93.8 MB |
| Events in quadrant A | 3,380,207 | 622,583 |
| Events in quadrant B | 3,373,209 | 632,390 |
| Events in quadrant C | 3,519,651 | 615,047 |
| Events in quadrant D | 3,931,413 | 589,800 |
| Mode M9 | |||
|---|---|---|---|
| Quadrant | BADHDUFLAG | Total packets | Discarded packets |
| A | 0 | 5 | 0 |
| B | 0 | 5 | 0 |
| C | 0 | 5 | 0 |
| D | 0 | 6 | 0 |
| Mode SS | |||
|---|---|---|---|
| Quadrant | BADHDUFLAG | Total packets | Discarded packets |
| A | 0 | 152 | 0 |
| B | 0 | 152 | 0 |
| C | 0 | 152 | 0 |
| D | 0 | 152 | 0 |
| Mode M0 | |||
|---|---|---|---|
| Quadrant | BADHDUFLAG | Total packets | Discarded packets |
| A | 0 | 15318 | 4 |
| B | 0 | 15278 | 3 |
| C | 0 | 15696 | 3 |
| D | 0 | 16799 | 3 |
| Quadrant | Total seconds | Saturated seconds | Saturation percentage |
|---|---|---|---|
| A | 7447 | 43 | 0.577414% |
| B | 7447 | 61 | 0.819122% |
| C | 7447 | 55 | 0.738552% |
| D | 7447 | 68 | 0.913119% |
Noise dominated data is calculated using 1-second bins in cleaned event files. If a bin has >2000 counts, and if more than 50% of those come from <1% of pixels, then it is considered to be noise-dominated and hence unusable.
| Quadrant | # 1 sec bins | Bins with >0 counts | Bins with >2000 counts | High rate bins dominated by noise | Noise dominated (total time) | Noise dominated (detector-on time) | Marked lightcurve |
|---|---|---|---|---|---|---|---|
| A | 7757 | 7449 | 3 | 3 | 0.04% | 0.04% | 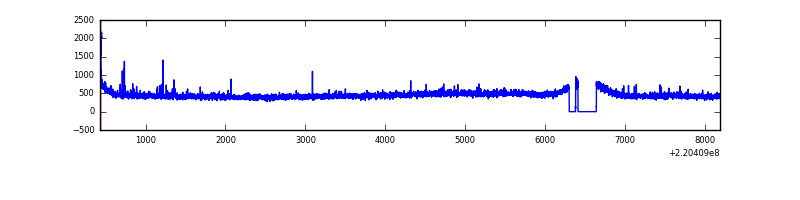 |
| B | 7757 | 7449 | 0 | 0 | 0.00% | 0.00% | 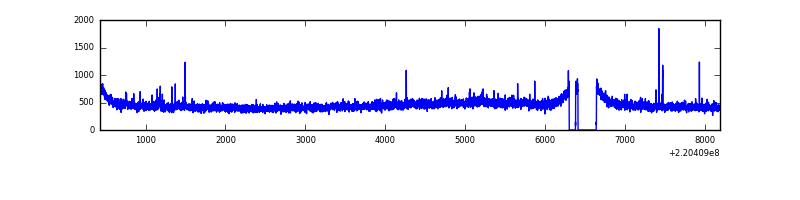 |
| C | 7757 | 7449 | 4 | 4 | 0.05% | 0.05% | 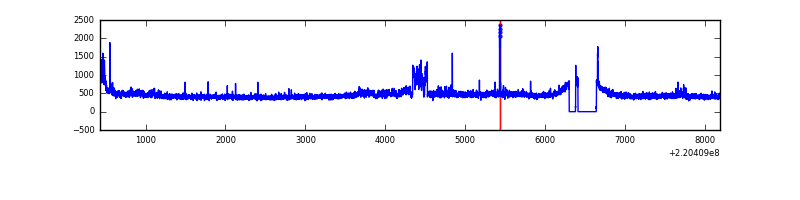 |
| D | 7757 | 7449 | 23 | 23 | 0.30% | 0.31% |  |
Top three noisy pixels from each quadrant. If the there are fewer than three noisy pixels in the level2.evt file, extra rows are filled as -1
| Pixel properties | Quadrant properties | ||||||
|---|---|---|---|---|---|---|---|
| Quadrant | DetID | PixID | Counts | Sigma | Mean | Median | Sigma |
| A | 8 | 15 | 57073 | 324.13 | 845 | 825 | 173.5 |
| A | 14 | 111 | 45338 | 256.51 | 845 | 825 | 173.5 |
| A | 3 | 1 | 26273 | 146.64 | 845 | 825 | 173.5 |
| B | 4 | 81 | 40519 | 241.96 | 858 | 836 | 164.0 |
| B | 12 | 111 | 17571 | 102.04 | 858 | 836 | 164.0 |
| B | 11 | 111 | 14051 | 80.58 | 858 | 836 | 164.0 |
| C | 12 | 16 | 194878 | 999.73 | 830 | 831 | 194.1 |
| C | 9 | 16 | 83484 | 425.83 | 830 | 831 | 194.1 |
| C | 13 | 61 | 6396 | 28.67 | 830 | 831 | 194.1 |
| D | 8 | 195 | 411413 | 2067.65 | 821 | 792 | 198.6 |
| D | 7 | 203 | 139706 | 699.49 | 821 | 792 | 198.6 |
| D | 2 | 136 | 82662 | 412.25 | 821 | 792 | 198.6 |
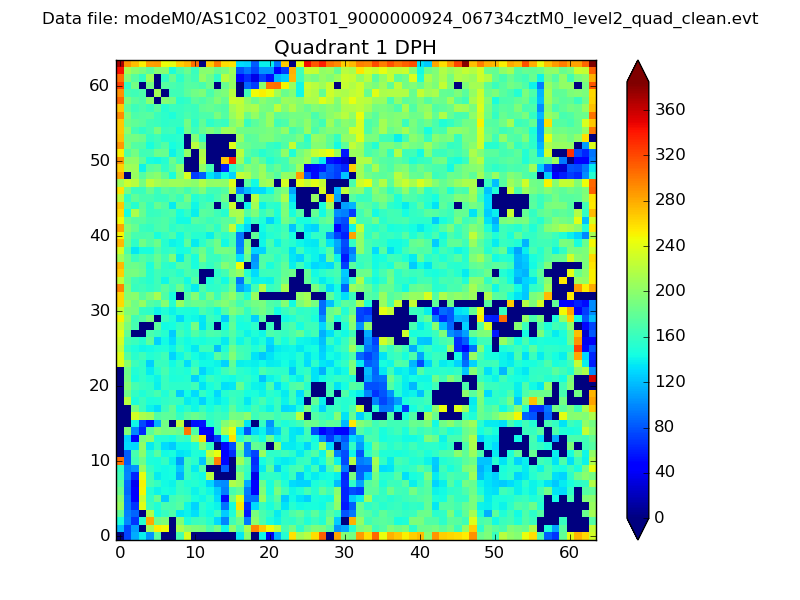
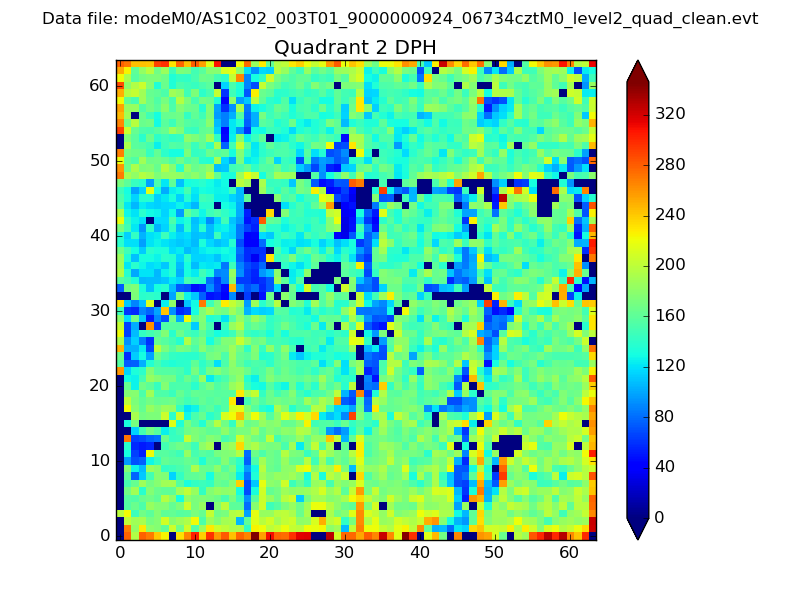
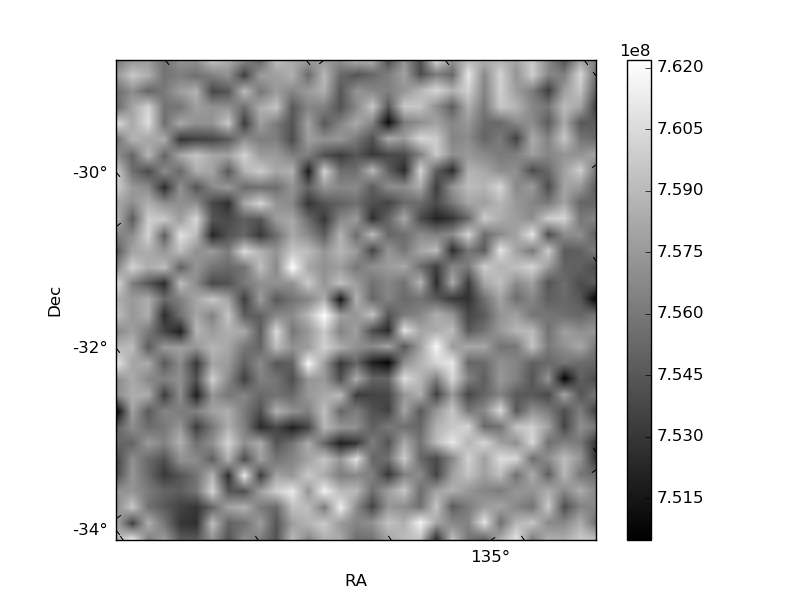
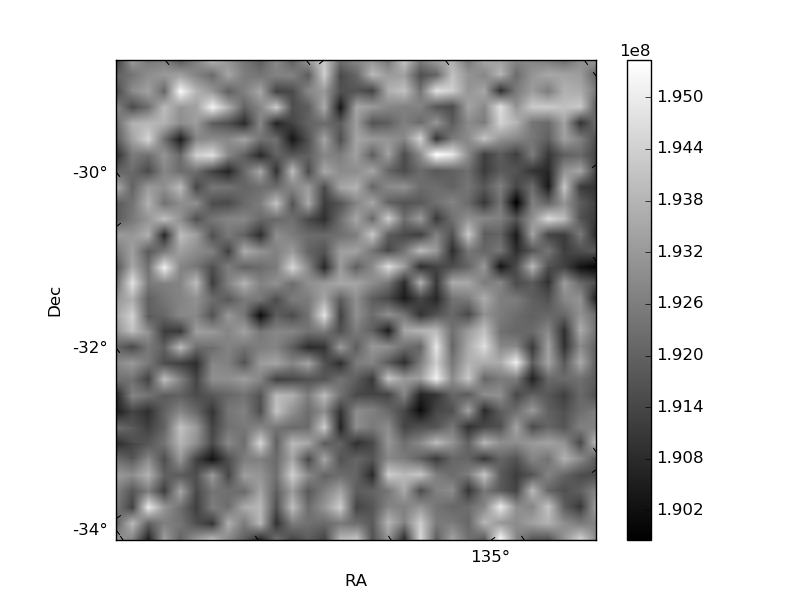
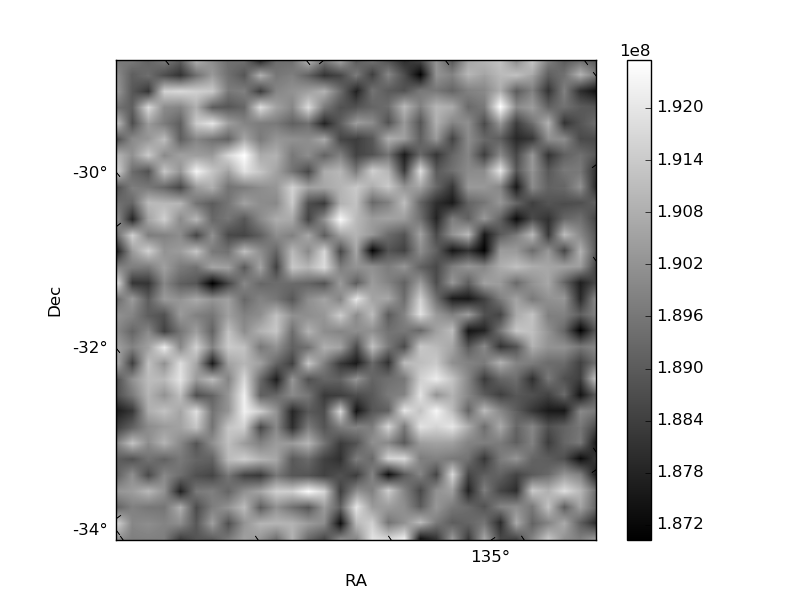
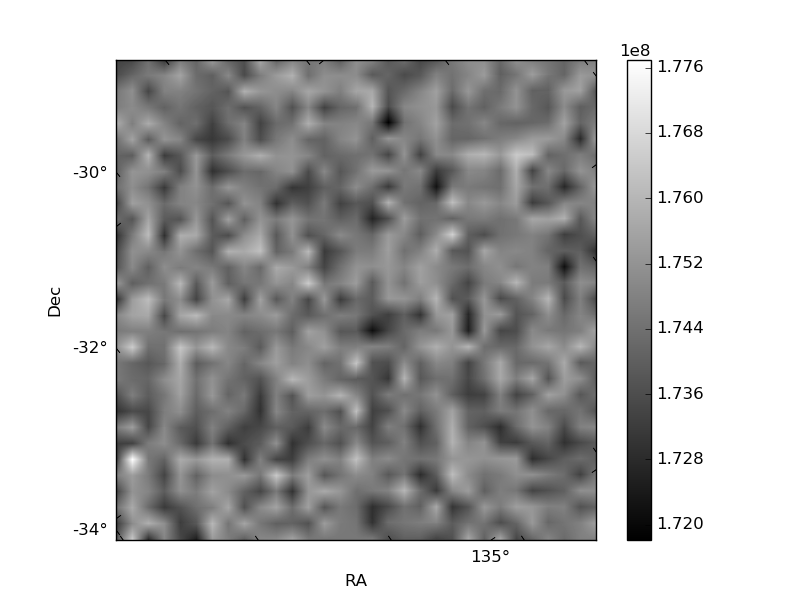
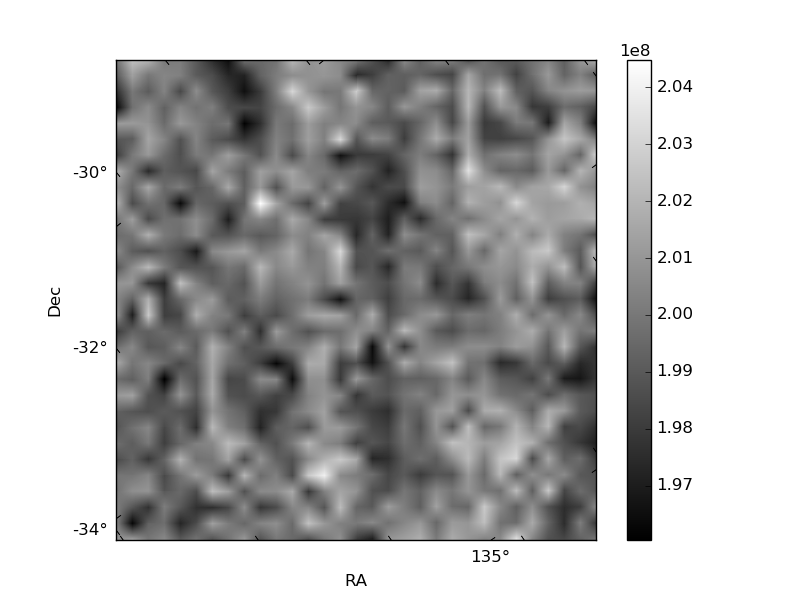
Histogram calculated using DETX and DETY for each event in the final _common_clean file
| Quadrant A | 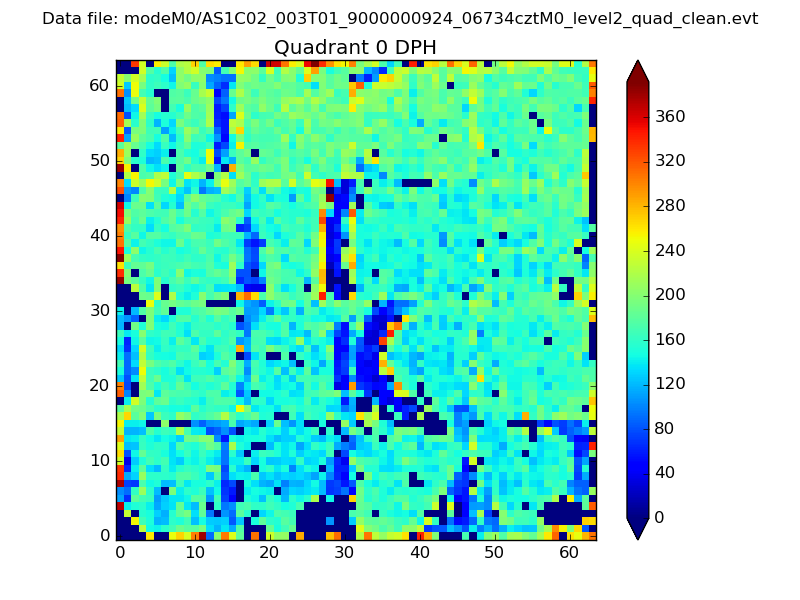 |
 |
Quadrant B |
|---|---|---|---|
| Quadrant D | 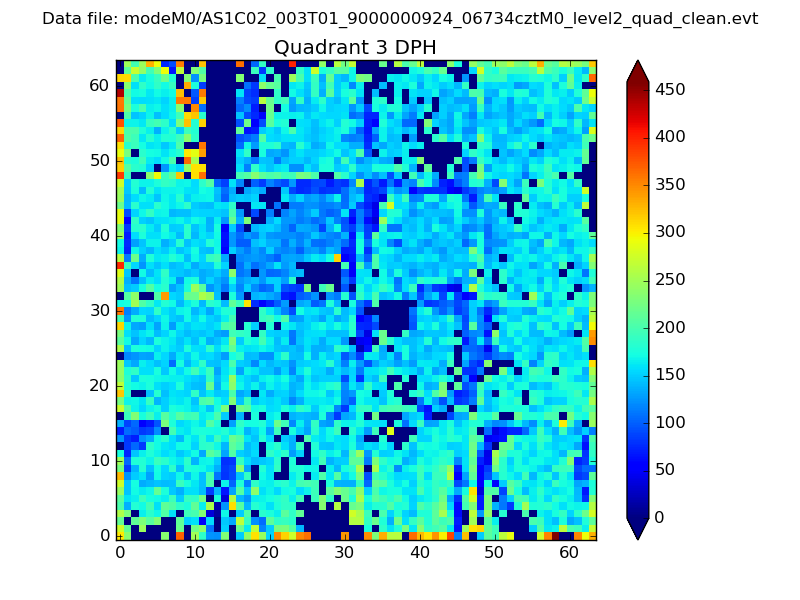 |
 |
Quadrant C |
| Plot type | Count rate plots | Images |
|---|---|---|
| Comparison with Poisson distribution Blue bars denote a histogram of data divided into 1 sec bins. Red curve is a Poisson curve with rate = median count rate of data. |
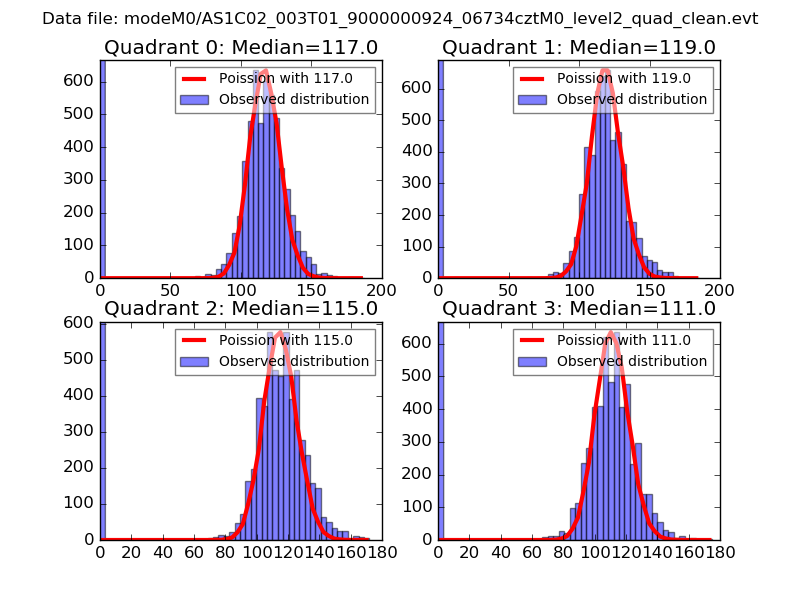 |
 |
| Quadrant-wise count rates Data is divided into 100 sec bins |
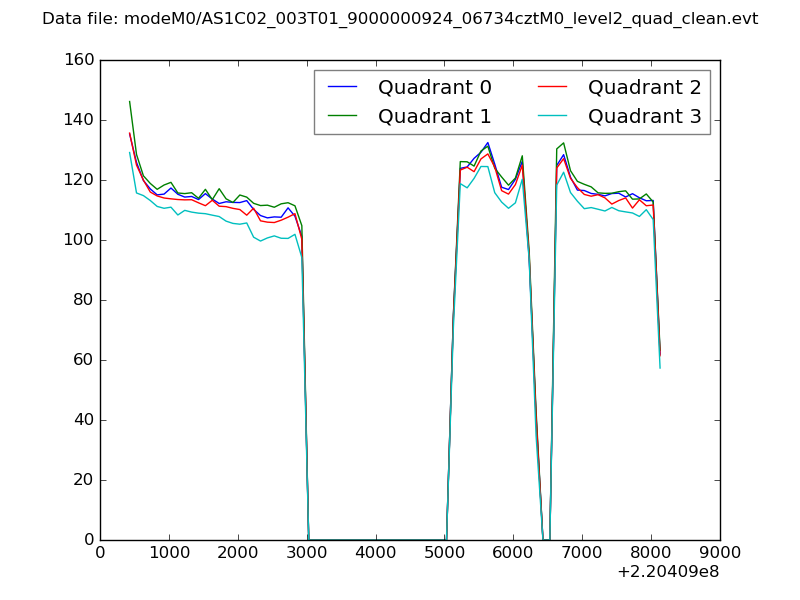 |
|
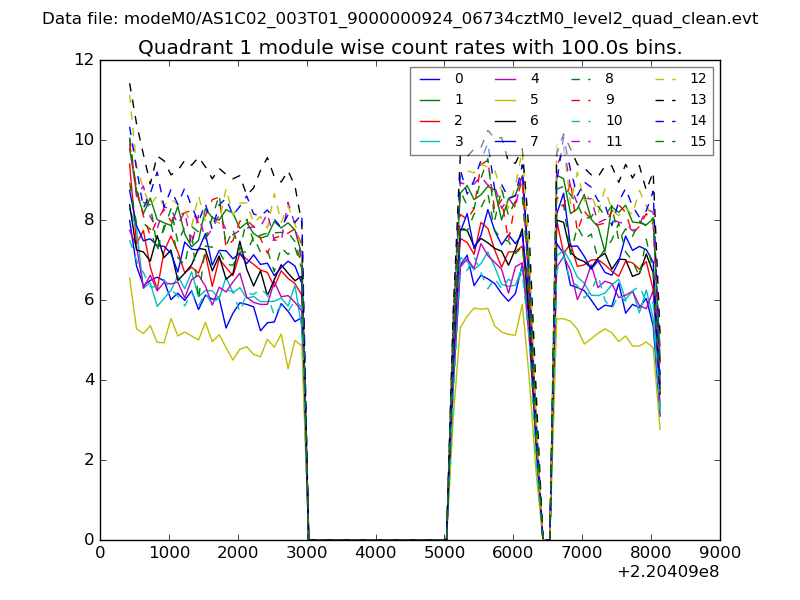
| Module-wise count rates for Quadrant A Data is divided into 100 sec bins |
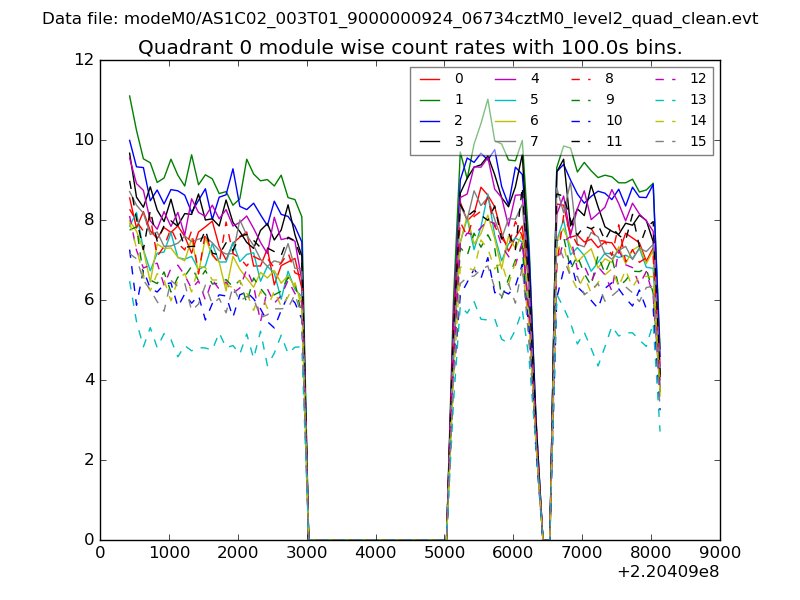 |
 |
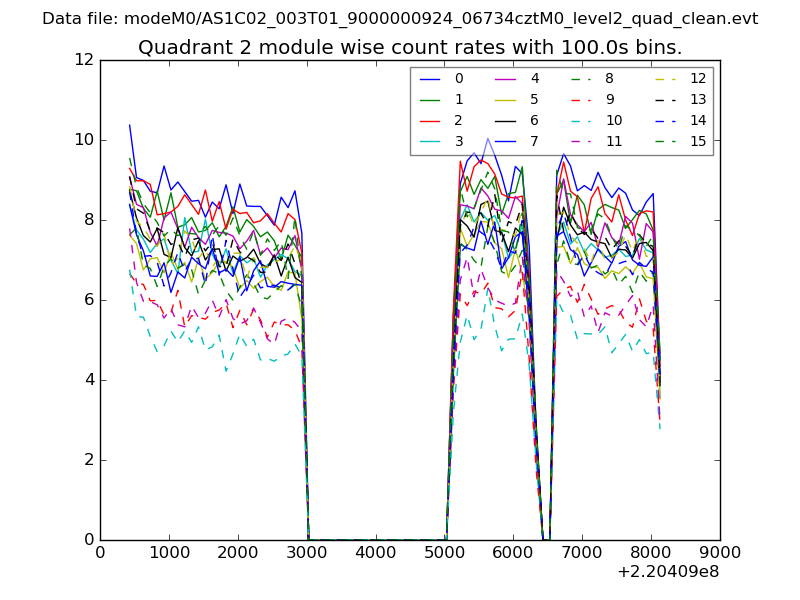
| Module-wise count rates for Quadrant B Data is divided into 100 sec bins |
 |
 |
| Module-wise count rates for Quadrant C Data is divided into 100 sec bins |
 |
 |
| Module-wise count rates for Quadrant D Data is divided into 100 sec bins |
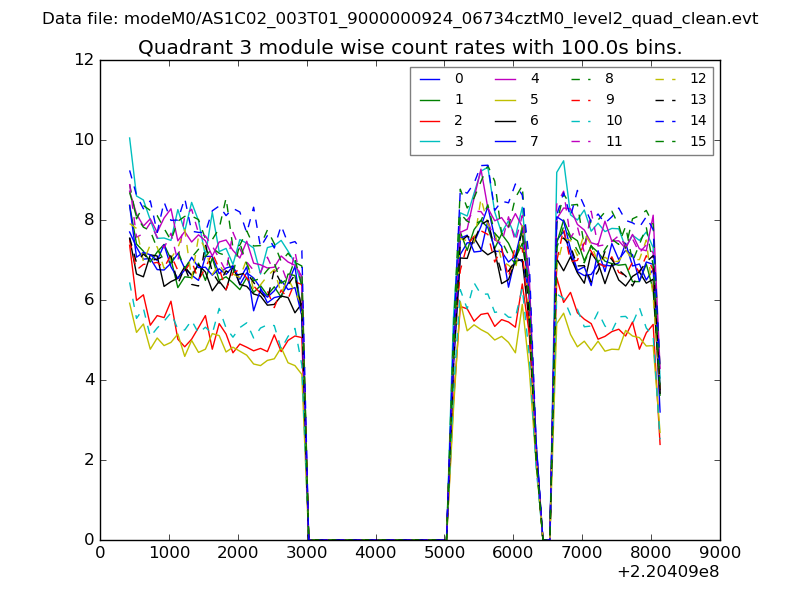 |
 |
| Parameter | Plot |
|---|---|
| CZT HV Monitor | 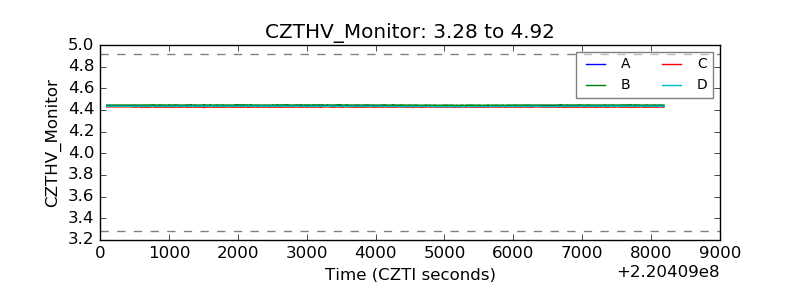 |
| D_VDD | 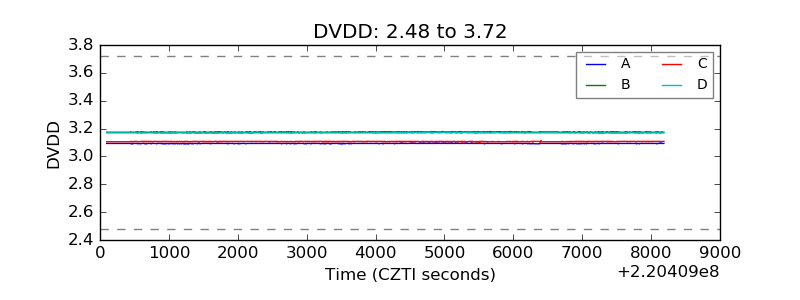 |
| Temperature 1 | 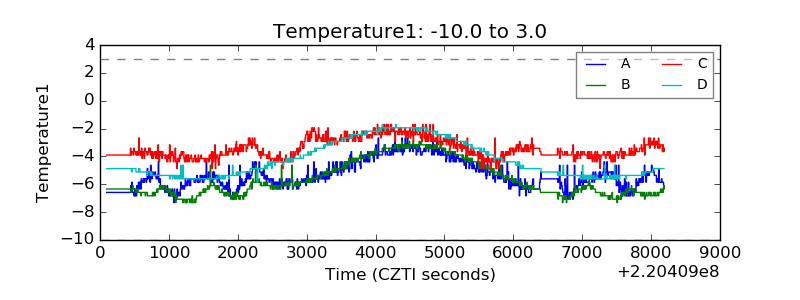 |
| Veto HV Monitor | 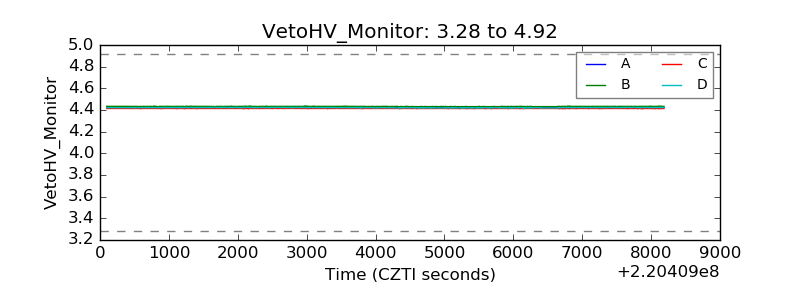 |
| Veto LLD | 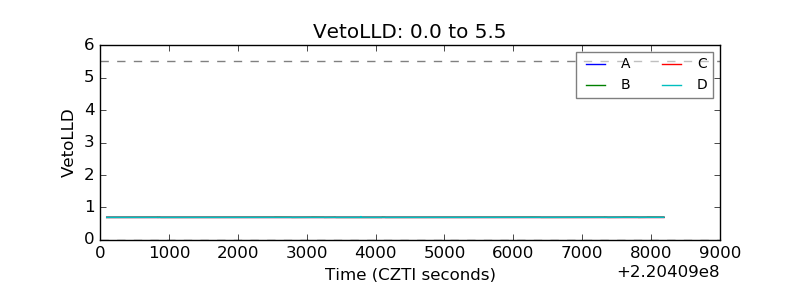 |
| Alpha Counter | 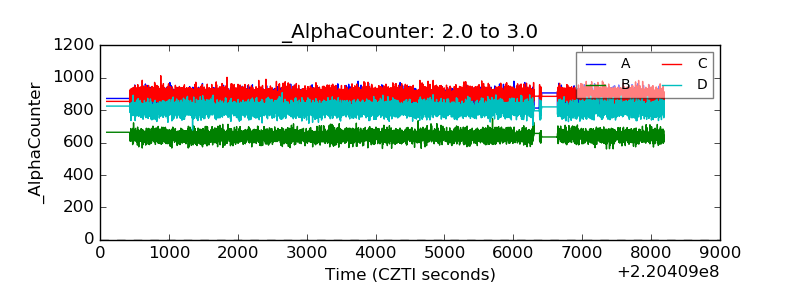 |
| _CPM_Rate | 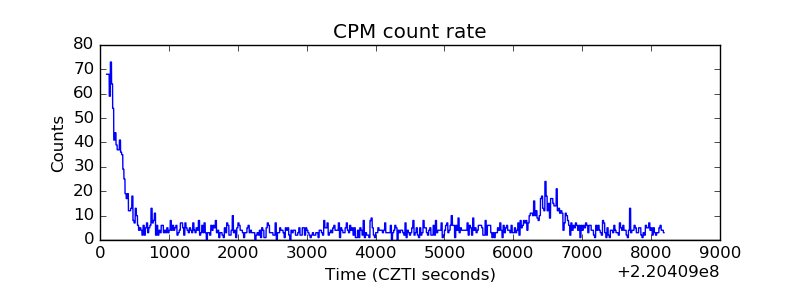 |
| CZT Counter | 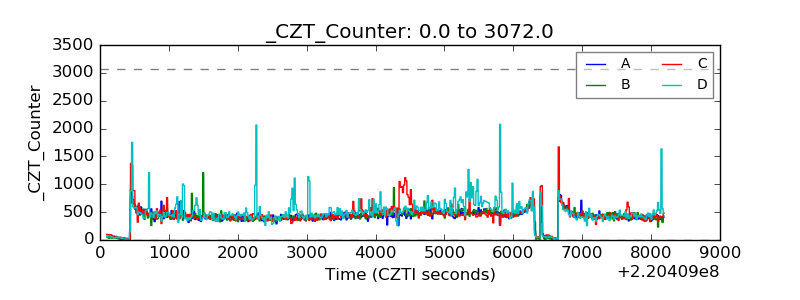 |
| +2.5 Volts monitor |  |
| +5 Volts monitor |  |
| _ROLL_ROT | 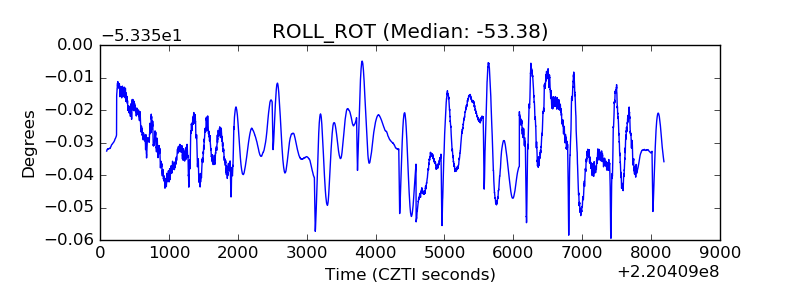 |
| _Roll_DEC | 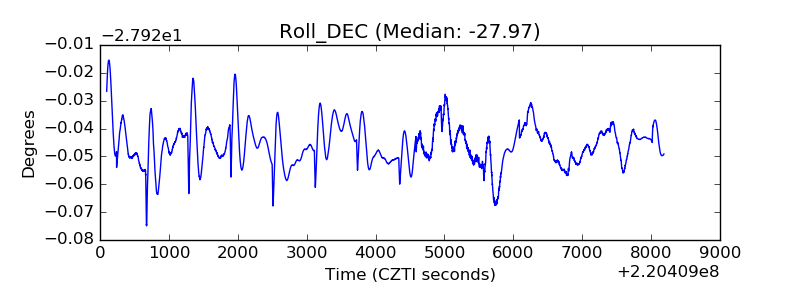 |
| _Roll_RA | 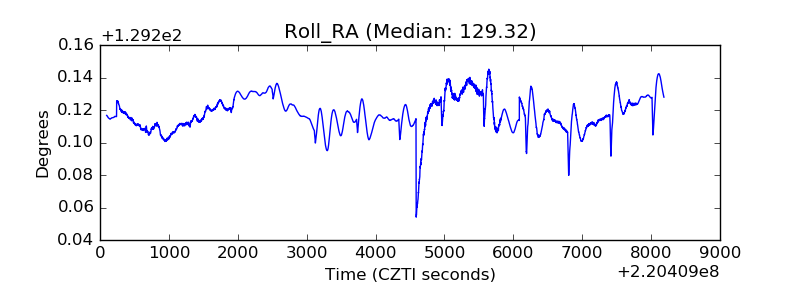 |
| Veto Counter | 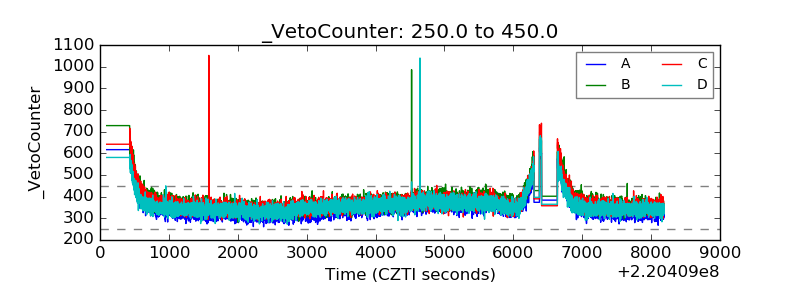 |