| Param | Original file | Final file |
|---|---|---|
| Filename | modeM0/AS1C02_003T01_9000000924_06735cztM0_level2.evt | modeM0/AS1C02_003T01_9000000924_06735cztM0_level2_quad_clean.evt |
| Size (bytes) | 1,064,810,880 | 179,550,720 |
| Size | 1015.5 MB | 171.2 MB |
| Events in quadrant A | 7,502,353 | 1,106,094 |
| Events in quadrant B | 7,222,459 | 1,120,397 |
| Events in quadrant C | 7,353,816 | 1,087,525 |
| Events in quadrant D | 9,107,644 | 1,041,302 |
| Mode M9 | |||
|---|---|---|---|
| Quadrant | BADHDUFLAG | Total packets | Discarded packets |
| A | 0 | 10 | 0 |
| B | 0 | 10 | 0 |
| C | 0 | 10 | 0 |
| D | 0 | 10 | 0 |
| Mode SS | |||
|---|---|---|---|
| Quadrant | BADHDUFLAG | Total packets | Discarded packets |
| A | 0 | 322 | 0 |
| B | 0 | 322 | 0 |
| C | 0 | 322 | 0 |
| D | 0 | 322 | 0 |
| Mode M0 | |||
|---|---|---|---|
| Quadrant | BADHDUFLAG | Total packets | Discarded packets |
| A | 0 | 33153 | 4 |
| B | 0 | 32314 | 4 |
| C | 0 | 32855 | 4 |
| D | 0 | 37686 | 4 |
| Quadrant | Total seconds | Saturated seconds | Saturation percentage |
|---|---|---|---|
| A | 15681 | 165 | 1.052229% |
| B | 15681 | 212 | 1.351955% |
| C | 15681 | 177 | 1.128755% |
| D | 15681 | 230 | 1.466743% |
Noise dominated data is calculated using 1-second bins in cleaned event files. If a bin has >2000 counts, and if more than 50% of those come from <1% of pixels, then it is considered to be noise-dominated and hence unusable.
| Quadrant | # 1 sec bins | Bins with >0 counts | Bins with >2000 counts | High rate bins dominated by noise | Noise dominated (total time) | Noise dominated (detector-on time) | Marked lightcurve |
|---|---|---|---|---|---|---|---|
| A | 16811 | 15685 | 11 | 11 | 0.07% | 0.07% | 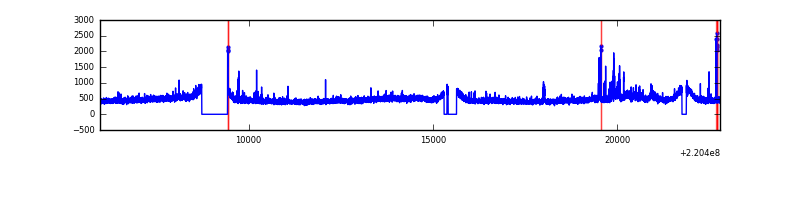 |
| B | 16811 | 15685 | 0 | 0 | 0.00% | 0.00% | 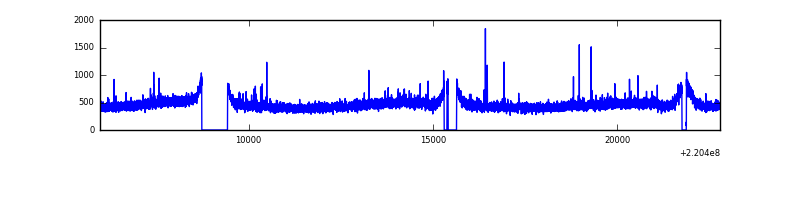 |
| C | 16811 | 15685 | 7 | 7 | 0.04% | 0.04% | 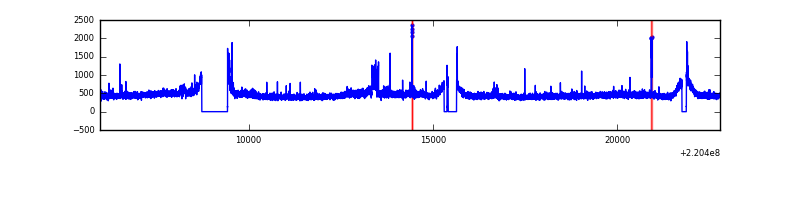 |
| D | 16811 | 15685 | 66 | 66 | 0.39% | 0.42% | 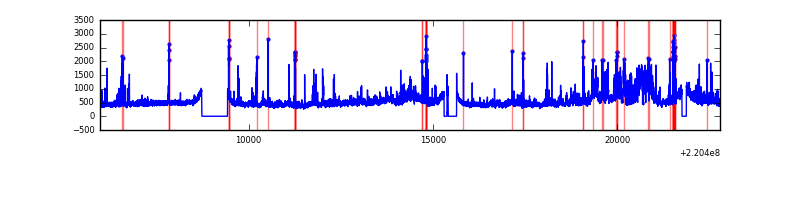 |
Top three noisy pixels from each quadrant. If the there are fewer than three noisy pixels in the level2.evt file, extra rows are filled as -1
| Pixel properties | Quadrant properties | ||||||
|---|---|---|---|---|---|---|---|
| Quadrant | DetID | PixID | Counts | Sigma | Mean | Median | Sigma |
| A | 14 | 111 | 298966 | 803.91 | 1823 | 1785 | 369.7 |
| A | 8 | 15 | 133039 | 355.06 | 1823 | 1785 | 369.7 |
| A | 3 | 1 | 30218 | 76.91 | 1823 | 1785 | 369.7 |
| B | 4 | 81 | 50531 | 138.86 | 1843 | 1796 | 351.0 |
| B | 12 | 111 | 37661 | 102.19 | 1843 | 1796 | 351.0 |
| B | 11 | 111 | 30207 | 80.95 | 1843 | 1796 | 351.0 |
| C | 12 | 16 | 220992 | 528.38 | 1786 | 1790 | 414.9 |
| C | 9 | 16 | 136436 | 324.56 | 1786 | 1790 | 414.9 |
| C | 12 | 4 | 20233 | 44.46 | 1786 | 1790 | 414.9 |
| D | 8 | 195 | 862511 | 1997.24 | 1774 | 1715 | 431.0 |
| D | 2 | 136 | 641571 | 1484.61 | 1774 | 1715 | 431.0 |
| D | 7 | 203 | 397921 | 919.29 | 1774 | 1715 | 431.0 |
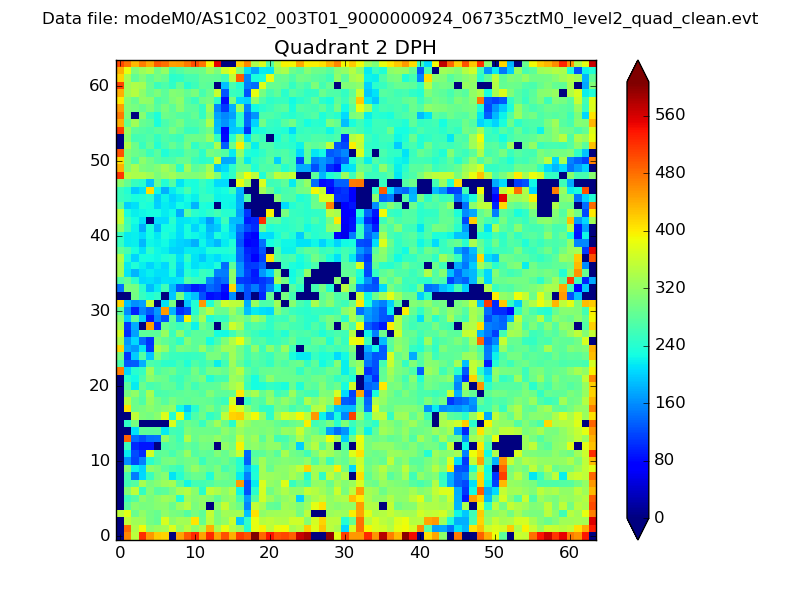
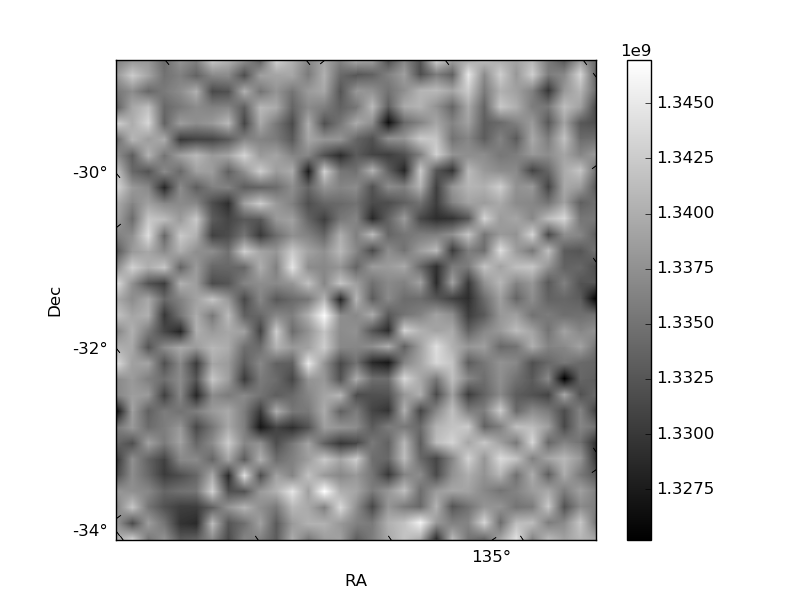
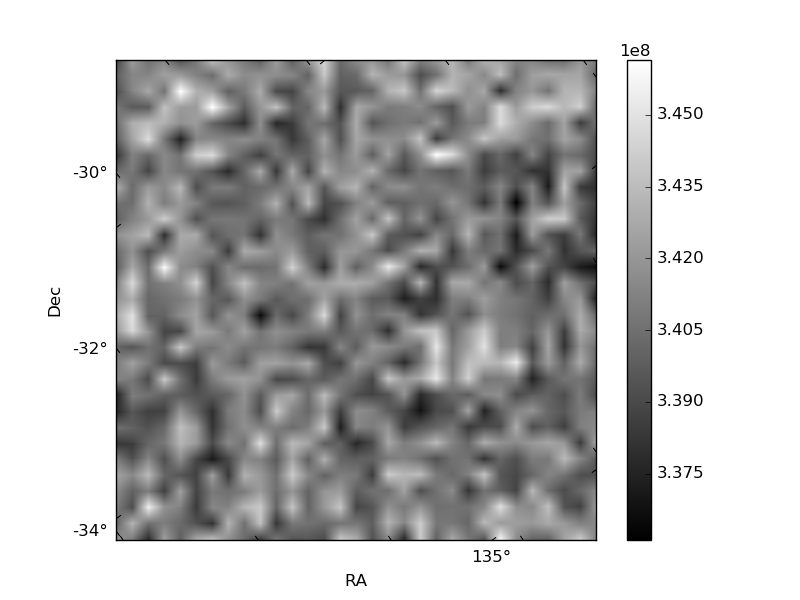
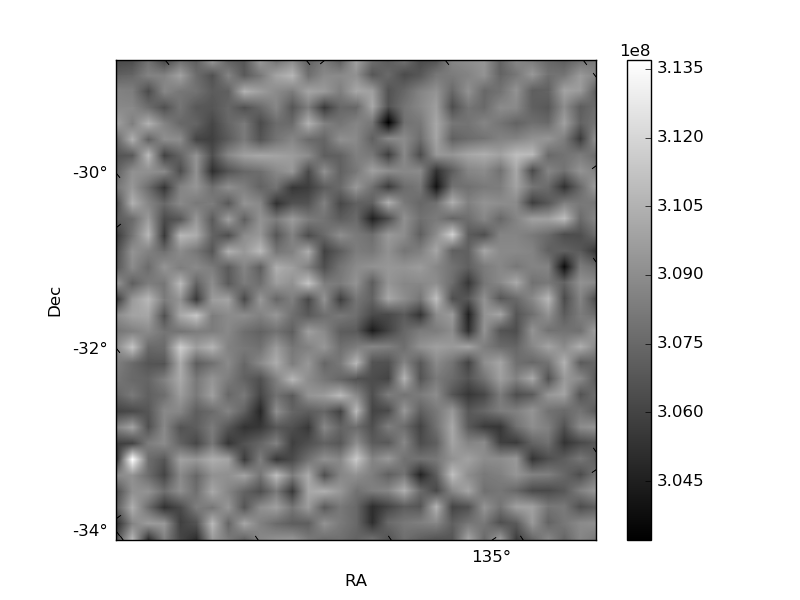
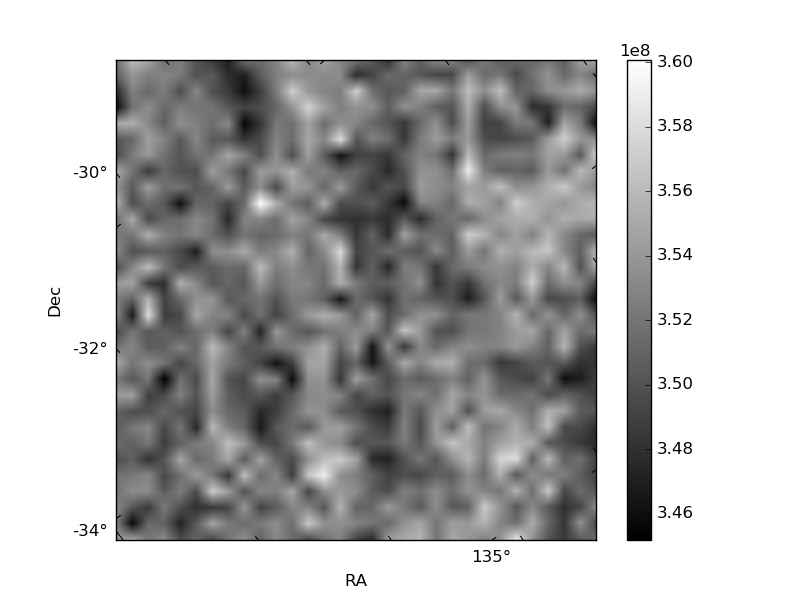
Histogram calculated using DETX and DETY for each event in the final _common_clean file
| Quadrant A | 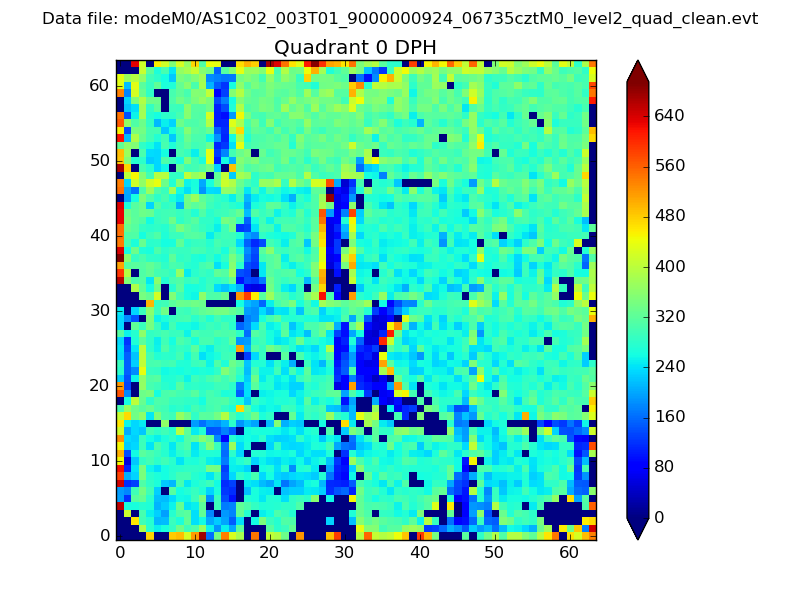 |
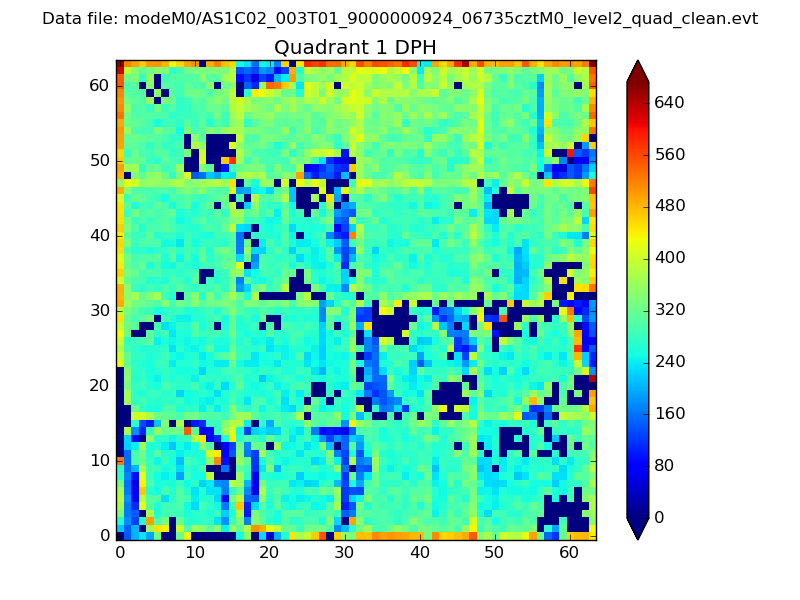 |
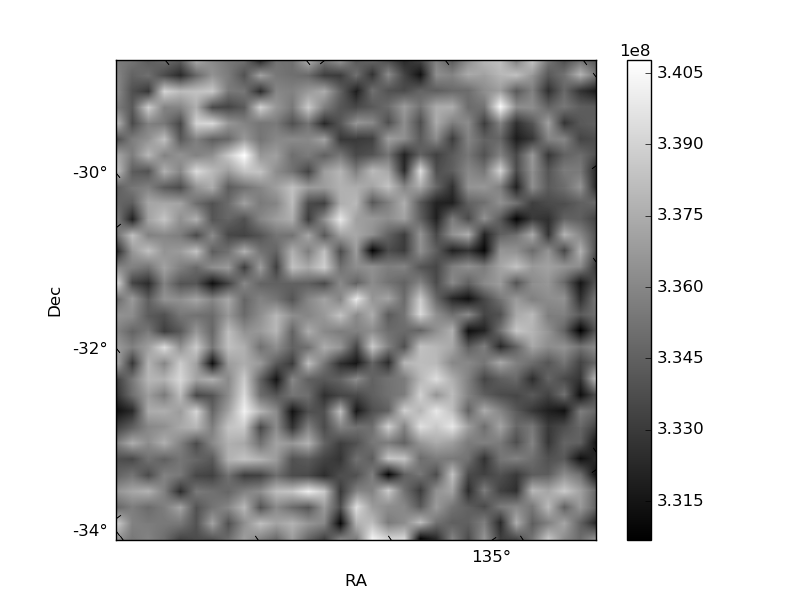
Quadrant B |
|---|---|---|---|
| Quadrant D | 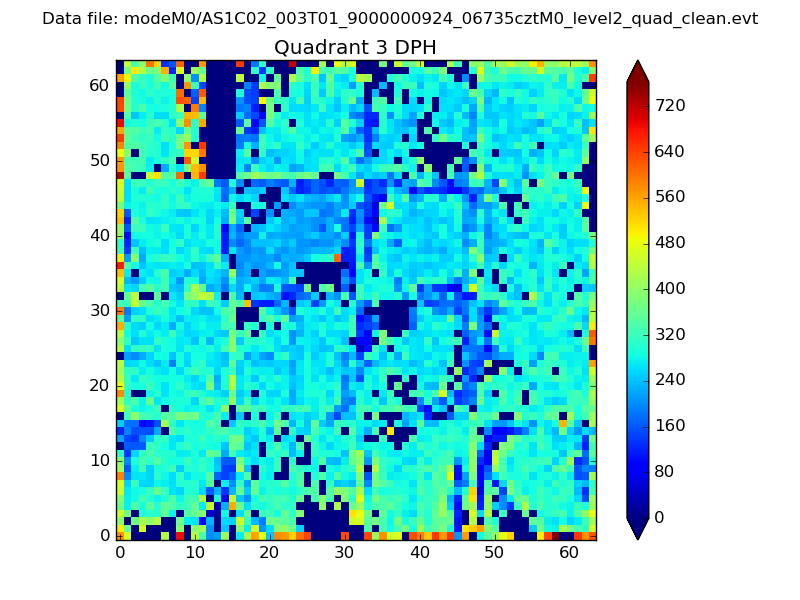 |
 |
Quadrant C |
| Plot type | Count rate plots | Images |
|---|---|---|
| Comparison with Poisson distribution Blue bars denote a histogram of data divided into 1 sec bins. Red curve is a Poisson curve with rate = median count rate of data. |
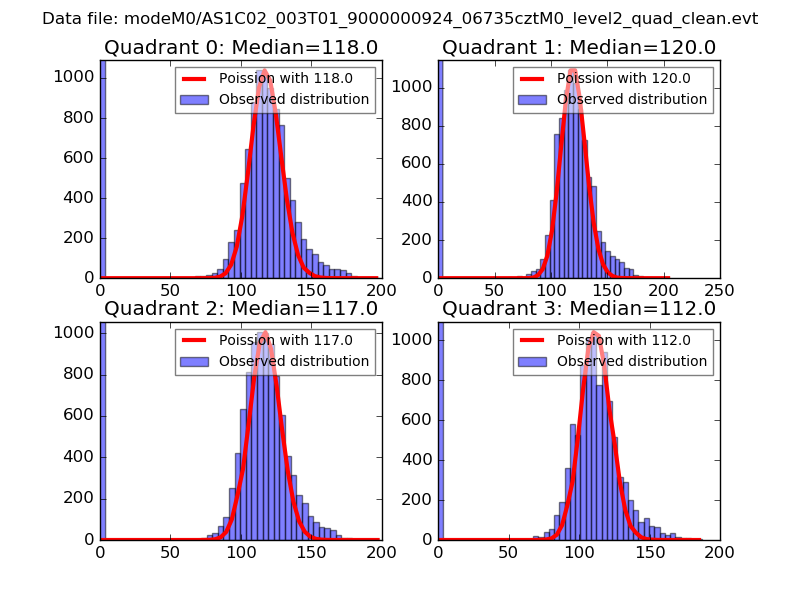 |
 |
| Quadrant-wise count rates Data is divided into 100 sec bins |
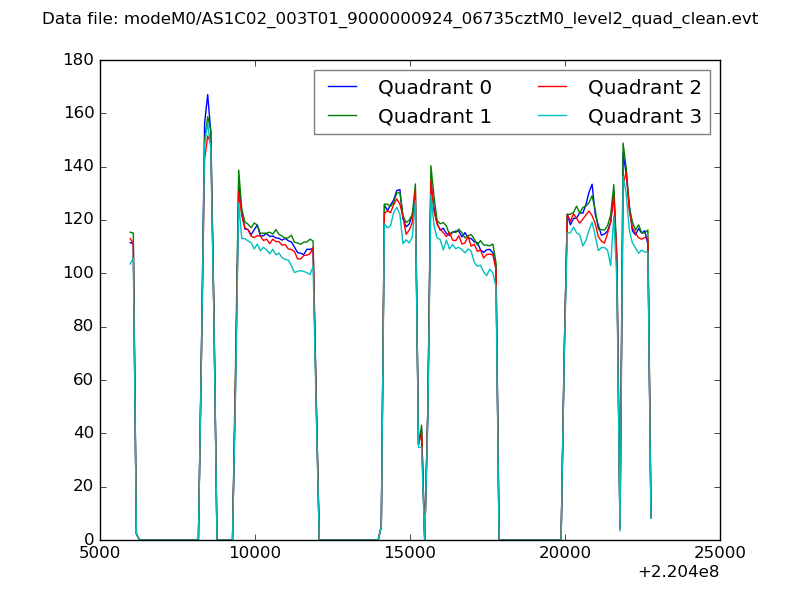 |
|
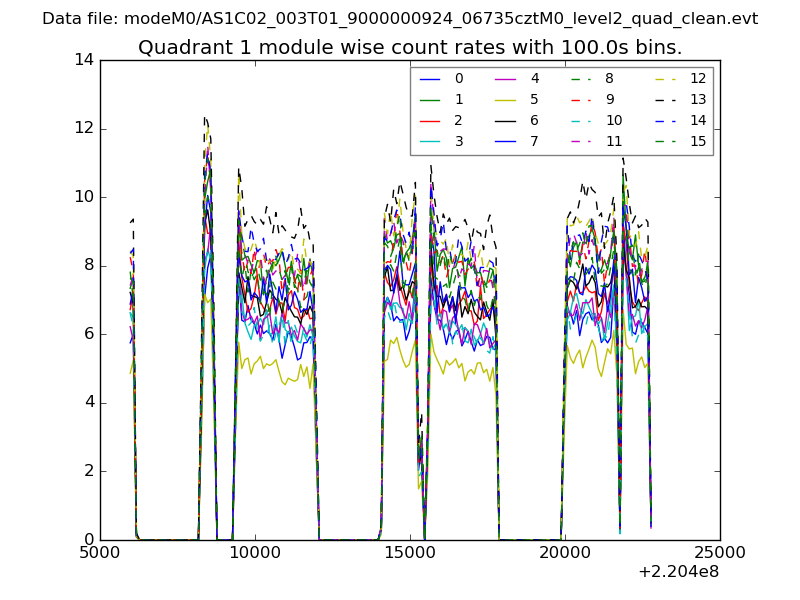
| Module-wise count rates for Quadrant A Data is divided into 100 sec bins |
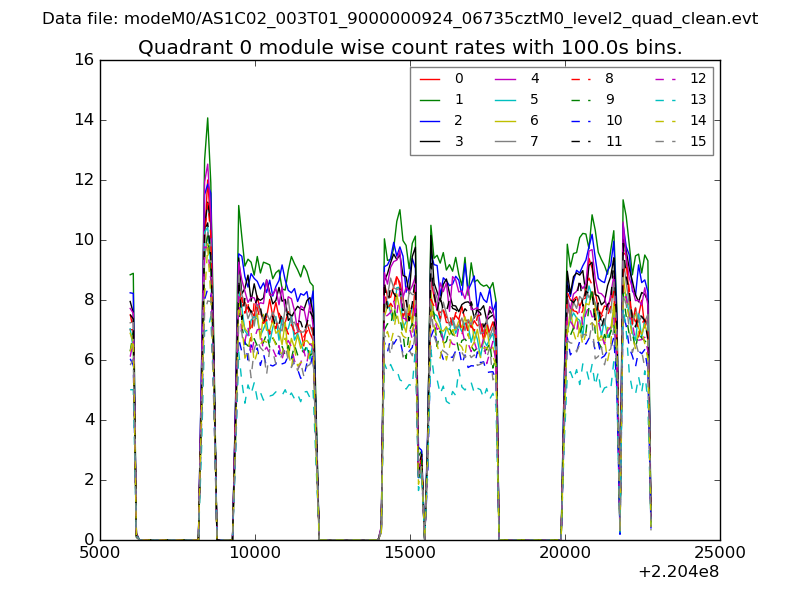 |
 |
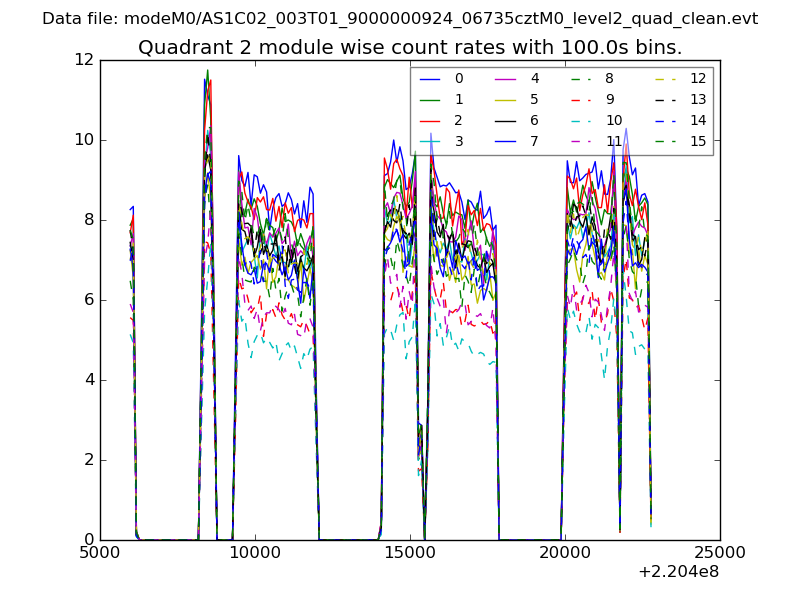
| Module-wise count rates for Quadrant B Data is divided into 100 sec bins |
 |
 |
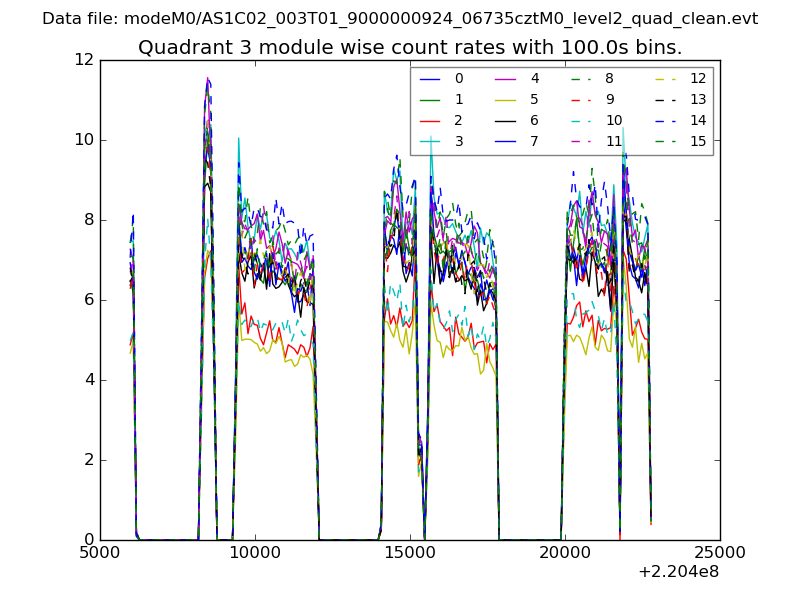
| Module-wise count rates for Quadrant C Data is divided into 100 sec bins |
 |
 |
| Module-wise count rates for Quadrant D Data is divided into 100 sec bins |
 |
 |
| Parameter | Plot |
|---|---|
| CZT HV Monitor | 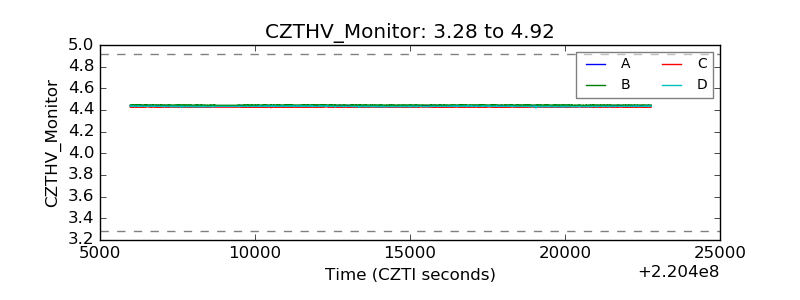 |
| D_VDD | 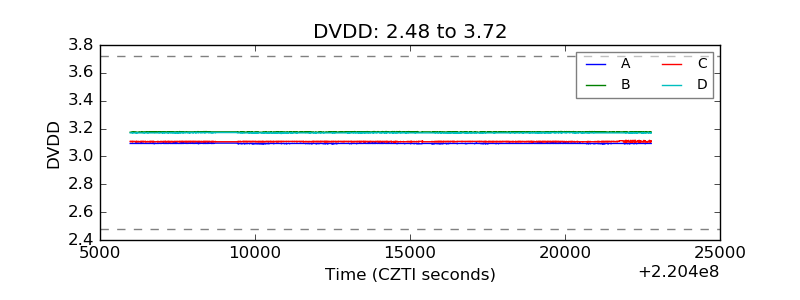 |
| Temperature 1 | 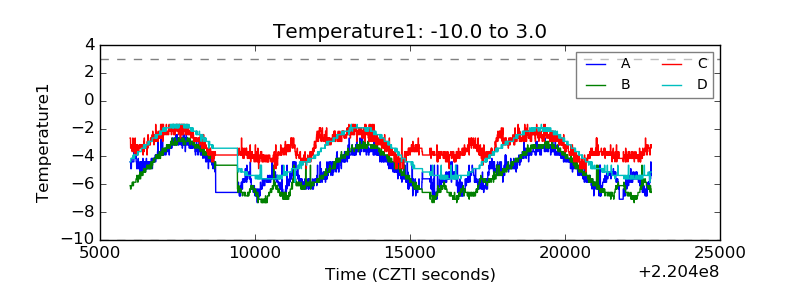 |
| Veto HV Monitor | 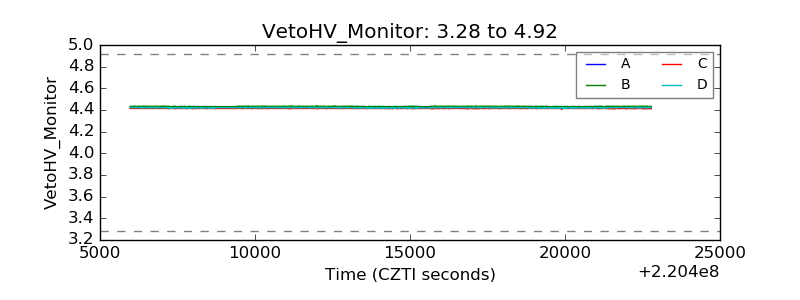 |
| Veto LLD | 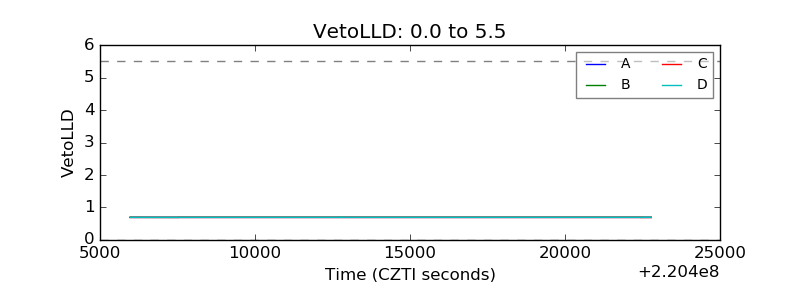 |
| Alpha Counter | 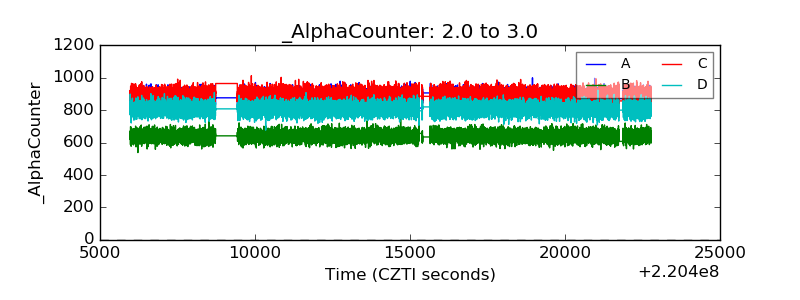 |
| _CPM_Rate | 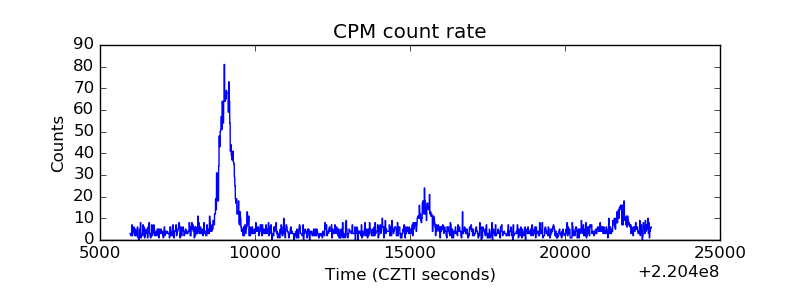 |
| CZT Counter | 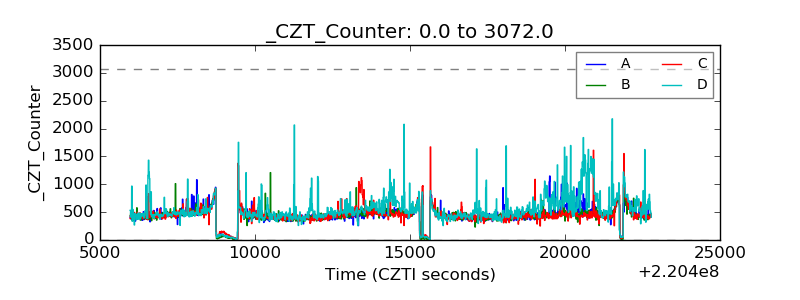 |
| +2.5 Volts monitor |  |
| +5 Volts monitor |  |
| _ROLL_ROT |  |
| _Roll_DEC |  |
| _Roll_RA | 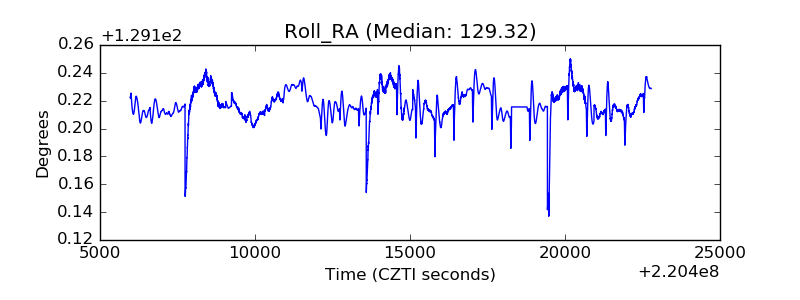 |
| Veto Counter | 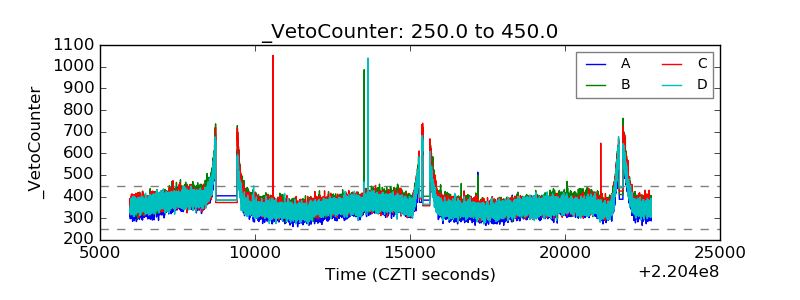 |