| Param | Original file | Final file |
|---|---|---|
| Filename | modeM0/AS1C02_003T01_9000000924_06736cztM0_level2.evt | modeM0/AS1C02_003T01_9000000924_06736cztM0_level2_quad_clean.evt |
| Size (bytes) | 75,121,920 | 18,063,360 |
| Size | 71.6 MB | 17.2 MB |
| Events in quadrant A | 531,898 | 118,832 |
| Events in quadrant B | 502,545 | 121,196 |
| Events in quadrant C | 522,282 | 117,986 |
| Events in quadrant D | 648,619 | 112,995 |
| Mode M9 | |||
|---|---|---|---|
| Quadrant | BADHDUFLAG | Total packets | Discarded packets |
| A | 0 | 1 | 0 |
| B | 0 | 1 | 0 |
| C | 0 | 1 | 0 |
| D | 0 | 1 | 0 |
| Mode SS | |||
|---|---|---|---|
| Quadrant | BADHDUFLAG | Total packets | Discarded packets |
| A | 0 | 22 | 0 |
| B | 0 | 22 | 0 |
| C | 0 | 22 | 0 |
| D | 0 | 22 | 0 |
| Mode M0 | |||
|---|---|---|---|
| Quadrant | BADHDUFLAG | Total packets | Discarded packets |
| A | 0 | 2251 | 1 |
| B | 0 | 2191 | 1 |
| C | 0 | 2242 | 1 |
| D | 0 | 2568 | 1 |
| Quadrant | Total seconds | Saturated seconds | Saturation percentage |
|---|---|---|---|
| A | 976 | 96 | 9.836066% |
| B | 976 | 108 | 11.065574% |
| C | 976 | 98 | 10.040984% |
| D | 976 | 98 | 10.040984% |
Noise dominated data is calculated using 1-second bins in cleaned event files. If a bin has >2000 counts, and if more than 50% of those come from <1% of pixels, then it is considered to be noise-dominated and hence unusable.
| Quadrant | # 1 sec bins | Bins with >0 counts | Bins with >2000 counts | High rate bins dominated by noise | Noise dominated (total time) | Noise dominated (detector-on time) | Marked lightcurve |
|---|---|---|---|---|---|---|---|
| A | 1096 | 977 | 6 | 6 | 0.55% | 0.61% | 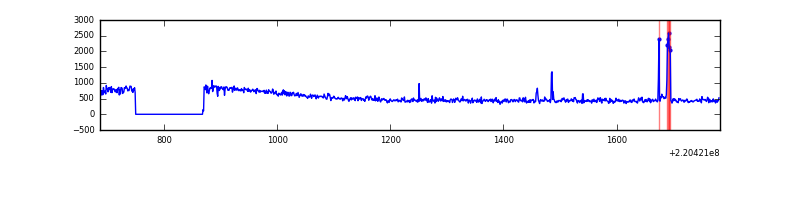 |
| B | 1096 | 977 | 0 | 0 | 0.00% | 0.00% | 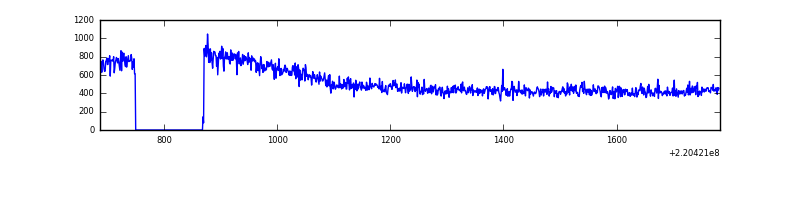 |
| C | 1096 | 977 | 0 | 0 | 0.00% | 0.00% | 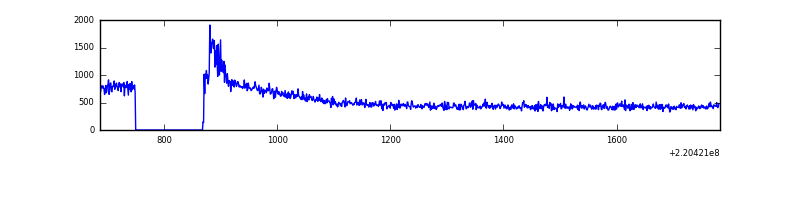 |
| D | 1096 | 977 | 1 | 1 | 0.09% | 0.10% | 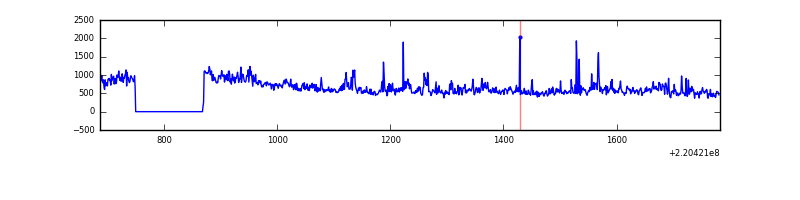 |
Top three noisy pixels from each quadrant. If the there are fewer than three noisy pixels in the level2.evt file, extra rows are filled as -1
| Pixel properties | Quadrant properties | ||||||
|---|---|---|---|---|---|---|---|
| Quadrant | DetID | PixID | Counts | Sigma | Mean | Median | Sigma |
| A | 14 | 111 | 23199 | 802.52 | 127 | 123 | 28.8 |
| A | 8 | 15 | 11121 | 382.48 | 127 | 123 | 28.8 |
| A | 13 | 251 | 7966 | 272.76 | 127 | 123 | 28.8 |
| B | 12 | 111 | 2832 | 99.11 | 128 | 124 | 27.3 |
| B | 11 | 111 | 2187 | 75.5 | 128 | 124 | 27.3 |
| B | 4 | 81 | 1582 | 53.36 | 128 | 124 | 27.3 |
| C | 9 | 16 | 26089 | 827.17 | 125 | 125 | 31.4 |
| C | 8 | 128 | 3214 | 98.41 | 125 | 125 | 31.4 |
| C | 8 | 112 | 1251 | 35.87 | 125 | 125 | 31.4 |
| D | 8 | 195 | 86785 | 2698.55 | 124 | 119 | 32.1 |
| D | 2 | 152 | 60578 | 1882.53 | 124 | 119 | 32.1 |
| D | 14 | 34 | 6586 | 201.37 | 124 | 119 | 32.1 |
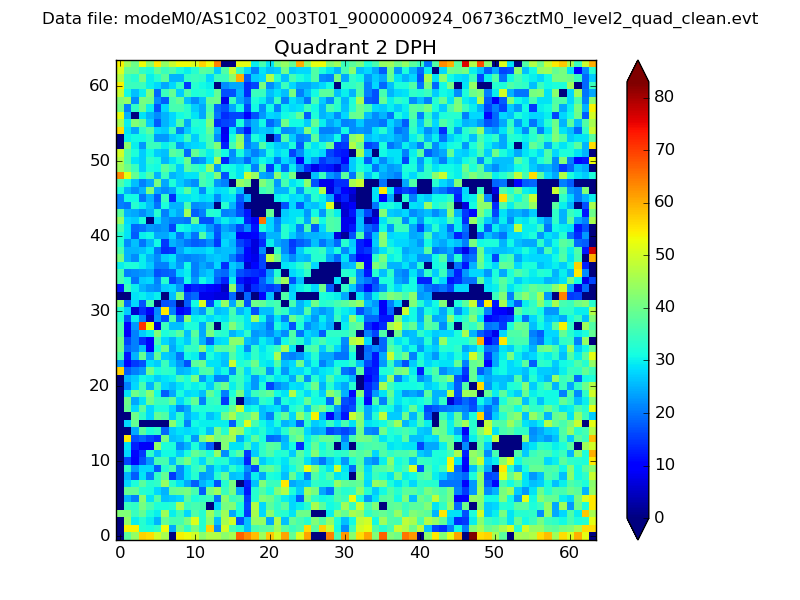
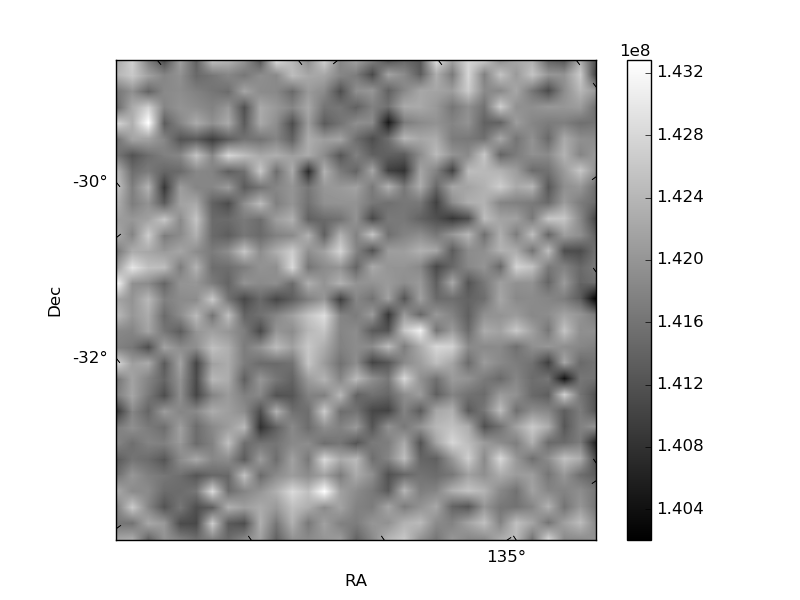
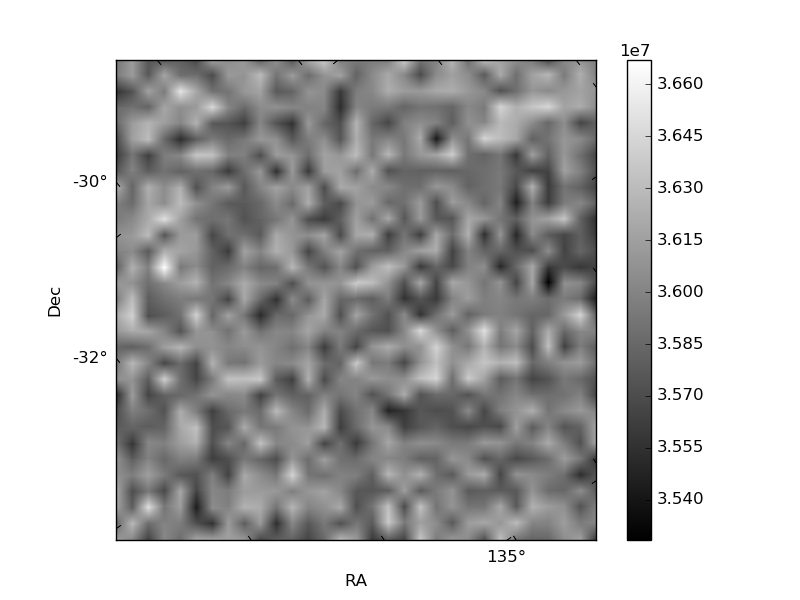
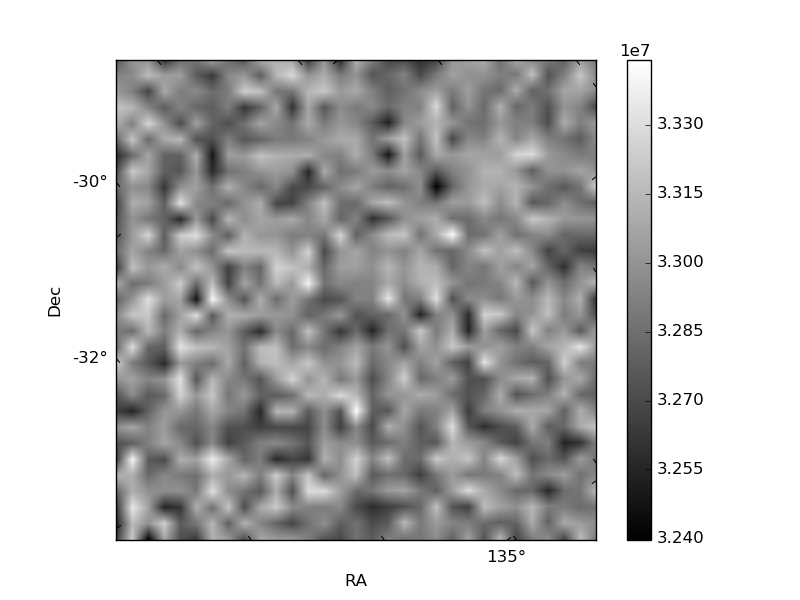
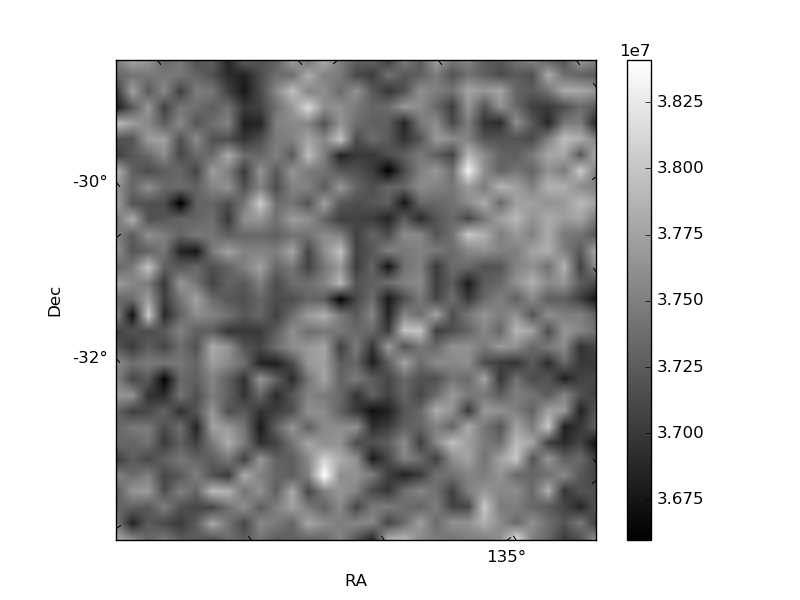
Histogram calculated using DETX and DETY for each event in the final _common_clean file
| Quadrant A | 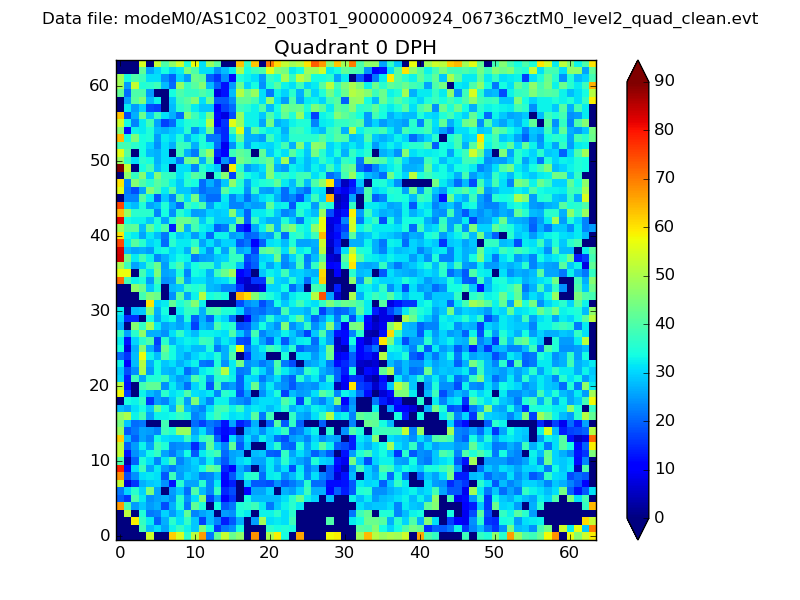 |
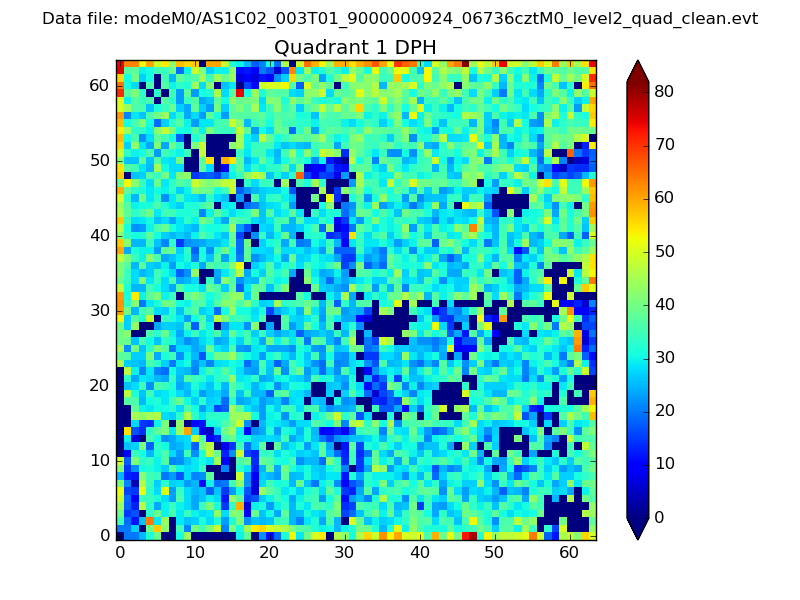 |
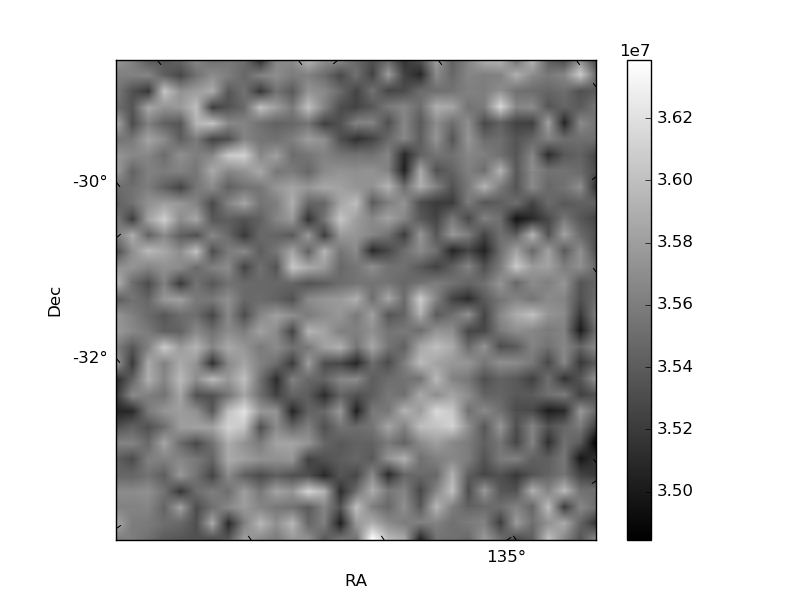
Quadrant B |
|---|---|---|---|
| Quadrant D | 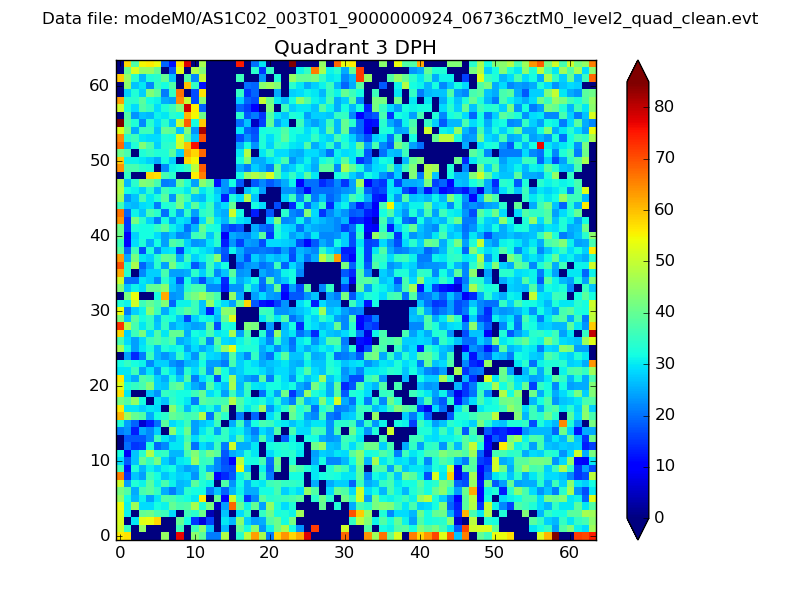 |
 |
Quadrant C |
| Plot type | Count rate plots | Images |
|---|---|---|
| Comparison with Poisson distribution Blue bars denote a histogram of data divided into 1 sec bins. Red curve is a Poisson curve with rate = median count rate of data. |
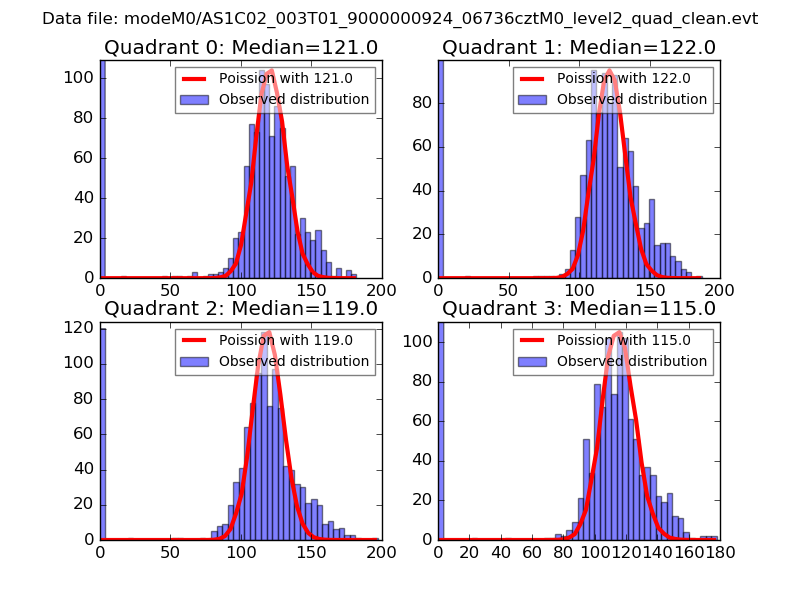 |
 |
| Quadrant-wise count rates Data is divided into 100 sec bins |
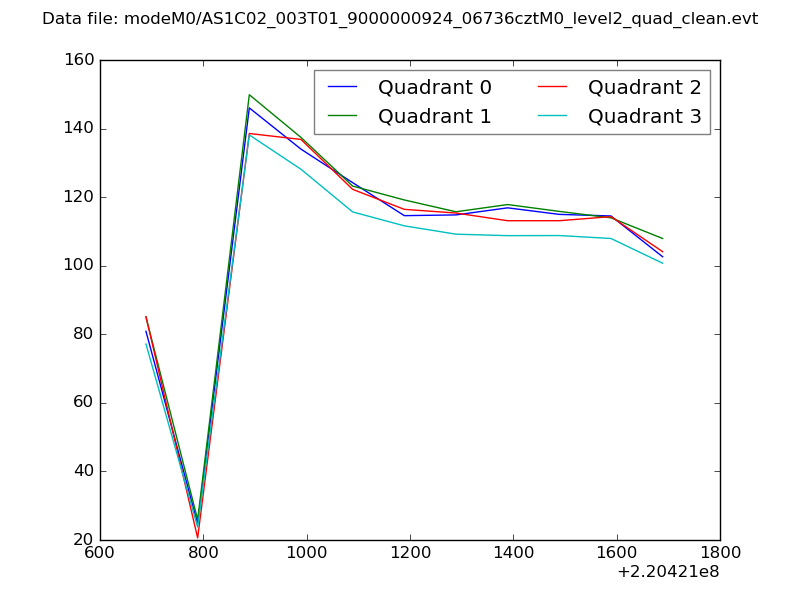 |
|
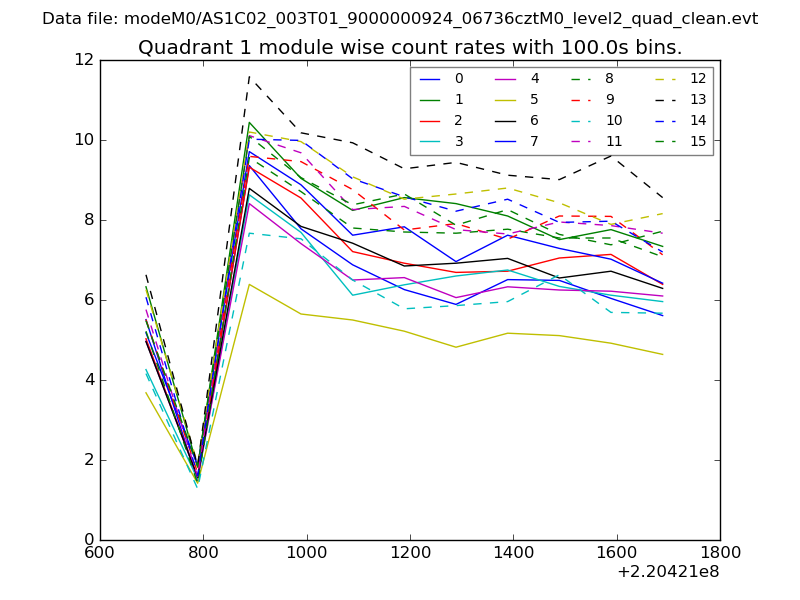
| Module-wise count rates for Quadrant A Data is divided into 100 sec bins |
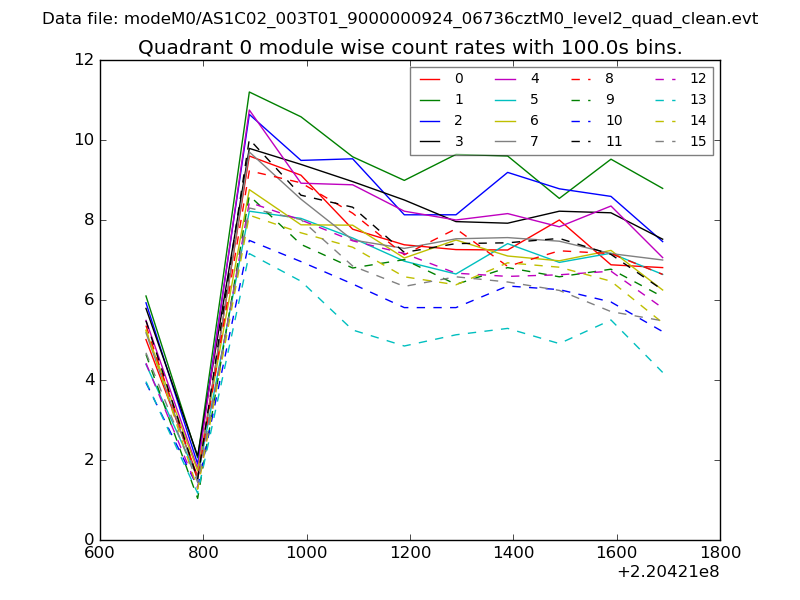 |
 |
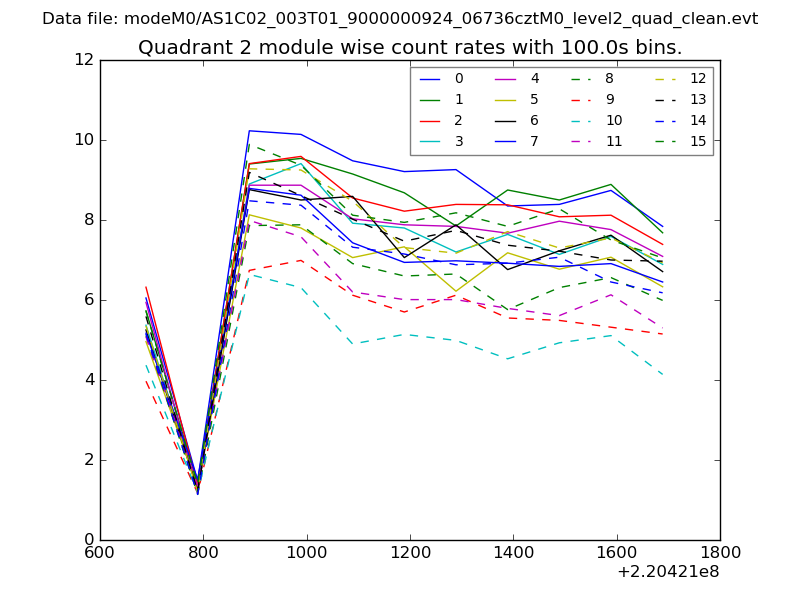
| Module-wise count rates for Quadrant B Data is divided into 100 sec bins |
 |
 |
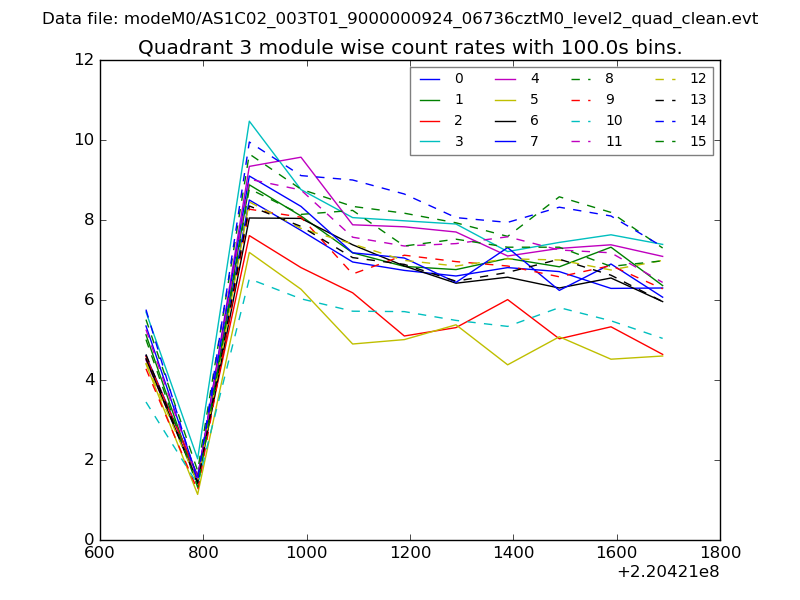
| Module-wise count rates for Quadrant C Data is divided into 100 sec bins |
 |
 |
| Module-wise count rates for Quadrant D Data is divided into 100 sec bins |
 |
 |
| Parameter | Plot |
|---|---|
| CZT HV Monitor | 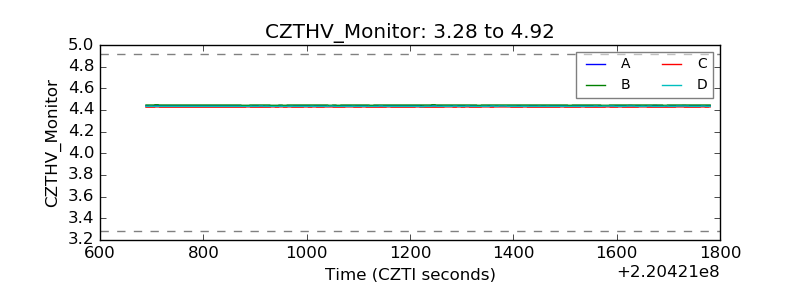 |
| D_VDD | 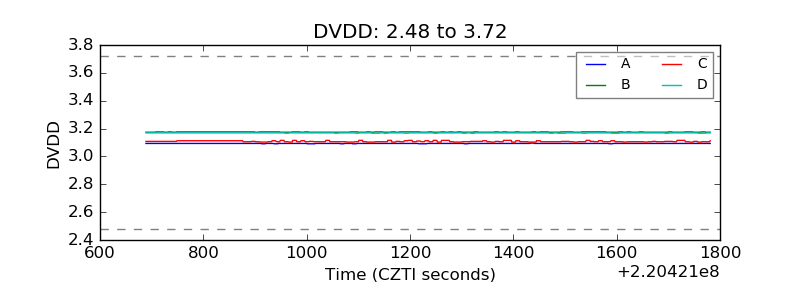 |
| Temperature 1 | 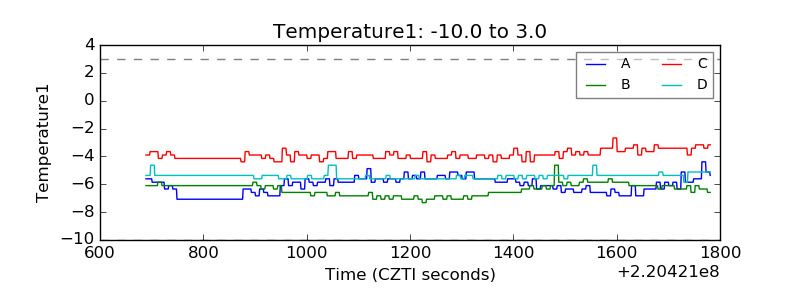 |
| Veto HV Monitor | 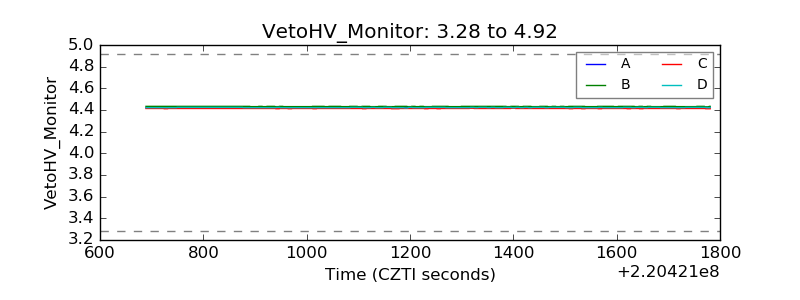 |
| Veto LLD | 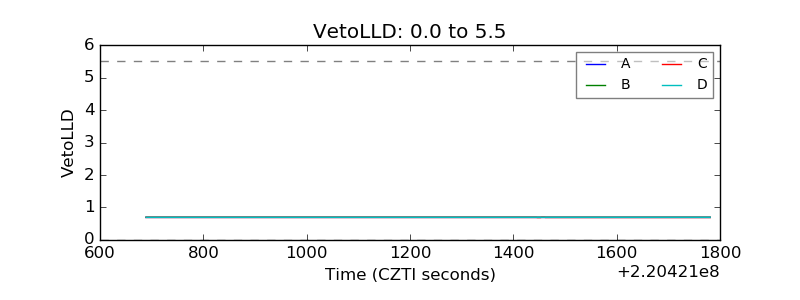 |
| Alpha Counter | 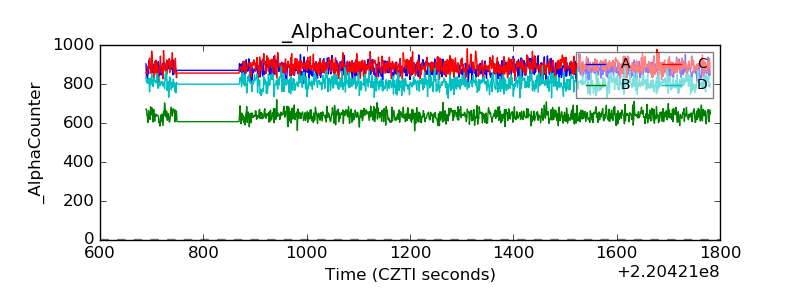 |
| _CPM_Rate | 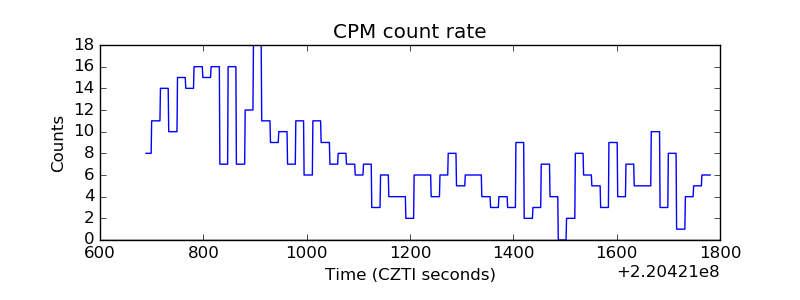 |
| CZT Counter | 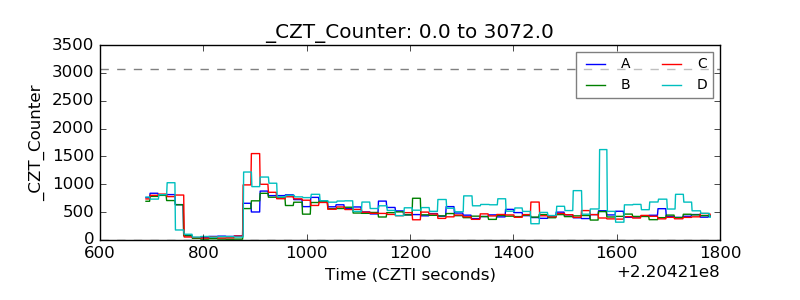 |
| +2.5 Volts monitor |  |
| +5 Volts monitor |  |
| _ROLL_ROT | 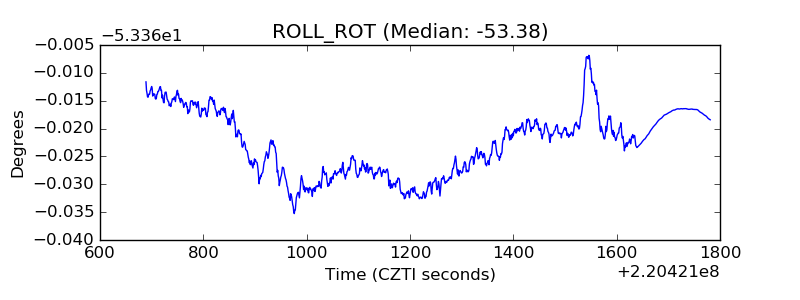 |
| _Roll_DEC | 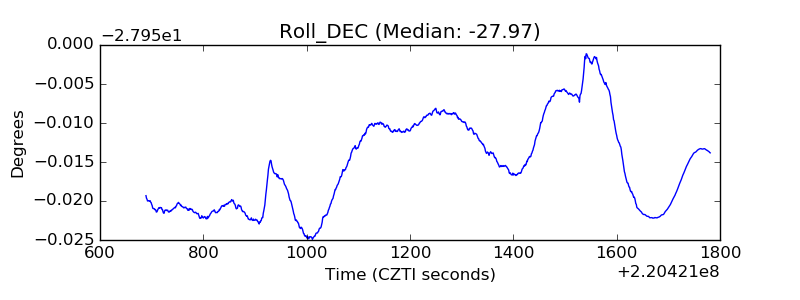 |
| _Roll_RA | 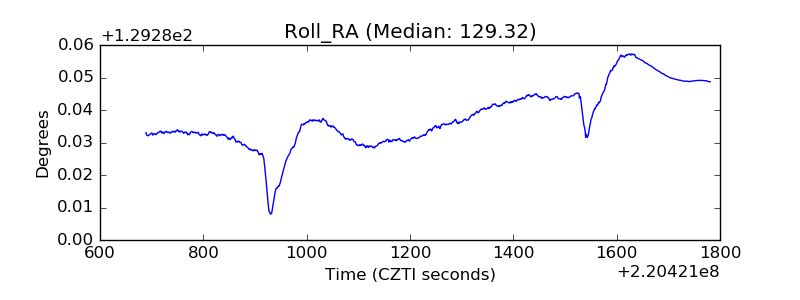 |
| Veto Counter | 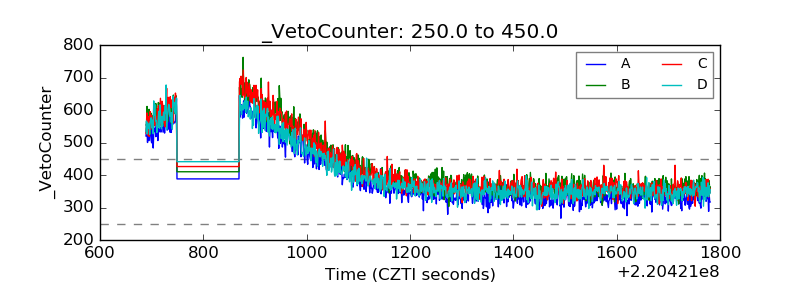 |