| Param | Original file | Final file |
|---|---|---|
| Filename | modeM0/AS1G06_164T01_9000000922_06710cztM0_level2.evt | modeM0/AS1G06_164T01_9000000922_06710cztM0_level2_quad_clean.evt |
| Size (bytes) | 600,382,080 | 103,187,520 |
| Size | 572.6 MB | 98.4 MB |
| Events in quadrant A | 4,953,609 | 636,049 |
| Events in quadrant B | 4,016,876 | 636,134 |
| Events in quadrant C | 3,790,733 | 630,300 |
| Events in quadrant D | 4,832,330 | 619,955 |
| Mode M9 | |||
|---|---|---|---|
| Quadrant | BADHDUFLAG | Total packets | Discarded packets |
| A | 0 | 15 | 0 |
| B | 0 | 15 | 0 |
| C | 0 | 15 | 0 |
| D | 0 | 15 | 0 |
| Mode SS | |||
|---|---|---|---|
| Quadrant | BADHDUFLAG | Total packets | Discarded packets |
| A | 0 | 178 | 0 |
| B | 0 | 178 | 0 |
| C | 0 | 178 | 0 |
| D | 0 | 178 | 0 |
| Mode M0 | |||
|---|---|---|---|
| Quadrant | BADHDUFLAG | Total packets | Discarded packets |
| A | 0 | 20625 | 3 |
| B | 0 | 17819 | 2 |
| C | 0 | 17591 | 2 |
| D | 0 | 20734 | 2 |
| Quadrant | Total seconds | Saturated seconds | Saturation percentage |
|---|---|---|---|
| A | 8672 | 513 | 5.915590% |
| B | 8672 | 141 | 1.625923% |
| C | 8672 | 98 | 1.130074% |
| D | 8672 | 457 | 5.269834% |
Noise dominated data is calculated using 1-second bins in cleaned event files. If a bin has >2000 counts, and if more than 50% of those come from <1% of pixels, then it is considered to be noise-dominated and hence unusable.
| Quadrant | # 1 sec bins | Bins with >0 counts | Bins with >2000 counts | High rate bins dominated by noise | Noise dominated (total time) | Noise dominated (detector-on time) | Marked lightcurve |
|---|---|---|---|---|---|---|---|
| A | 10197 | 8674 | 161 | 161 | 1.58% | 1.86% | 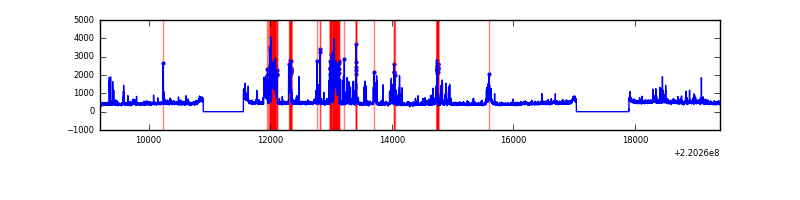 |
| B | 10197 | 8674 | 6 | 6 | 0.06% | 0.07% | 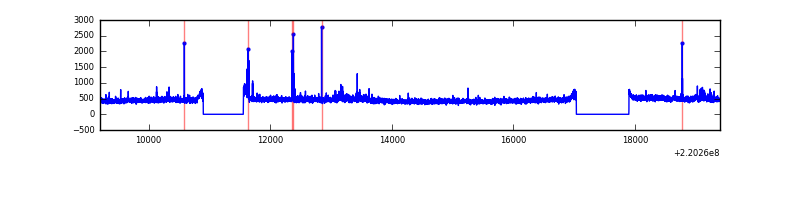 |
| C | 10197 | 8674 | 0 | 0 | 0.00% | 0.00% |  |
| D | 10197 | 8674 | 257 | 257 | 2.52% | 2.96% | 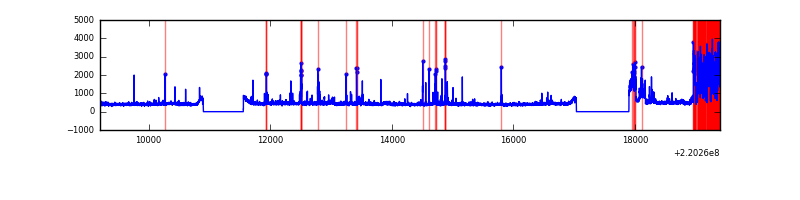 |
Top three noisy pixels from each quadrant. If the there are fewer than three noisy pixels in the level2.evt file, extra rows are filled as -1
| Pixel properties | Quadrant properties | ||||||
|---|---|---|---|---|---|---|---|
| Quadrant | DetID | PixID | Counts | Sigma | Mean | Median | Sigma |
| A | 14 | 111 | 891195 | 4454.87 | 983 | 959 | 199.8 |
| A | 4 | 2 | 254995 | 1271.23 | 983 | 959 | 199.8 |
| A | 8 | 15 | 20144 | 96.0 | 983 | 959 | 199.8 |
| B | 0 | 214 | 61493 | 310.3 | 1005 | 979 | 195.0 |
| B | 4 | 173 | 26672 | 131.75 | 1005 | 979 | 195.0 |
| B | 11 | 51 | 20124 | 98.17 | 1005 | 979 | 195.0 |
| C | 13 | 61 | 7644 | 29.71 | 969 | 971 | 224.6 |
| C | 12 | 4 | 5667 | 20.91 | 969 | 971 | 224.6 |
| C | 3 | 202 | 2381 | 6.28 | 969 | 971 | 224.6 |
| D | 2 | 33 | 840605 | 3631.98 | 952 | 919 | 231.2 |
| D | 2 | 63 | 182004 | 783.26 | 952 | 919 | 231.2 |
| D | 8 | 195 | 87011 | 372.38 | 952 | 919 | 231.2 |
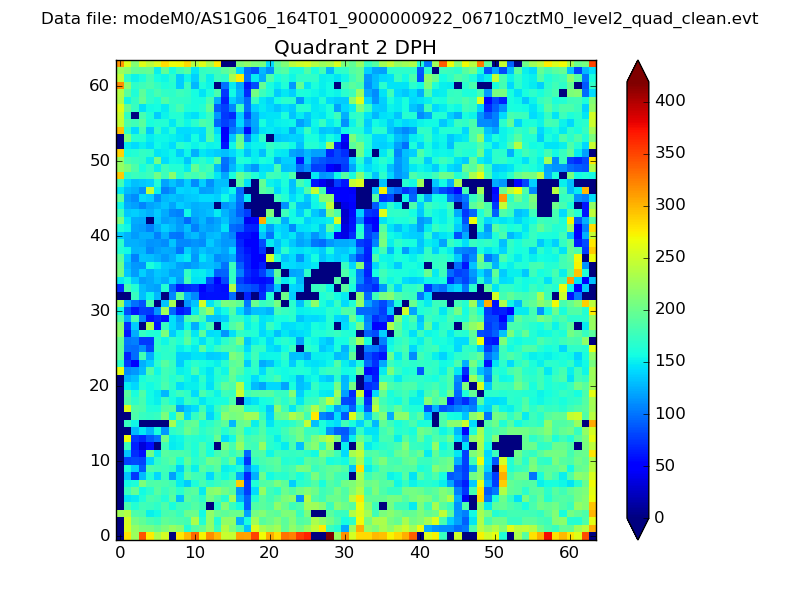
Histogram calculated using DETX and DETY for each event in the final _common_clean file
| Quadrant A | 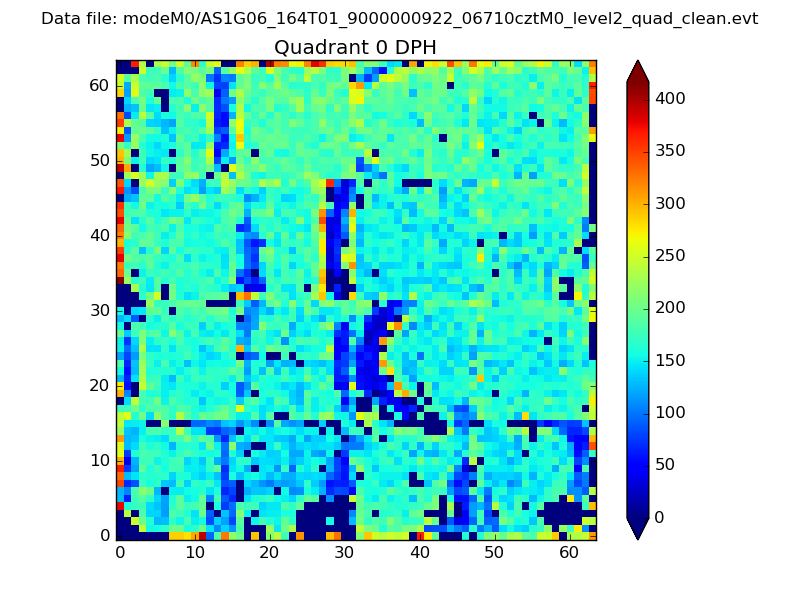 |
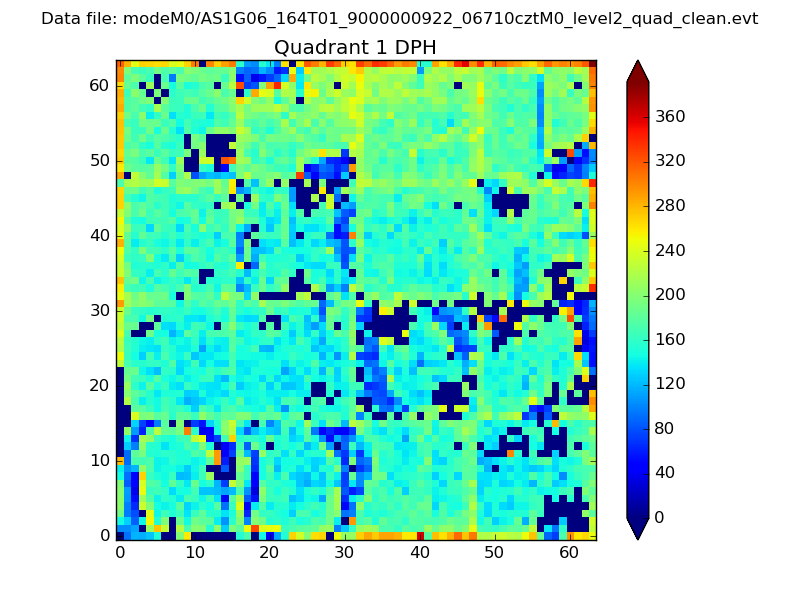 |
Quadrant B |
|---|---|---|---|
| Quadrant D | 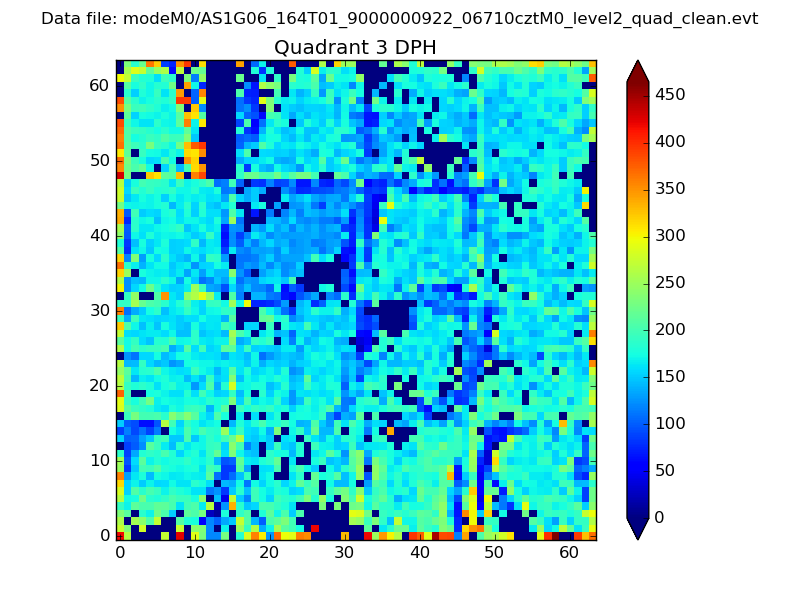 |
 |
Quadrant C |
| Plot type | Count rate plots | Images |
|---|---|---|
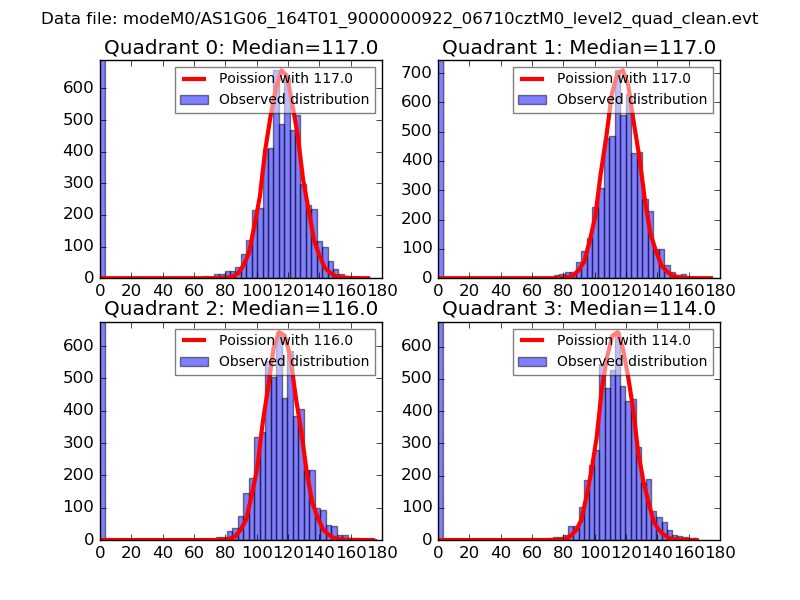
| Comparison with Poisson distribution Blue bars denote a histogram of data divided into 1 sec bins. Red curve is a Poisson curve with rate = median count rate of data. |
 |
 |
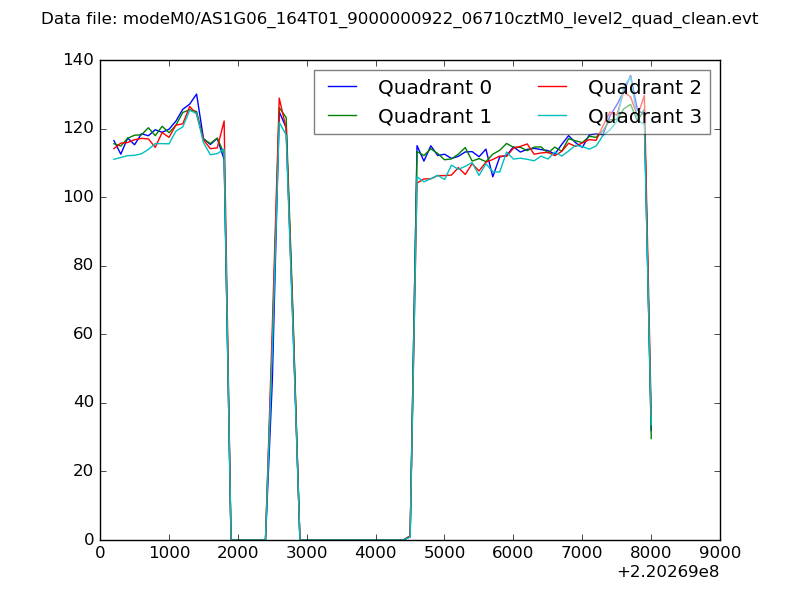
| Quadrant-wise count rates Data is divided into 100 sec bins |
 |
|
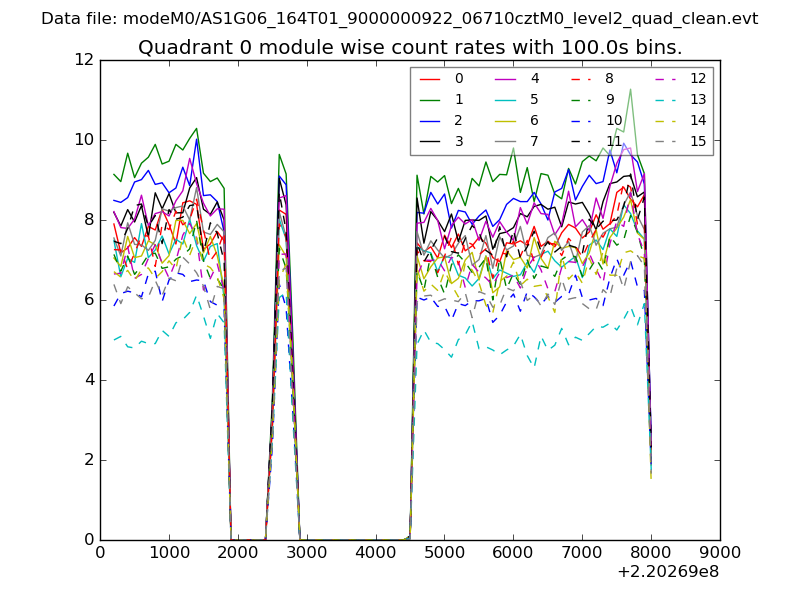
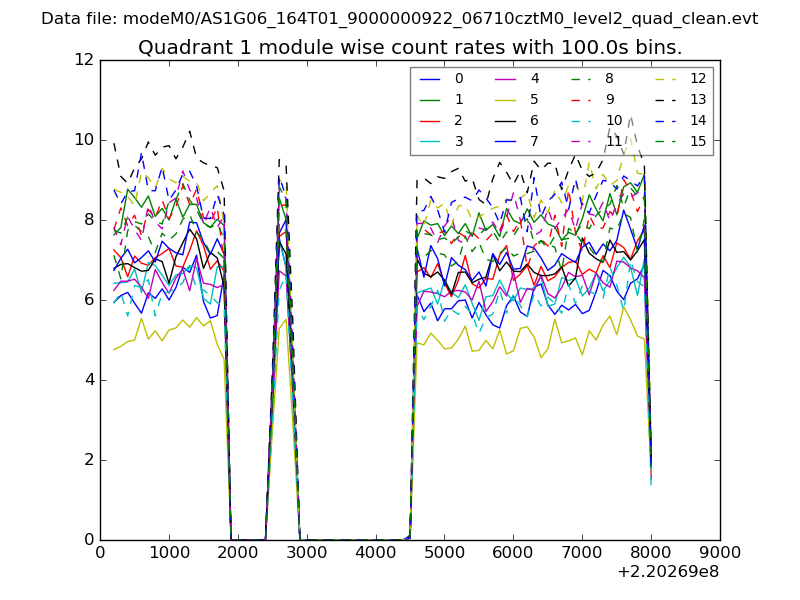
| Module-wise count rates for Quadrant A Data is divided into 100 sec bins |
 |
 |
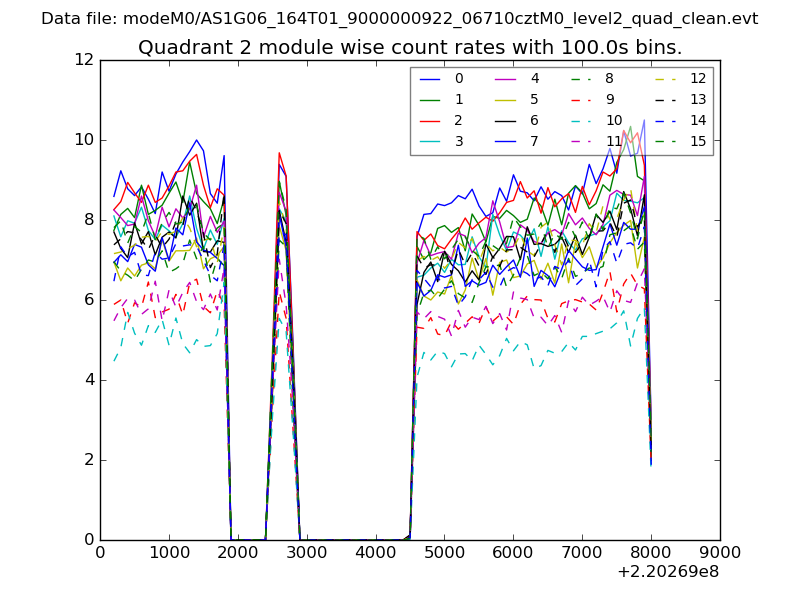
| Module-wise count rates for Quadrant B Data is divided into 100 sec bins |
 |
 |
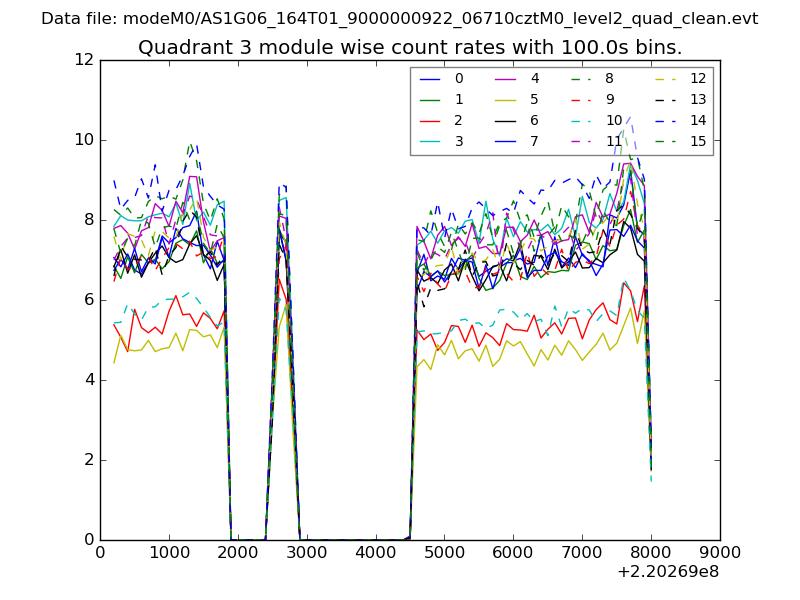
| Module-wise count rates for Quadrant C Data is divided into 100 sec bins |
 |
 |
| Module-wise count rates for Quadrant D Data is divided into 100 sec bins |
 |
 |
| Parameter | Plot |
|---|---|
| CZT HV Monitor |  |
| D_VDD | 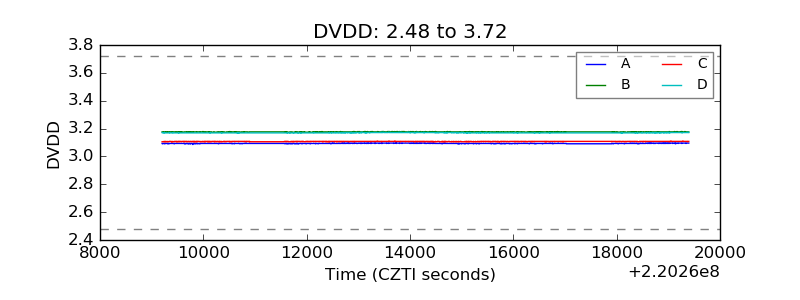 |
| Temperature 1 | 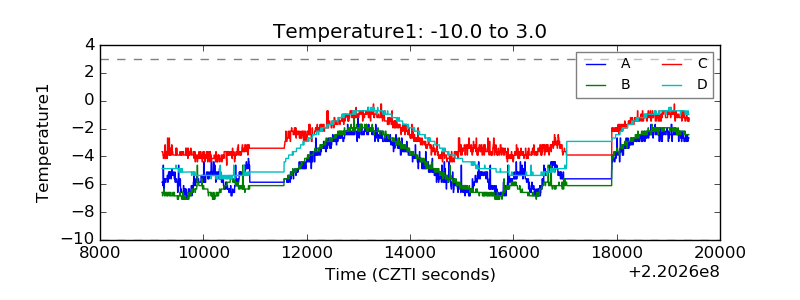 |
| Veto HV Monitor | 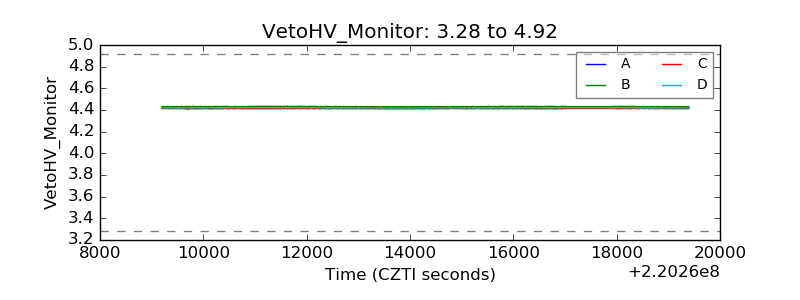 |
| Veto LLD | 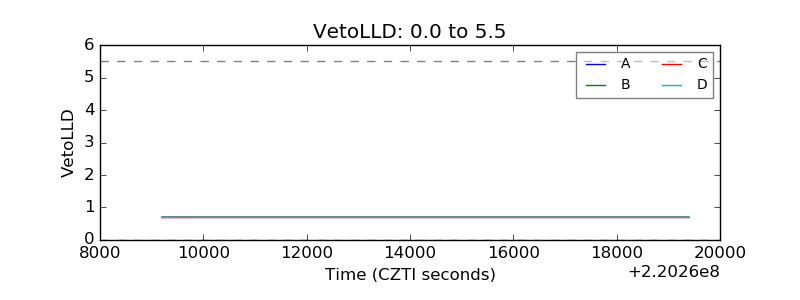 |
| Alpha Counter | 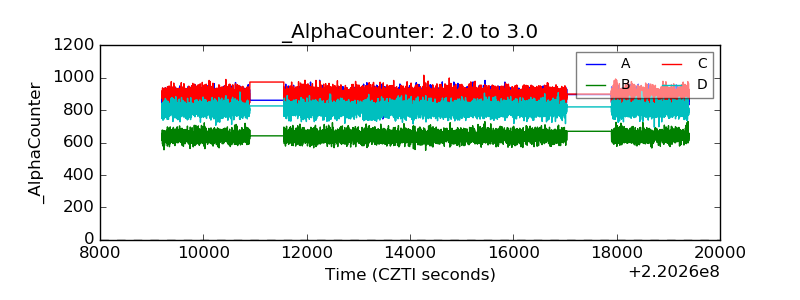 |
| _CPM_Rate | 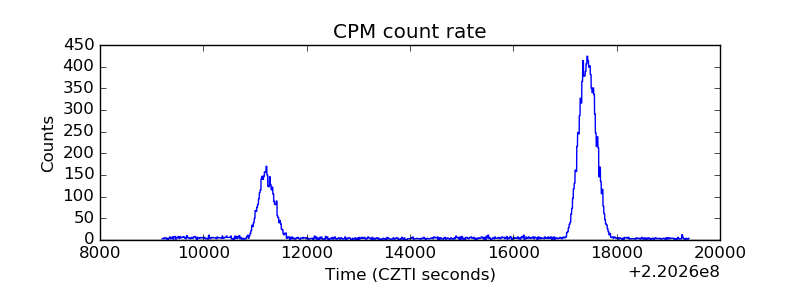 |
| CZT Counter | 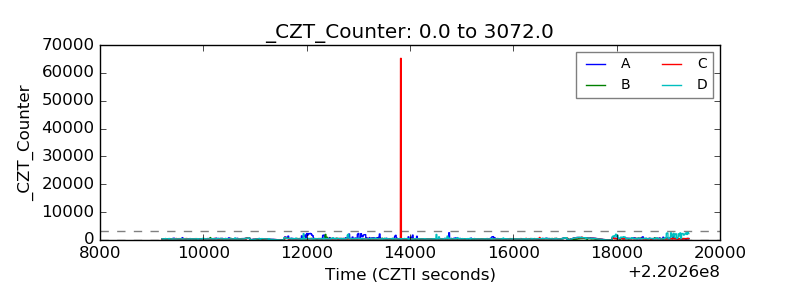 |
| +2.5 Volts monitor |  |
| +5 Volts monitor |  |
| _ROLL_ROT | 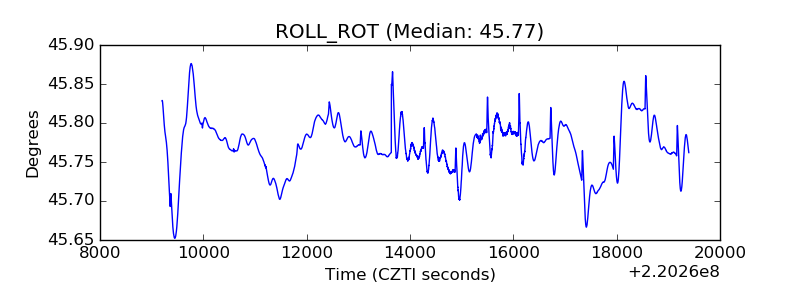 |
| _Roll_DEC | 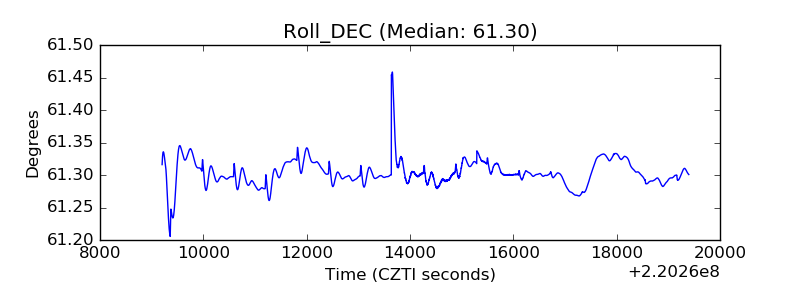 |
| _Roll_RA | 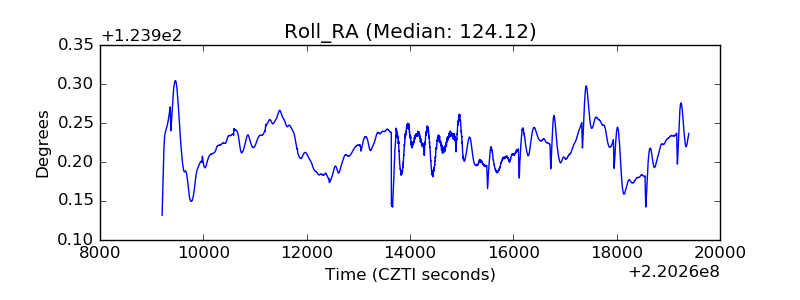 |
| Veto Counter | 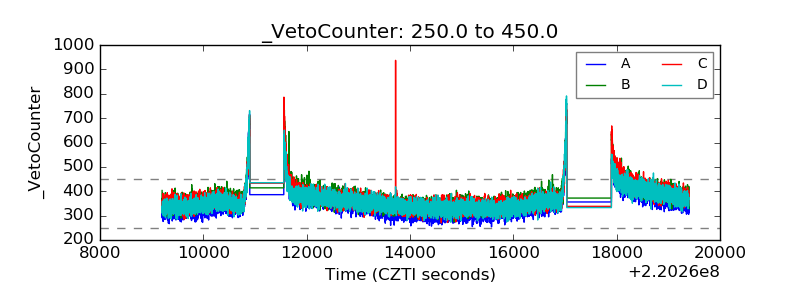 |