| Param | Original file | Final file |
|---|---|---|
| Filename | modeM0/AS1G06_164T01_9000000922_06713cztM0_level2.evt | modeM0/AS1G06_164T01_9000000922_06713cztM0_level2_quad_clean.evt |
| Size (bytes) | 546,782,400 | 87,816,960 |
| Size | 521.5 MB | 83.7 MB |
| Events in quadrant A | 3,421,148 | 571,542 |
| Events in quadrant B | 3,245,527 | 573,069 |
| Events in quadrant C | 3,003,746 | 567,848 |
| Events in quadrant D | 6,443,331 | 488,969 |
| Mode M9 | |||
|---|---|---|---|
| Quadrant | BADHDUFLAG | Total packets | Discarded packets |
| A | 0 | 16 | 0 |
| B | 0 | 16 | 0 |
| C | 0 | 16 | 0 |
| D | 0 | 17 | 0 |
| Mode SS | |||
|---|---|---|---|
| Quadrant | BADHDUFLAG | Total packets | Discarded packets |
| A | 0 | 134 | 0 |
| B | 0 | 134 | 0 |
| C | 0 | 134 | 0 |
| D | 0 | 134 | 0 |
| Mode M0 | |||
|---|---|---|---|
| Quadrant | BADHDUFLAG | Total packets | Discarded packets |
| A | 0 | 14721 | 3 |
| B | 0 | 14295 | 2 |
| C | 0 | 13540 | 2 |
| D | 0 | 23687 | 2 |
| Quadrant | Total seconds | Saturated seconds | Saturation percentage |
|---|---|---|---|
| A | 6558 | 197 | 3.003965% |
| B | 6558 | 86 | 1.311375% |
| C | 6558 | 74 | 1.128393% |
| D | 6558 | 1550 | 23.635255% |
Noise dominated data is calculated using 1-second bins in cleaned event files. If a bin has >2000 counts, and if more than 50% of those come from <1% of pixels, then it is considered to be noise-dominated and hence unusable.
| Quadrant | # 1 sec bins | Bins with >0 counts | Bins with >2000 counts | High rate bins dominated by noise | Noise dominated (total time) | Noise dominated (detector-on time) | Marked lightcurve |
|---|---|---|---|---|---|---|---|
| A | 7658 | 6559 | 53 | 53 | 0.69% | 0.81% | 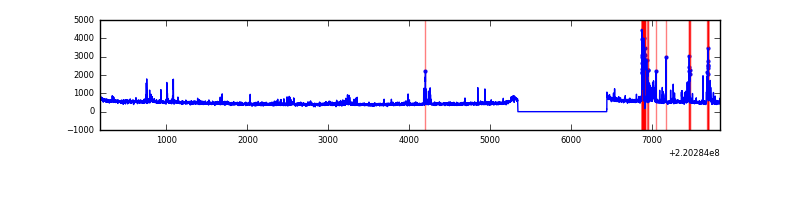 |
| B | 7658 | 6559 | 2 | 2 | 0.03% | 0.03% | 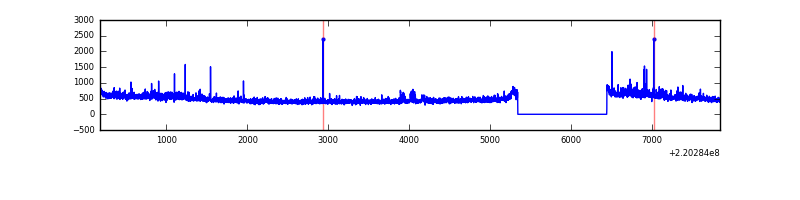 |
| C | 7658 | 6559 | 0 | 0 | 0.00% | 0.00% | 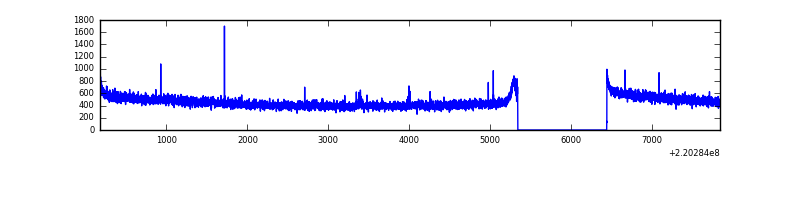 |
| D | 7658 | 6559 | 1245 | 1245 | 16.26% | 18.98% | 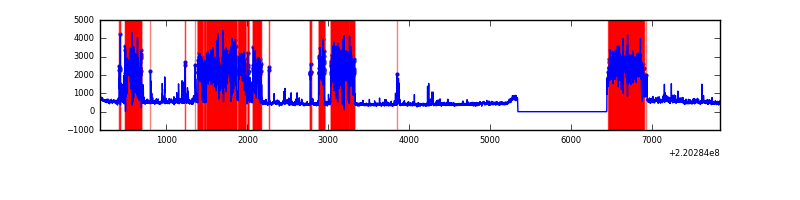 |
Top three noisy pixels from each quadrant. If the there are fewer than three noisy pixels in the level2.evt file, extra rows are filled as -1
| Pixel properties | Quadrant properties | ||||||
|---|---|---|---|---|---|---|---|
| Quadrant | DetID | PixID | Counts | Sigma | Mean | Median | Sigma |
| A | 14 | 111 | 284926 | 1793.88 | 778 | 762 | 158.4 |
| A | 8 | 15 | 92266 | 577.65 | 778 | 762 | 158.4 |
| A | 4 | 2 | 31887 | 196.49 | 778 | 762 | 158.4 |
| B | 0 | 214 | 101015 | 668.23 | 791 | 773 | 150.0 |
| B | 4 | 81 | 37761 | 246.57 | 791 | 773 | 150.0 |
| B | 0 | 198 | 15225 | 96.34 | 791 | 773 | 150.0 |
| C | 13 | 61 | 5925 | 29.3 | 768 | 771 | 175.9 |
| C | 4 | 254 | 3737 | 16.86 | 768 | 771 | 175.9 |
| C | 12 | 4 | 2902 | 12.12 | 768 | 771 | 175.9 |
| D | 2 | 33 | 3657415 | 22771.39 | 660 | 639 | 160.6 |
| D | 8 | 195 | 162502 | 1007.95 | 660 | 639 | 160.6 |
| D | 2 | 152 | 47974 | 294.76 | 660 | 639 | 160.6 |
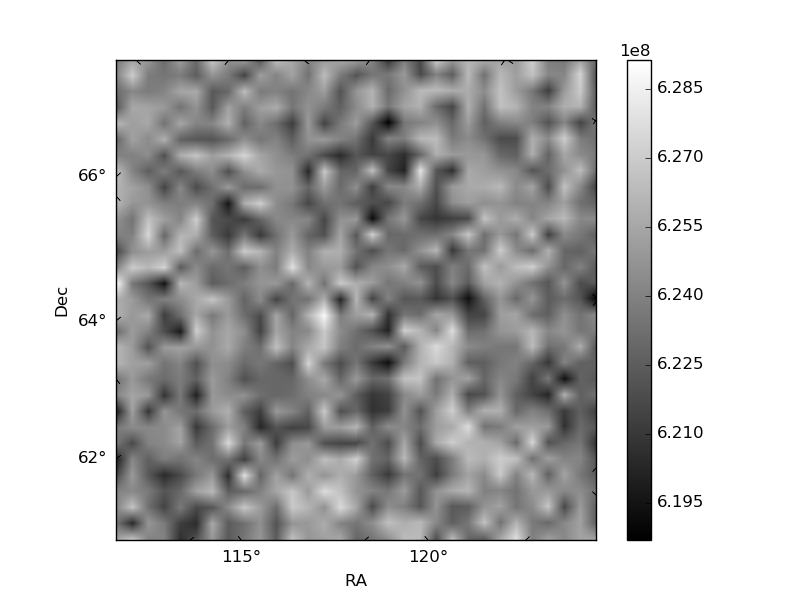
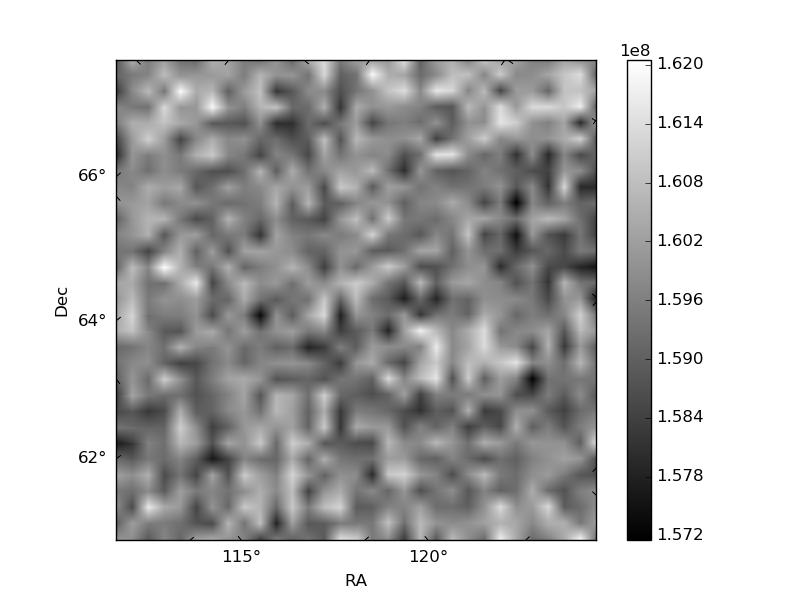
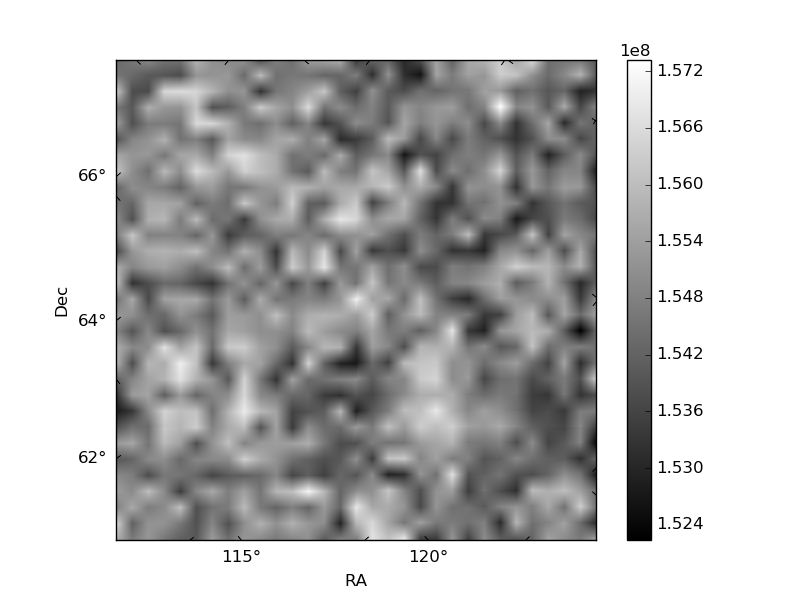
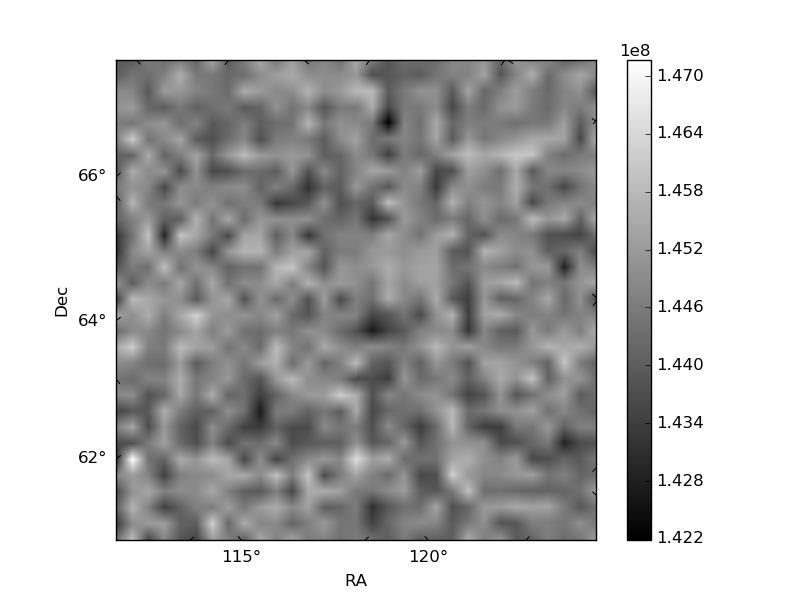
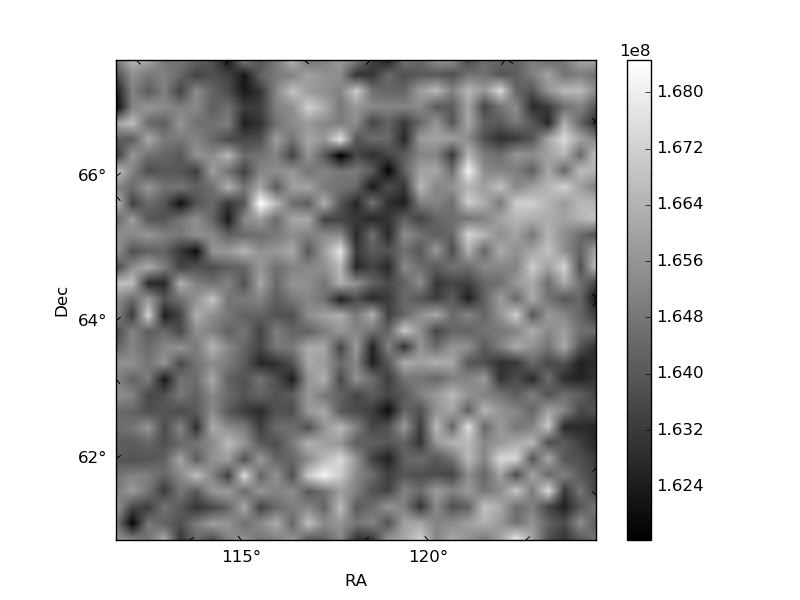
Histogram calculated using DETX and DETY for each event in the final _common_clean file
| Quadrant A | 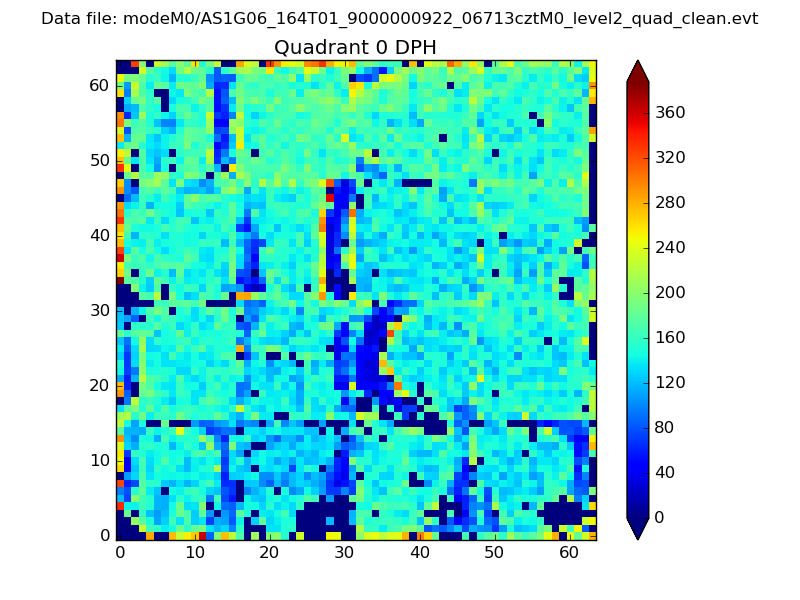 |
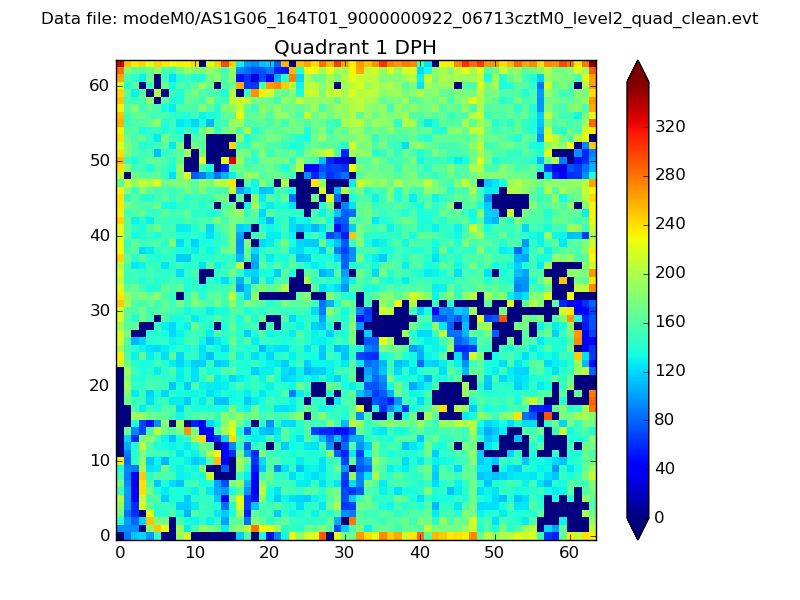 |
Quadrant B |
|---|---|---|---|
| Quadrant D | 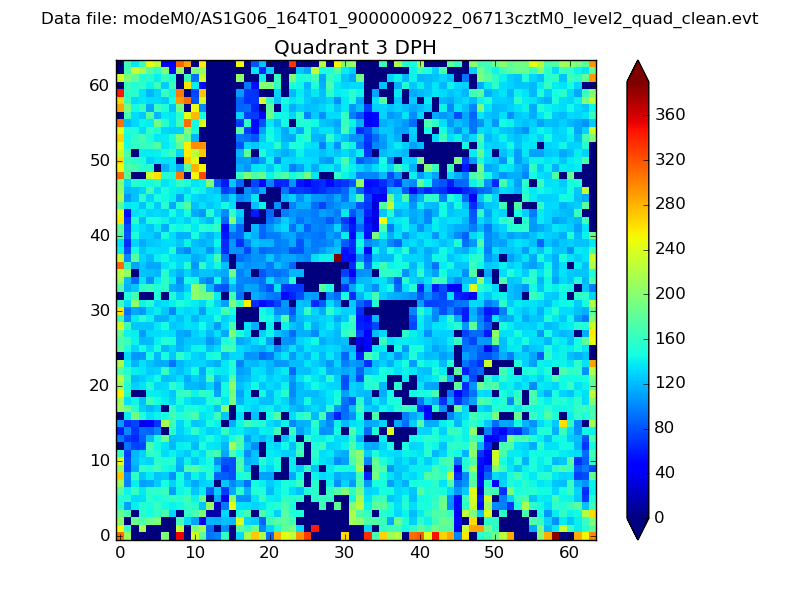 |
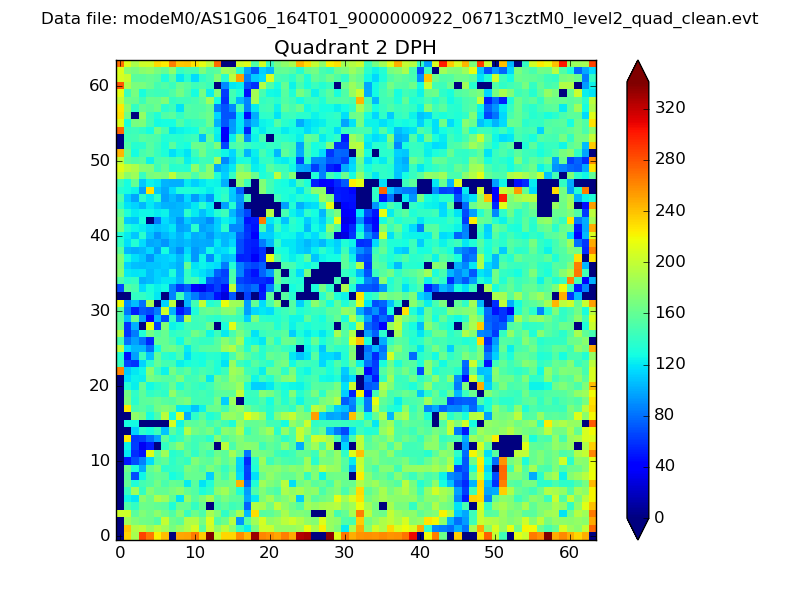 |
Quadrant C |
| Plot type | Count rate plots | Images |
|---|---|---|
| Comparison with Poisson distribution Blue bars denote a histogram of data divided into 1 sec bins. Red curve is a Poisson curve with rate = median count rate of data. |
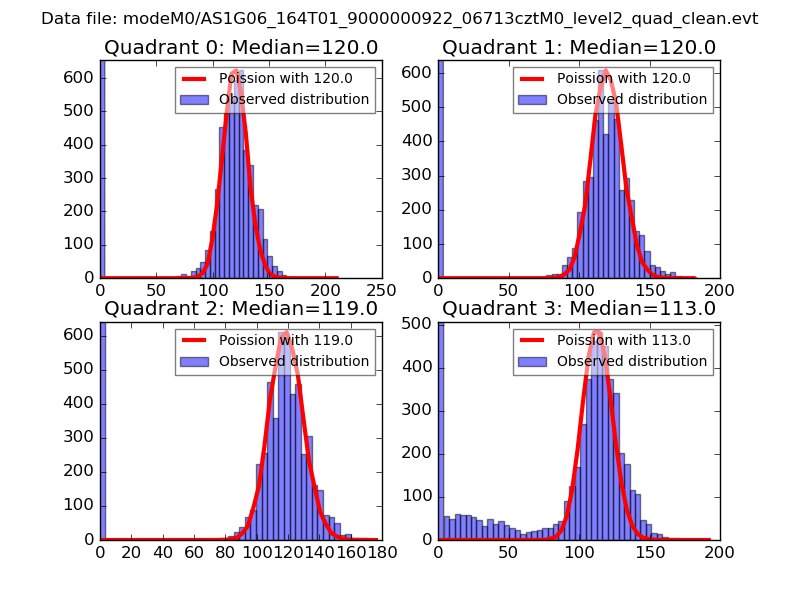 |
 |
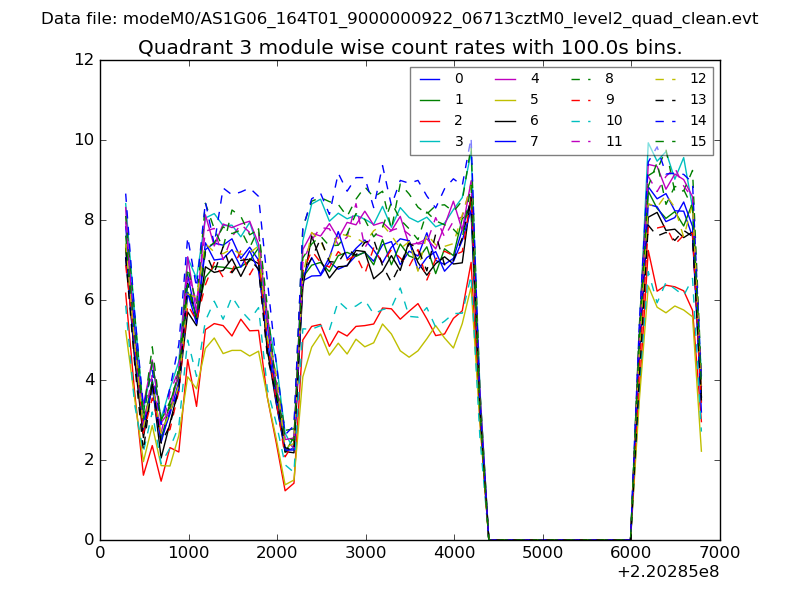
| Quadrant-wise count rates Data is divided into 100 sec bins |
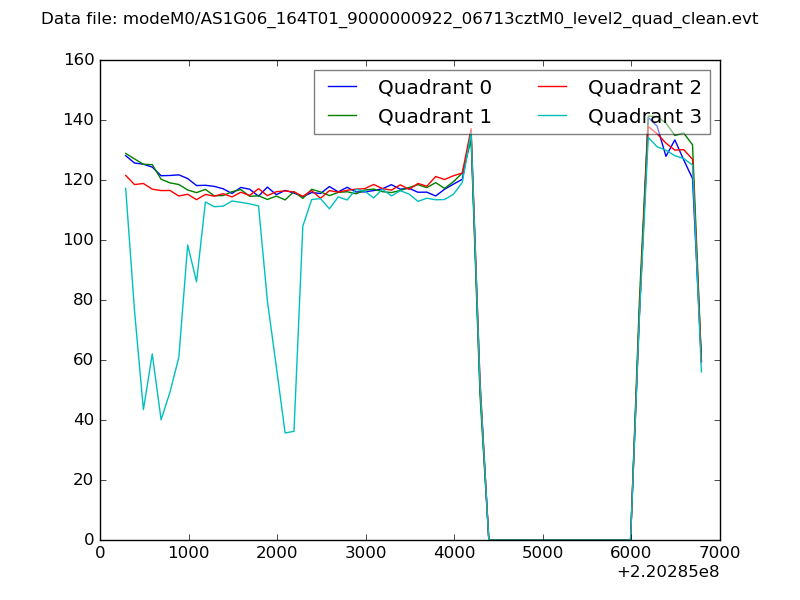 |
|
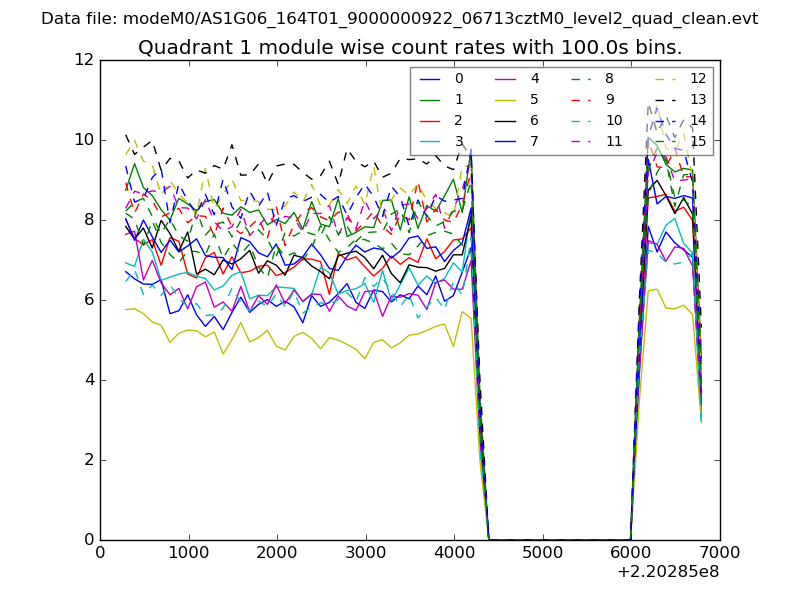
| Module-wise count rates for Quadrant A Data is divided into 100 sec bins |
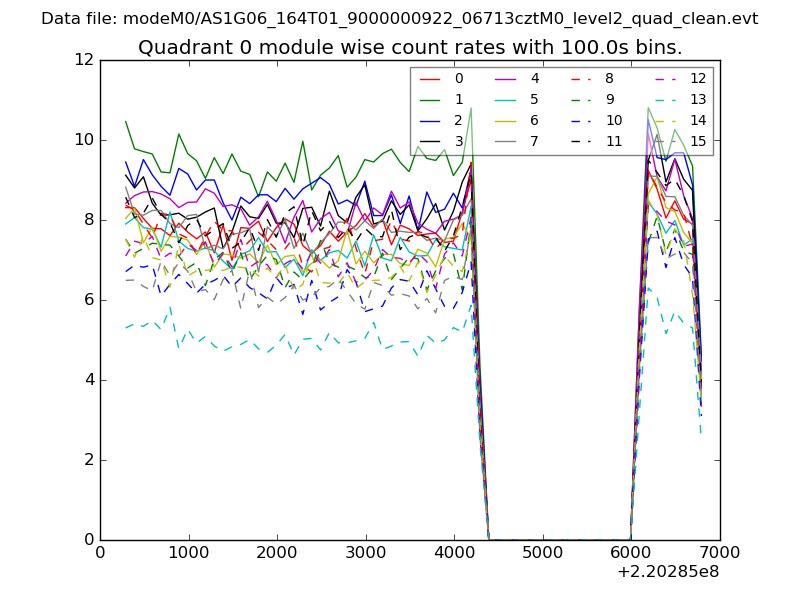 |
 |
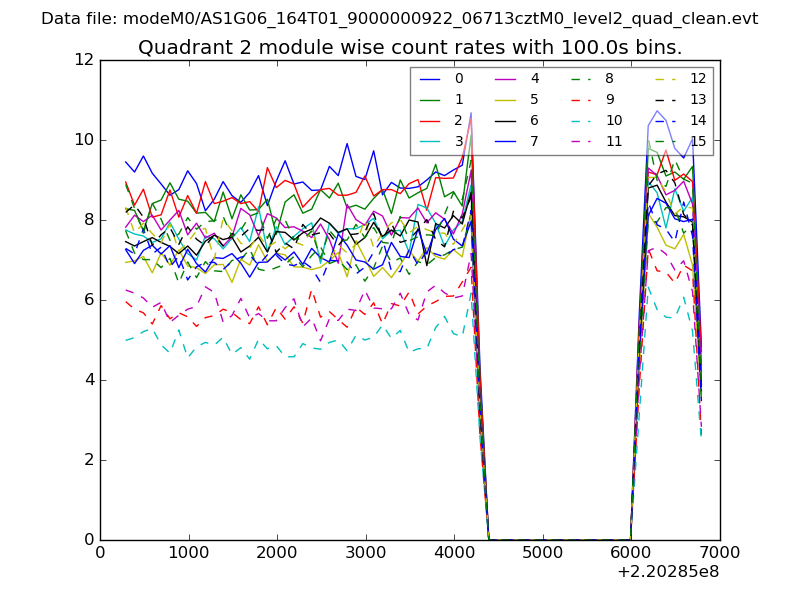
| Module-wise count rates for Quadrant B Data is divided into 100 sec bins |
 |
 |
| Module-wise count rates for Quadrant C Data is divided into 100 sec bins |
 |
 |
| Module-wise count rates for Quadrant D Data is divided into 100 sec bins |
 |
 |
| Parameter | Plot |
|---|---|
| CZT HV Monitor | 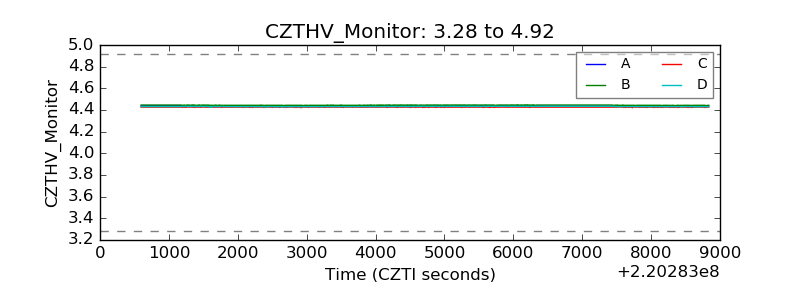 |
| D_VDD | 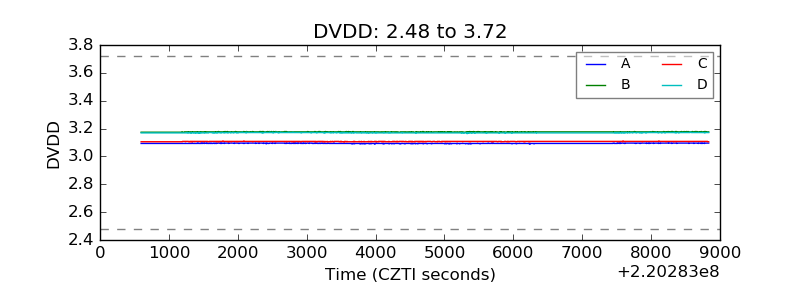 |
| Temperature 1 | 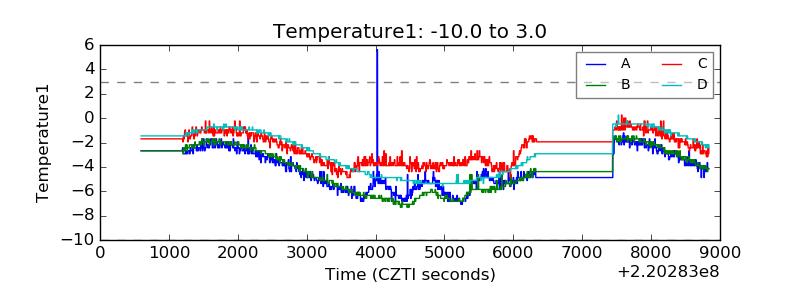 |
| Veto HV Monitor | 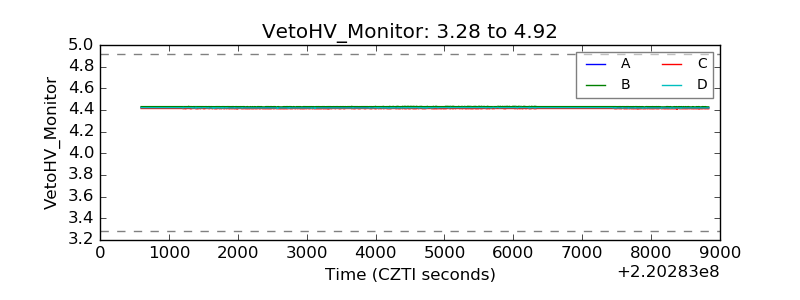 |
| Veto LLD | 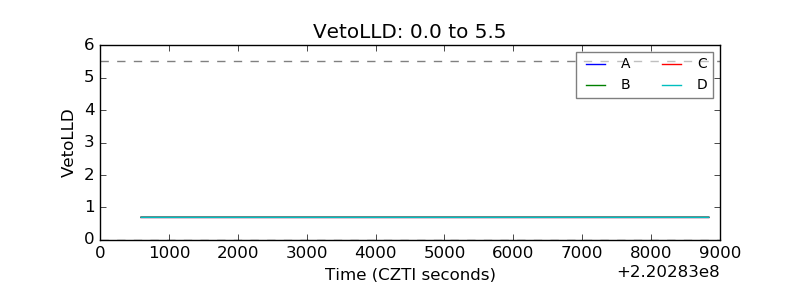 |
| Alpha Counter | 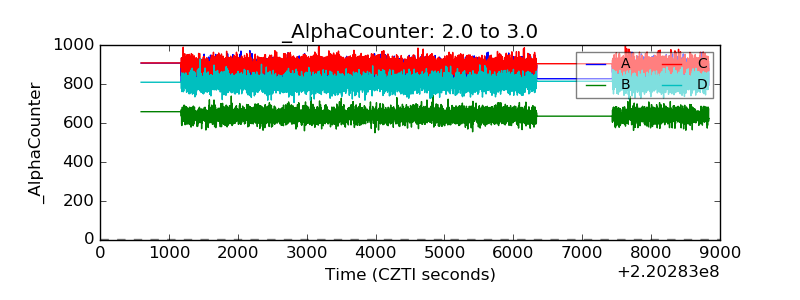 |
| _CPM_Rate | 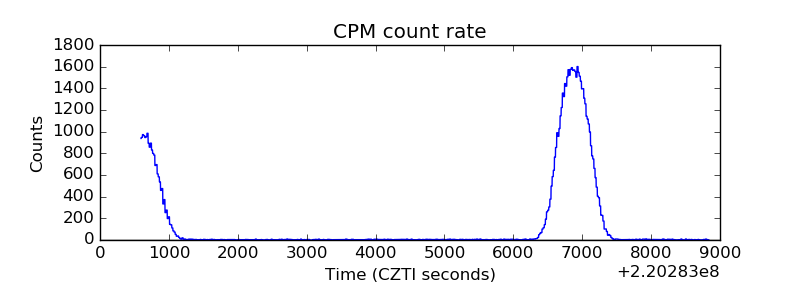 |
| CZT Counter | 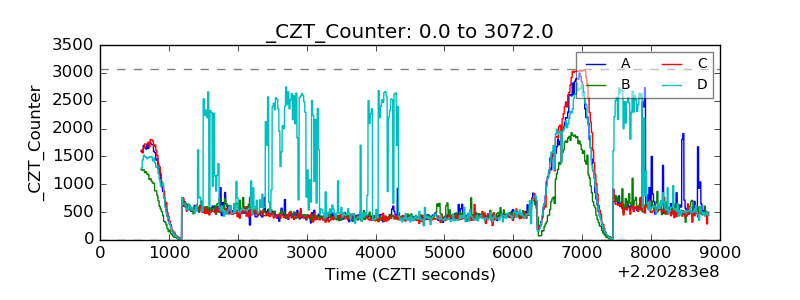 |
| +2.5 Volts monitor |  |
| +5 Volts monitor |  |
| _ROLL_ROT | 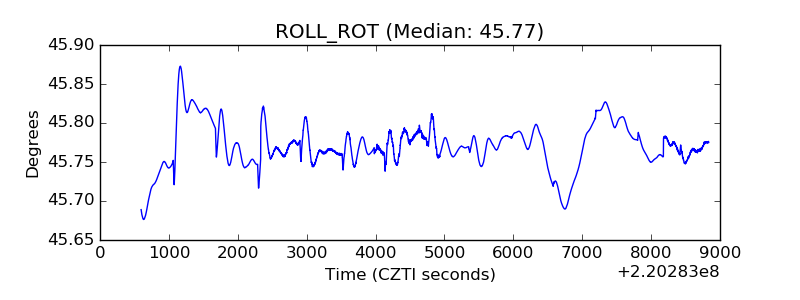 |
| _Roll_DEC | 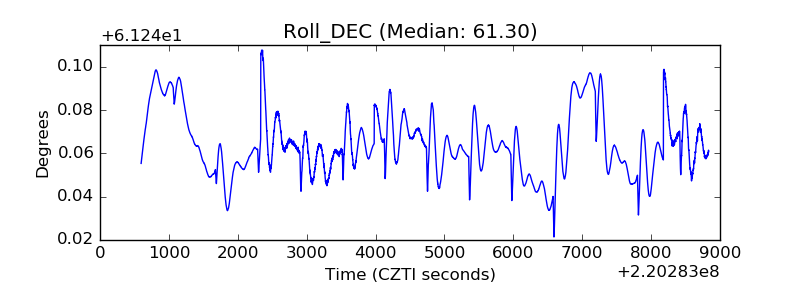 |
| _Roll_RA | 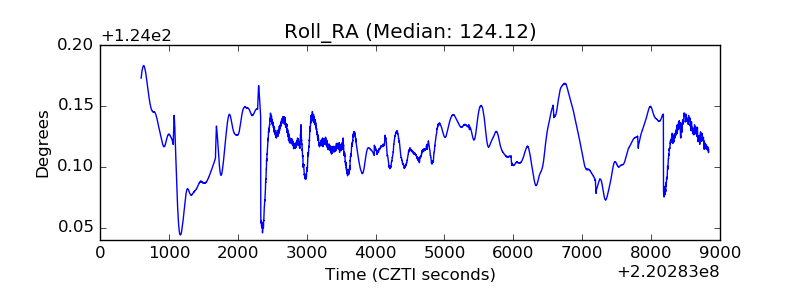 |
| Veto Counter | 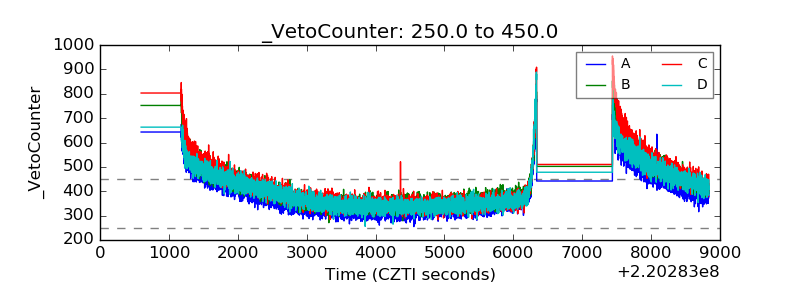 |