| Param | Original file | Final file |
|---|---|---|
| Filename | modeM0/AS1G06_066T01_9000000928cztM0_level2.fits | modeM0/AS1G06_066T01_9000000928cztM0_level2_quad_clean.evt |
| Size (bytes) | 71,380,800 | 32,002,560 |
| Size | 68.1 MB | 30.5 MB |
| Events in quadrant A | 429,204 | 110,281 |
| Events in quadrant B | 412,918 | 111,636 |
| Events in quadrant C | 419,466 | 105,580 |
| Events in quadrant D | 354,594 | 94,776 |
| Mode M9 | |||
|---|---|---|---|
| Quadrant | BADHDUFLAG | Total packets | Discarded packets |
| A | 0 | 11 | 0 |
| B | 0 | 11 | 0 |
| C | 0 | 11 | 0 |
| D | 0 | 11 | 0 |
| Mode SS | |||
|---|---|---|---|
| Quadrant | BADHDUFLAG | Total packets | Discarded packets |
| A | 0 | 156 | 0 |
| B | 0 | 156 | 0 |
| C | 0 | 156 | 0 |
| D | 0 | 156 | 0 |
| Mode M0 | |||
|---|---|---|---|
| Quadrant | BADHDUFLAG | Total packets | Discarded packets |
| A | 0 | 17513 | 0 |
| B | 0 | 16624 | 0 |
| C | 0 | 16029 | 0 |
| D | 0 | 24308 | 0 |
| Quadrant | Total seconds | Saturated seconds | Saturation percentage |
|---|---|---|---|
| A | 7855 | 172 | 2.189688% |
| B | 7855 | 106 | 1.349459% |
| C | 7855 | 56 | 0.712922% |
| D | 7855 | 493 | 6.276257% |
Noise dominated data is calculated using 1-second bins in cleaned event files. If a bin has >2000 counts, and if more than 50% of those come from <1% of pixels, then it is considered to be noise-dominated and hence unusable.
| Quadrant | # 1 sec bins | Bins with >0 counts | Bins with >2000 counts | High rate bins dominated by noise | Noise dominated (total time) | Noise dominated (detector-on time) | Marked lightcurve |
|---|---|---|---|---|---|---|---|
| A | 8865 | 7855 | 0 | 0 | 0.00% | 0.00% |  |
| B | 8865 | 7855 | 0 | 0 | 0.00% | 0.00% | 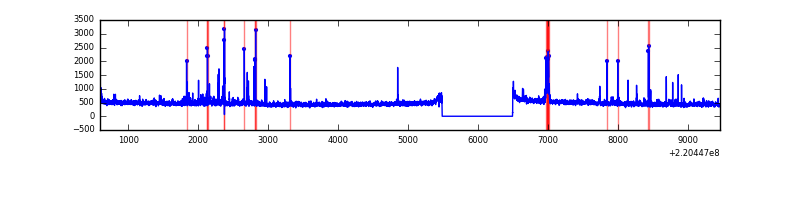 |
| C | 8865 | 7855 | 0 | 0 | 0.00% | 0.00% |  |
| D | 8865 | 7849 | 0 | 0 | 0.00% | 0.00% |  |
Top three noisy pixels from each quadrant. If the there are fewer than three noisy pixels in the level2.evt file, extra rows are filled as -1
| Pixel properties | Quadrant properties | ||||||
|---|---|---|---|---|---|---|---|
| Quadrant | DetID | PixID | Counts | Sigma | Mean | Median | Sigma |
| A | 0 | 29 | 421 | 10.58 | 111 | 105 | 29.9 |
| A | 7 | 110 | 353 | 8.3 | 111 | 105 | 29.9 |
| A | 0 | 30 | 342 | 7.93 | 111 | 105 | 29.9 |
| B | 2 | 9 | 355 | 10.25 | 109 | 104 | 24.5 |
| B | 12 | 226 | 307 | 8.29 | 109 | 104 | 24.5 |
| B | 14 | 254 | 298 | 7.92 | 109 | 104 | 24.5 |
| C | 1 | 81 | 319 | 7.07 | 110 | 102 | 30.7 |
| C | 1 | 80 | 311 | 6.81 | 110 | 102 | 30.7 |
| C | 7 | 111 | 300 | 6.45 | 110 | 102 | 30.7 |
| D | 11 | 82 | 281 | 6.56 | 100 | 91 | 29.0 |
| D | 6 | 231 | 281 | 6.56 | 100 | 91 | 29.0 |
| D | 11 | 16 | 275 | 6.35 | 100 | 91 | 29.0 |
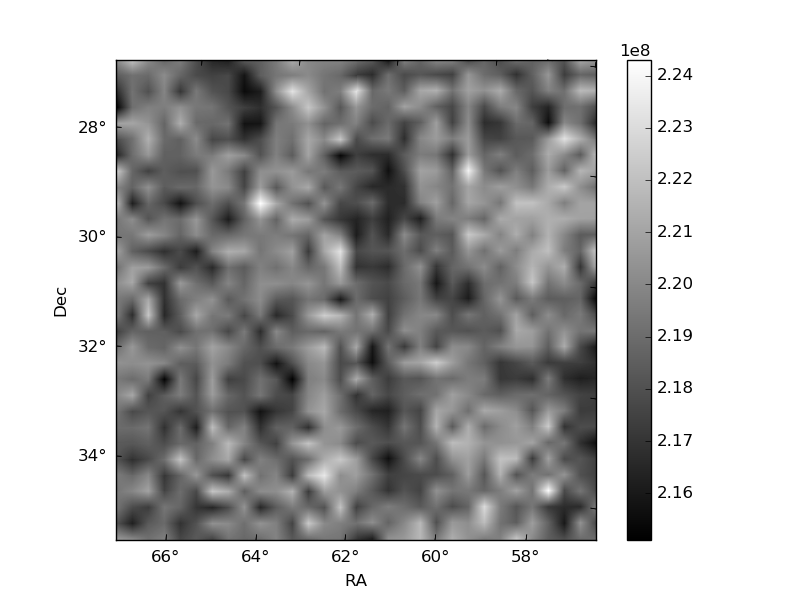
Histogram calculated using DETX and DETY for each event in the final _common_clean file
| Quadrant A | 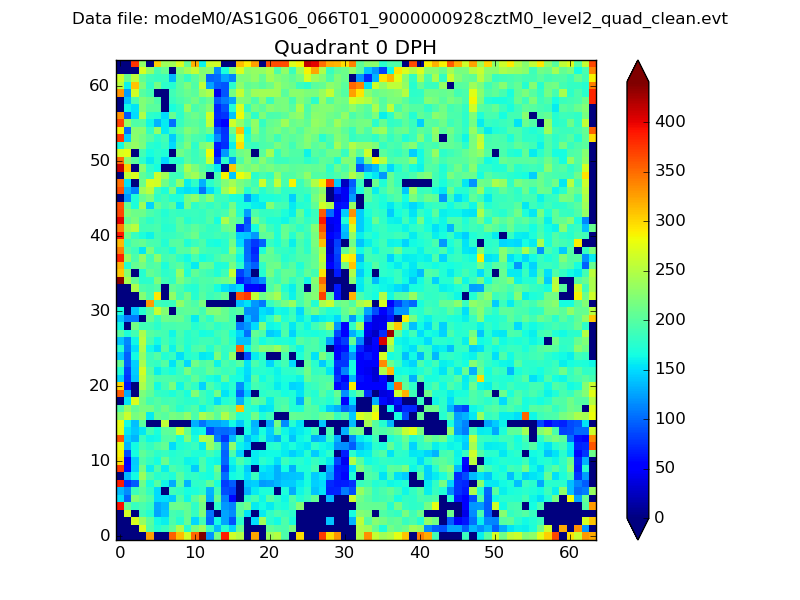 |
 |
Quadrant B |
|---|---|---|---|
| Quadrant D |  |
 |
Quadrant C |
| Plot type | Count rate plots | Images |
|---|---|---|
| Comparison with Poisson distribution Blue bars denote a histogram of data divided into 1 sec bins. Red curve is a Poisson curve with rate = median count rate of data. |
 |
 |
| Quadrant-wise count rates Data is divided into 100 sec bins |
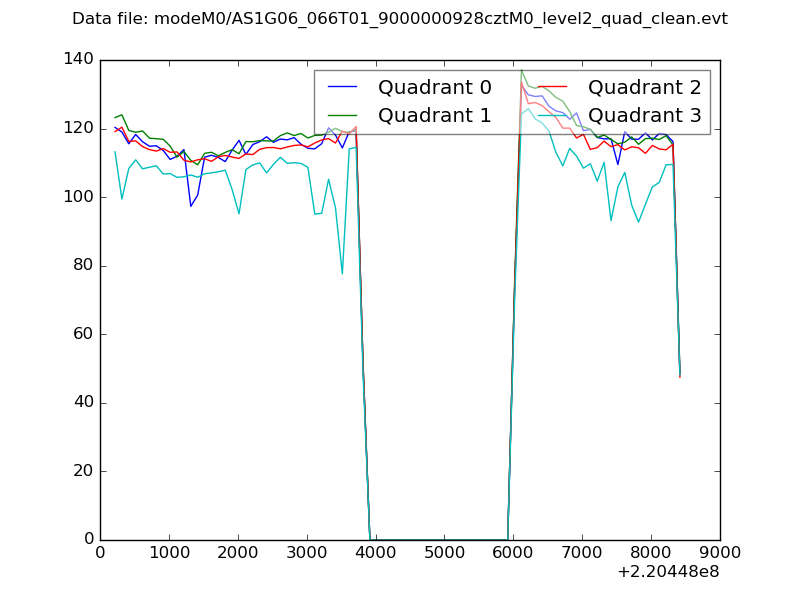 |
|
| Module-wise count rates for Quadrant A Data is divided into 100 sec bins |
 |
 |
| Module-wise count rates for Quadrant B Data is divided into 100 sec bins |
 |
 |
| Module-wise count rates for Quadrant C Data is divided into 100 sec bins |
 |
 |
| Module-wise count rates for Quadrant D Data is divided into 100 sec bins |
 |
 |
| Parameter | Plot |
|---|---|
| CZT HV Monitor |  |
| D_VDD |  |
| Temperature 1 | 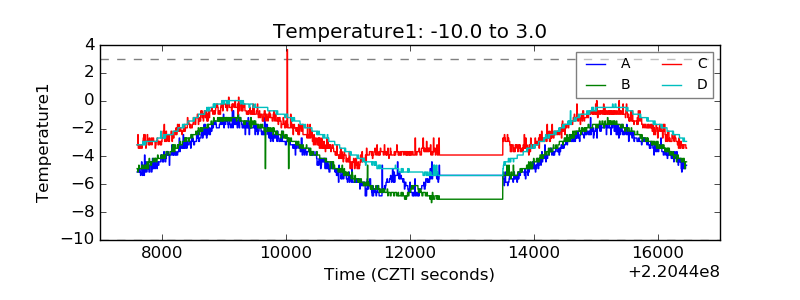 |
| Veto HV Monitor |  |
| Veto LLD | 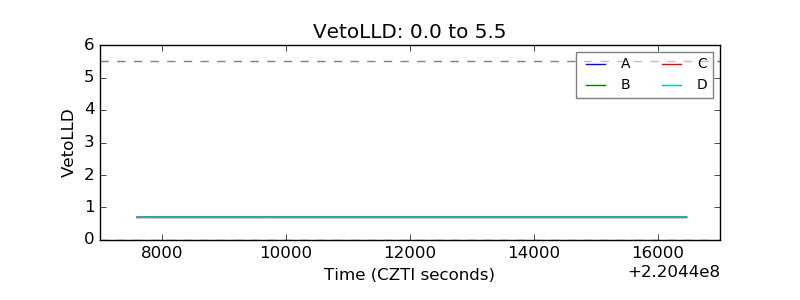 |
| Alpha Counter |  |
| _CPM_Rate |  |
| CZT Counter |  |
| +2.5 Volts monitor |  |
| +5 Volts monitor |  |
| _ROLL_ROT |  |
| _Roll_DEC |  |
| _Roll_RA | 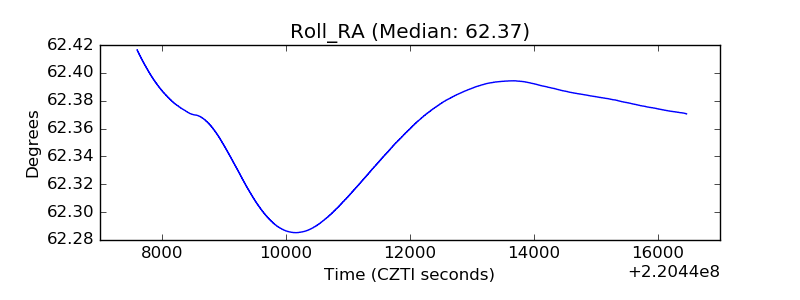 |
| Veto Counter |  |