| Param | Original file | Final file |
|---|---|---|
| Filename | modeM0/AS1G06_066T01_9000000928_06739cztM0_level2.evt | modeM0/AS1G06_066T01_9000000928_06739cztM0_level2_quad_clean.evt |
| Size (bytes) | 79,315,200 | 10,828,800 |
| Size | 75.6 MB | 10.3 MB |
| Events in quadrant A | 556,212 | 60,986 |
| Events in quadrant B | 560,673 | 62,798 |
| Events in quadrant C | 534,873 | 60,773 |
| Events in quadrant D | 669,902 | 56,357 |
| Mode SS | |||
|---|---|---|---|
| Quadrant | BADHDUFLAG | Total packets | Discarded packets |
| A | 0 | 22 | 0 |
| B | 0 | 22 | 0 |
| C | 0 | 22 | 0 |
| D | 0 | 22 | 0 |
| Mode M0 | |||
|---|---|---|---|
| Quadrant | BADHDUFLAG | Total packets | Discarded packets |
| A | 0 | 2325 | 1 |
| B | 0 | 2330 | 0 |
| C | 0 | 2291 | 0 |
| D | 0 | 2650 | 0 |
| Quadrant | Total seconds | Saturated seconds | Saturation percentage |
|---|---|---|---|
| A | 1139 | 4 | 0.351185% |
| B | 1139 | 3 | 0.263389% |
| C | 1139 | 0 | 0.000000% |
| D | 1139 | 32 | 2.809482% |
Noise dominated data is calculated using 1-second bins in cleaned event files. If a bin has >2000 counts, and if more than 50% of those come from <1% of pixels, then it is considered to be noise-dominated and hence unusable.
| Quadrant | # 1 sec bins | Bins with >0 counts | Bins with >2000 counts | High rate bins dominated by noise | Noise dominated (total time) | Noise dominated (detector-on time) | Marked lightcurve |
|---|---|---|---|---|---|---|---|
| A | 1139 | 1139 | 3 | 3 | 0.26% | 0.26% | 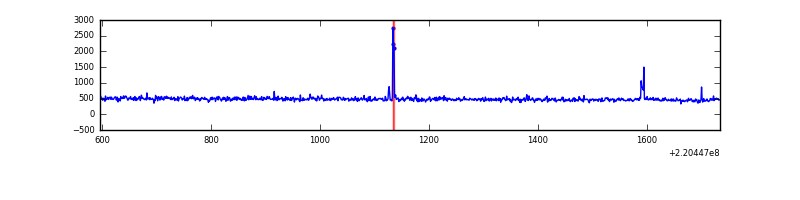 |
| B | 1139 | 1139 | 0 | 0 | 0.00% | 0.00% | 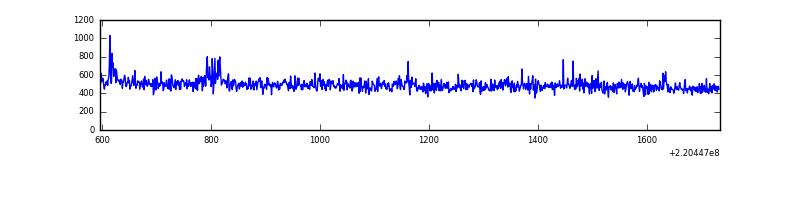 |
| C | 1139 | 1139 | 0 | 0 | 0.00% | 0.00% | 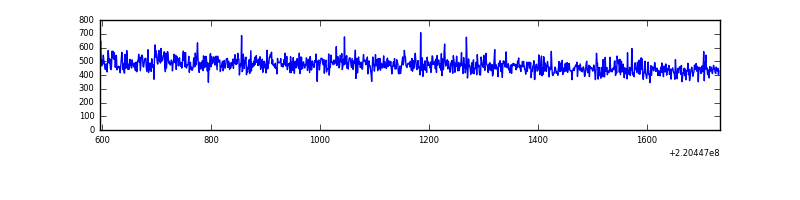 |
| D | 1139 | 1139 | 24 | 24 | 2.11% | 2.11% | 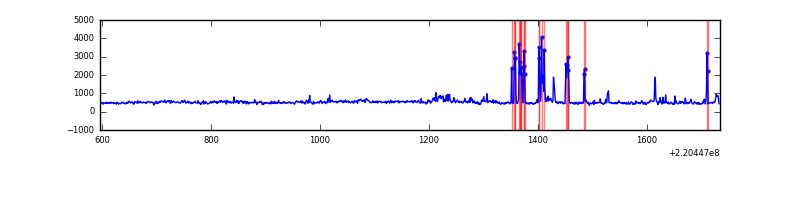 |
Top three noisy pixels from each quadrant. If the there are fewer than three noisy pixels in the level2.evt file, extra rows are filled as -1
| Pixel properties | Quadrant properties | ||||||
|---|---|---|---|---|---|---|---|
| Quadrant | DetID | PixID | Counts | Sigma | Mean | Median | Sigma |
| A | 15 | 236 | 12109 | 386.29 | 140 | 136 | 31.0 |
| A | 0 | 23 | 2122 | 64.07 | 140 | 136 | 31.0 |
| A | 0 | 226 | 1441 | 42.1 | 140 | 136 | 31.0 |
| B | 4 | 81 | 13139 | 439.64 | 140 | 136 | 29.6 |
| B | 12 | 111 | 2891 | 93.15 | 140 | 136 | 29.6 |
| B | 11 | 111 | 2406 | 76.75 | 140 | 136 | 29.6 |
| C | 9 | 16 | 9765 | 289.56 | 134 | 134 | 33.3 |
| C | 12 | 4 | 1149 | 30.52 | 134 | 134 | 33.3 |
| C | 13 | 61 | 1032 | 27.0 | 134 | 134 | 33.3 |
| D | 2 | 136 | 79940 | 2314.03 | 132 | 127 | 34.5 |
| D | 8 | 195 | 55919 | 1617.59 | 132 | 127 | 34.5 |
| D | 14 | 34 | 25001 | 721.18 | 132 | 127 | 34.5 |
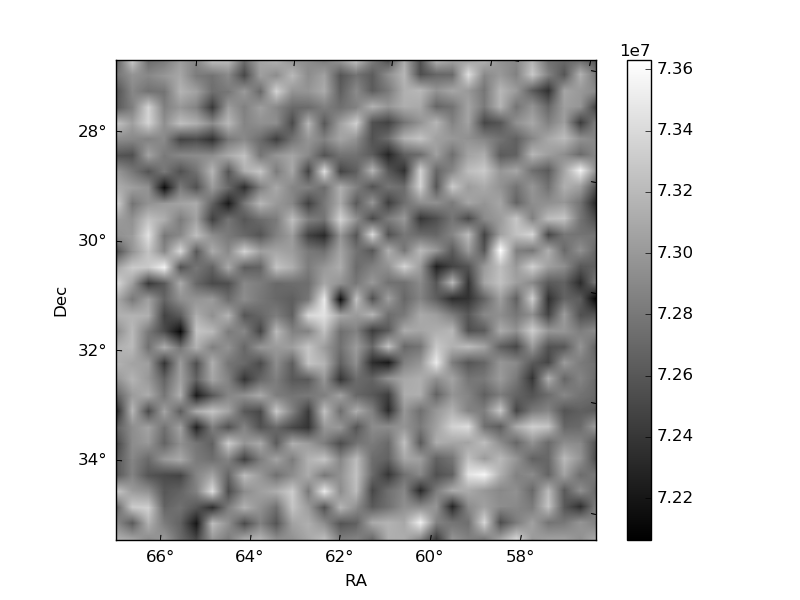
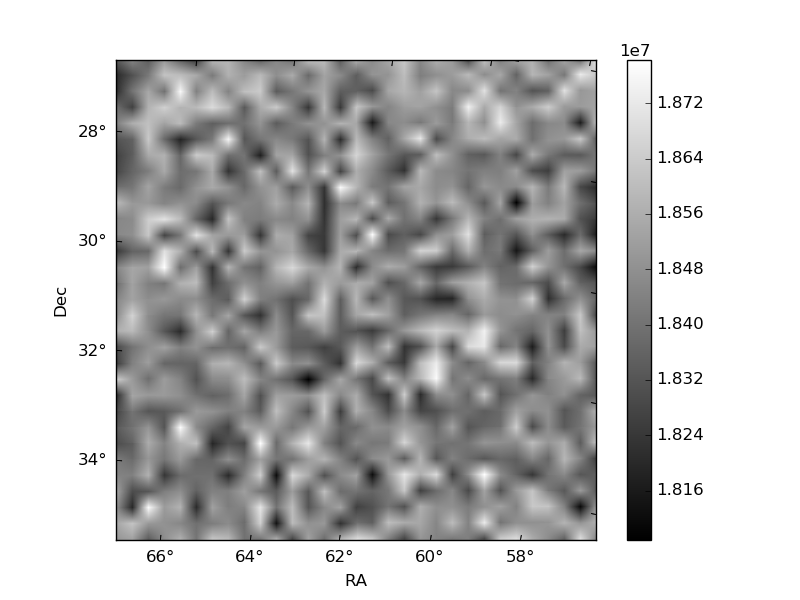
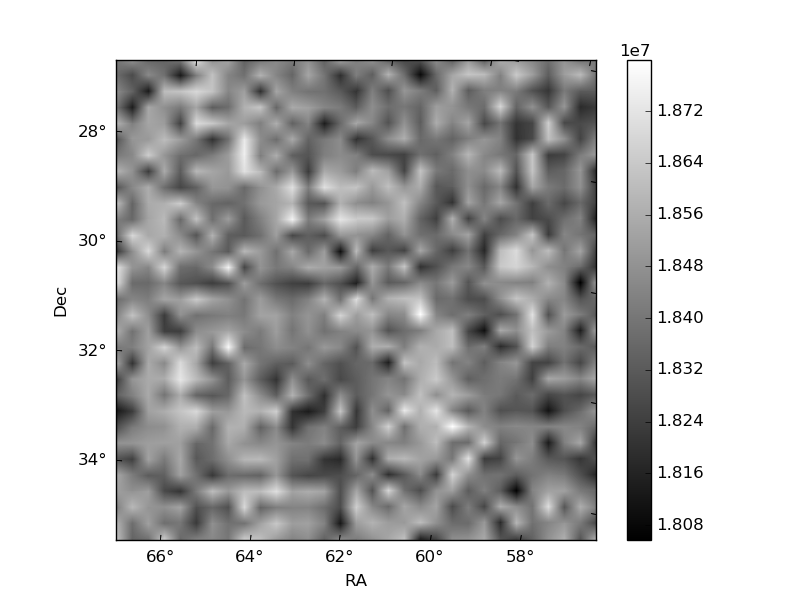
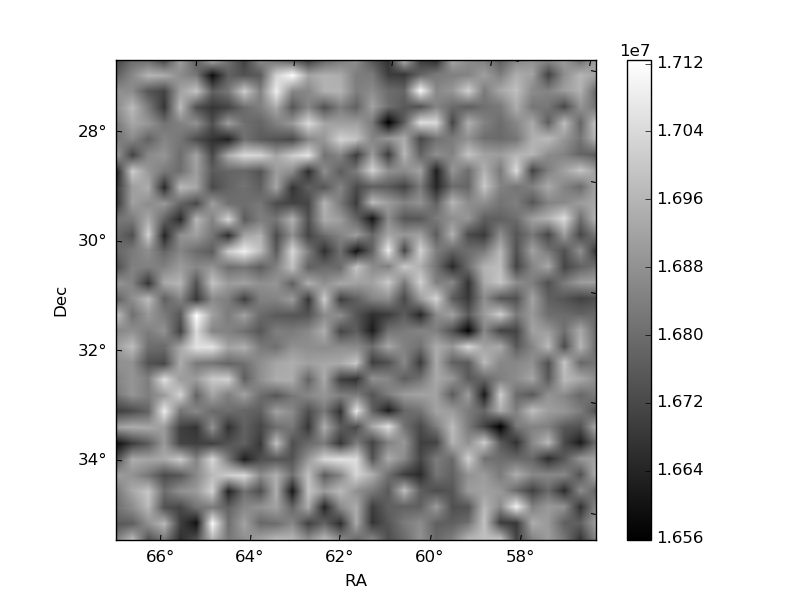
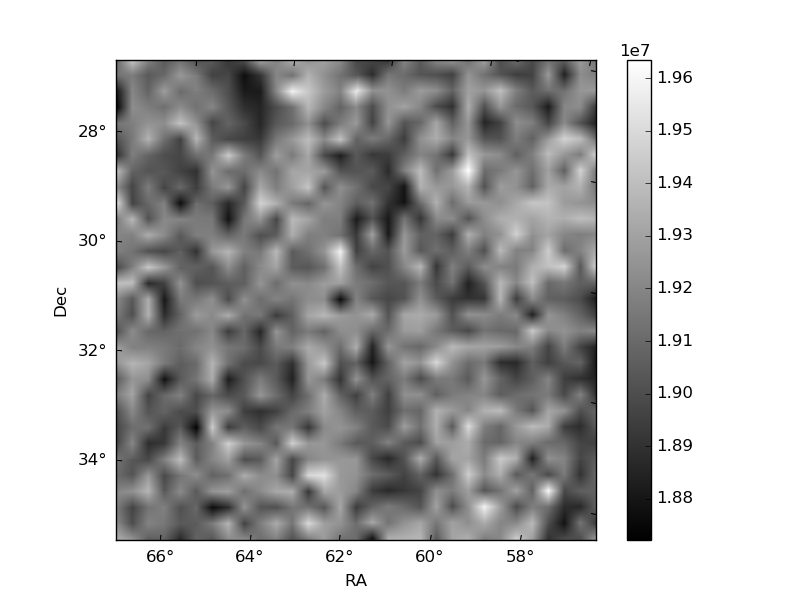
Histogram calculated using DETX and DETY for each event in the final _common_clean file
| Quadrant A | 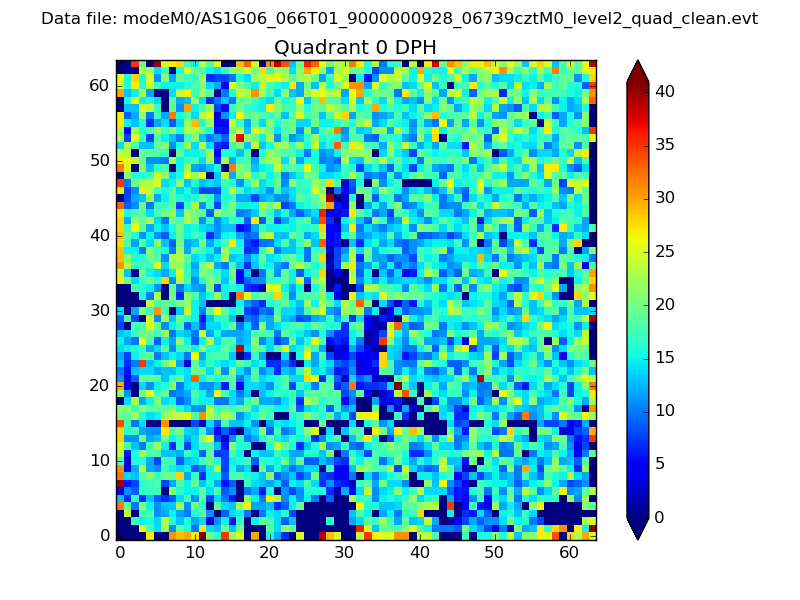 |
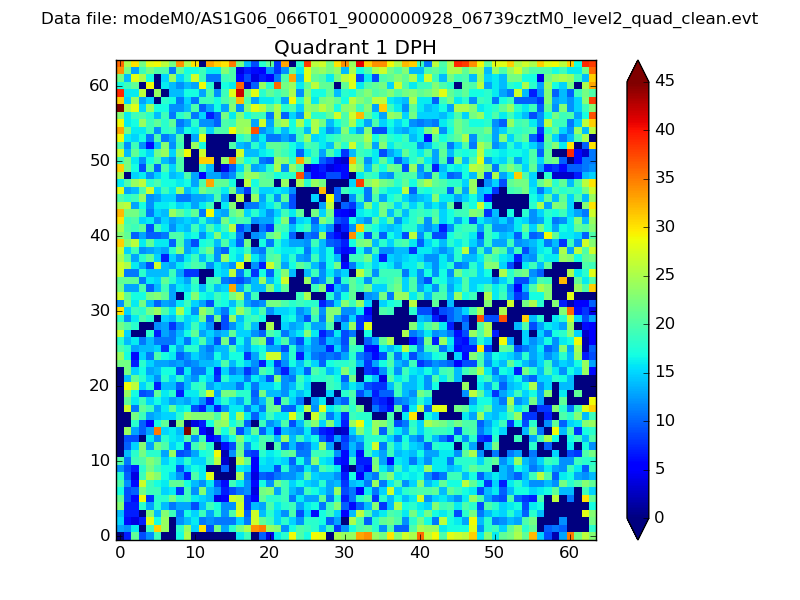 |
Quadrant B |
|---|---|---|---|
| Quadrant D | 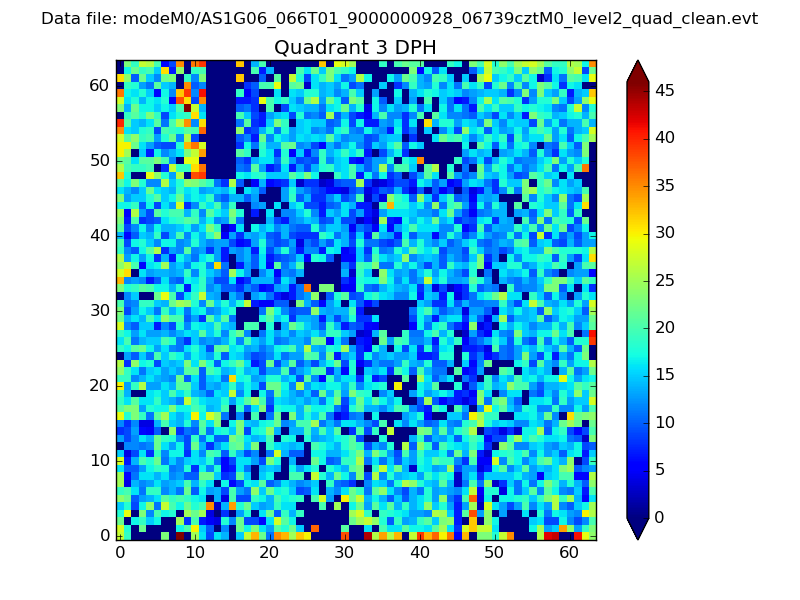 |
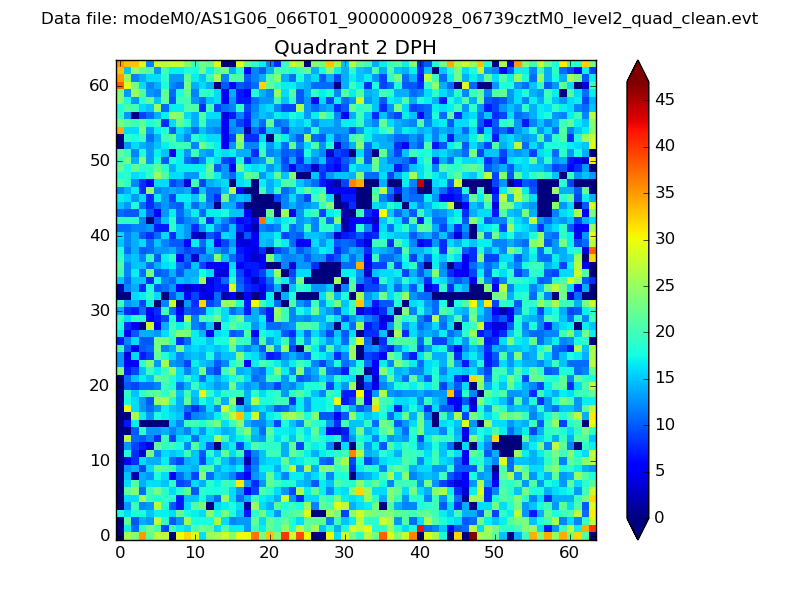 |
Quadrant C |
| Plot type | Count rate plots | Images |
|---|---|---|
| Comparison with Poisson distribution Blue bars denote a histogram of data divided into 1 sec bins. Red curve is a Poisson curve with rate = median count rate of data. |
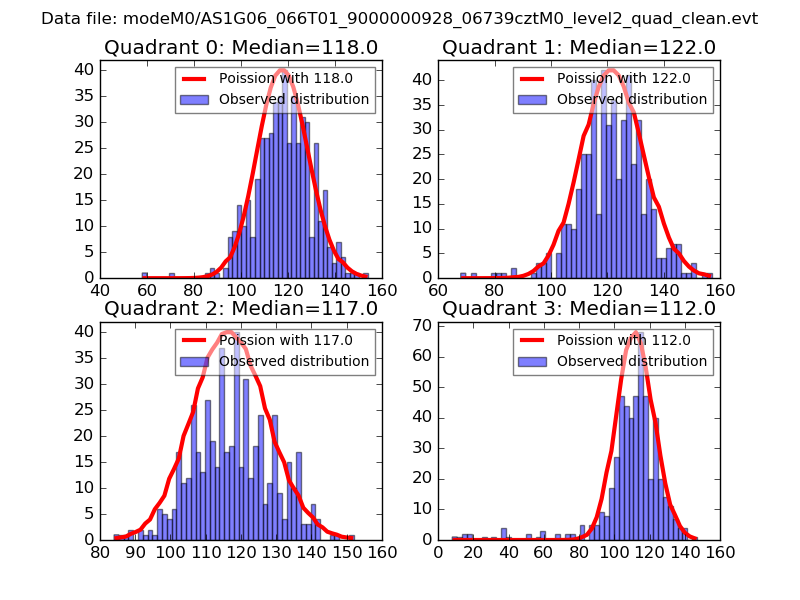 |
 |
| Quadrant-wise count rates Data is divided into 100 sec bins |
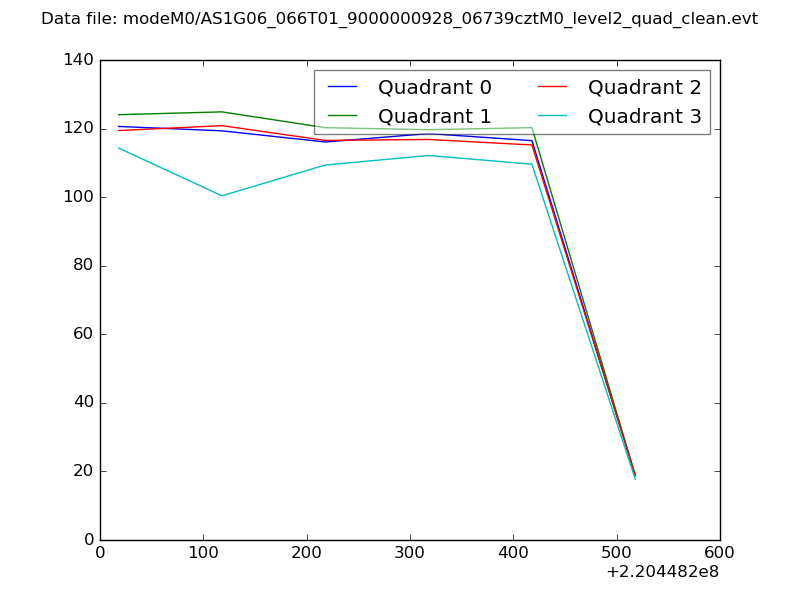 |
|
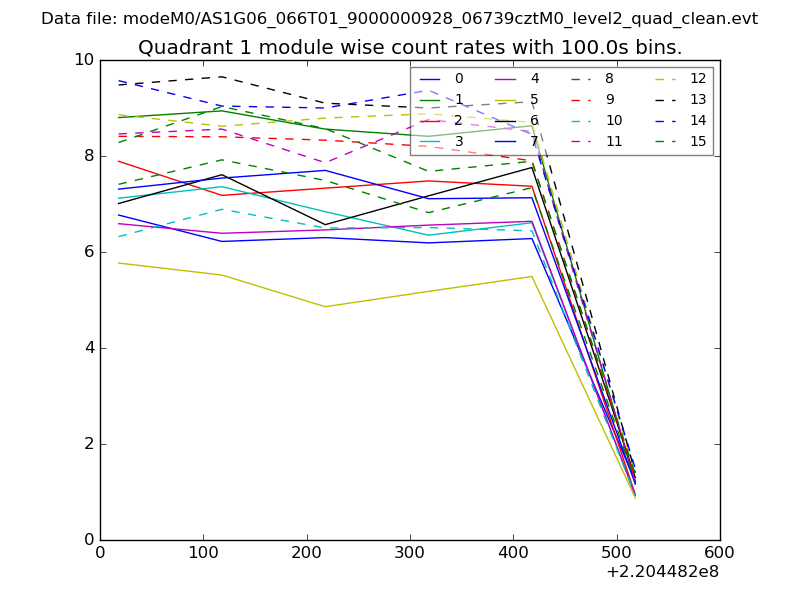
| Module-wise count rates for Quadrant A Data is divided into 100 sec bins |
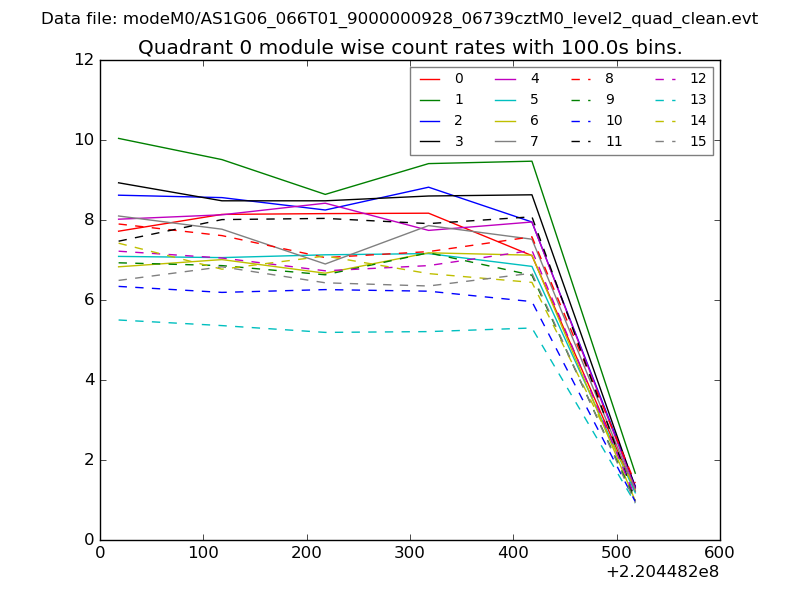 |
 |
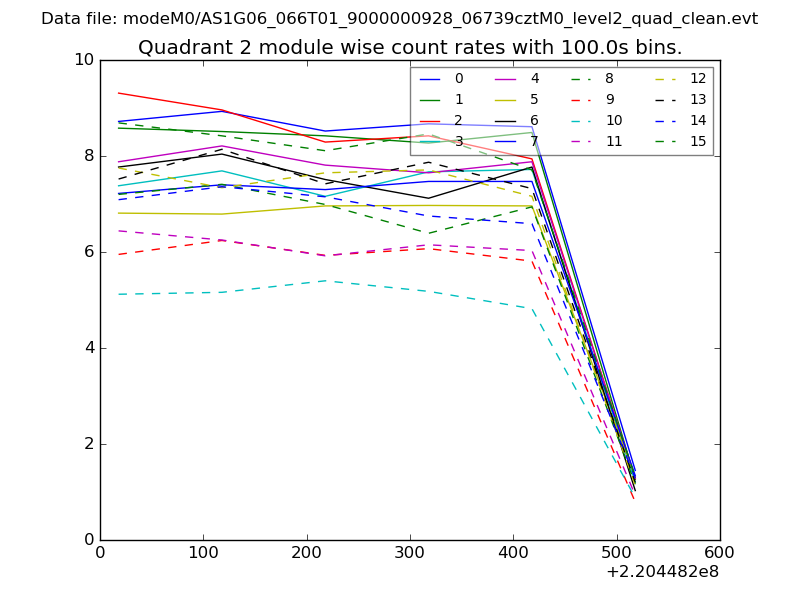
| Module-wise count rates for Quadrant B Data is divided into 100 sec bins |
 |
 |
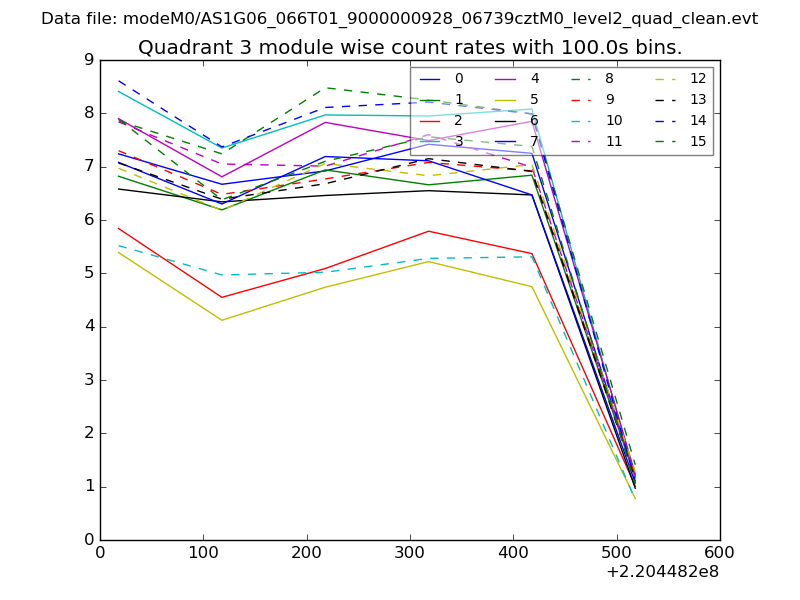
| Module-wise count rates for Quadrant C Data is divided into 100 sec bins |
 |
 |
| Module-wise count rates for Quadrant D Data is divided into 100 sec bins |
 |
 |
| Parameter | Plot |
|---|---|
| CZT HV Monitor | 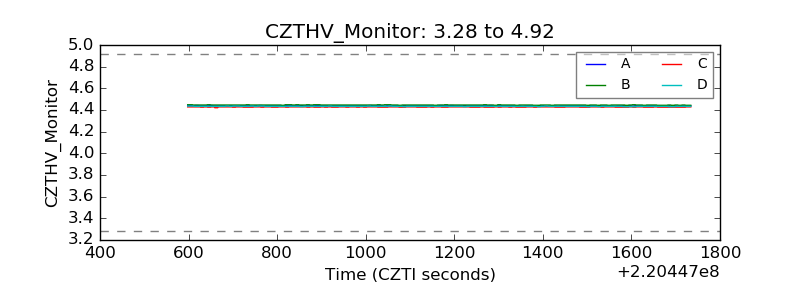 |
| D_VDD | 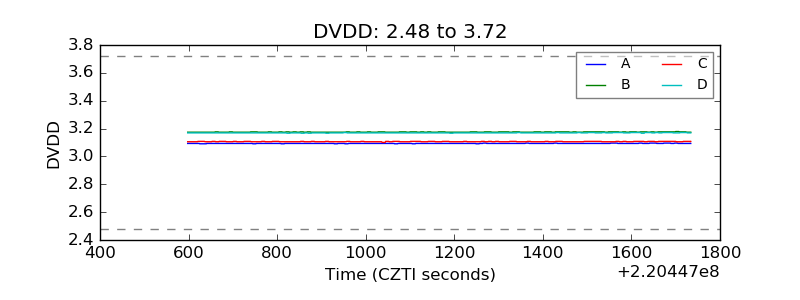 |
| Temperature 1 | 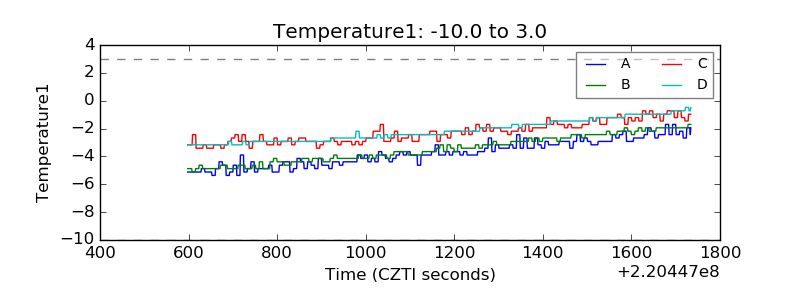 |
| Veto HV Monitor | 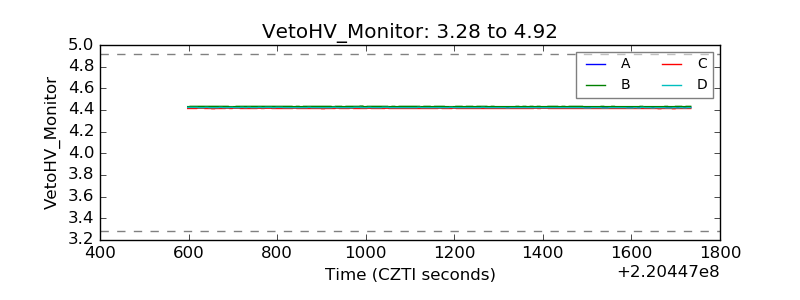 |
| Veto LLD | 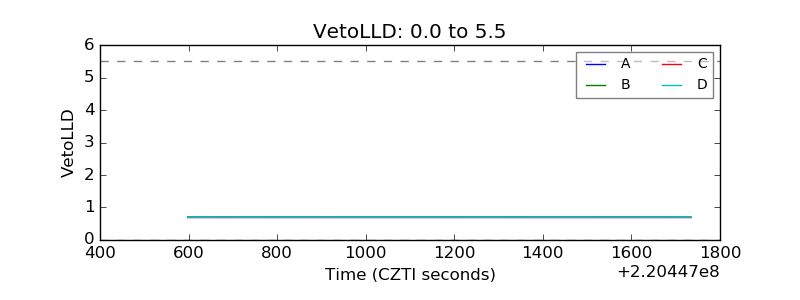 |
| Alpha Counter | 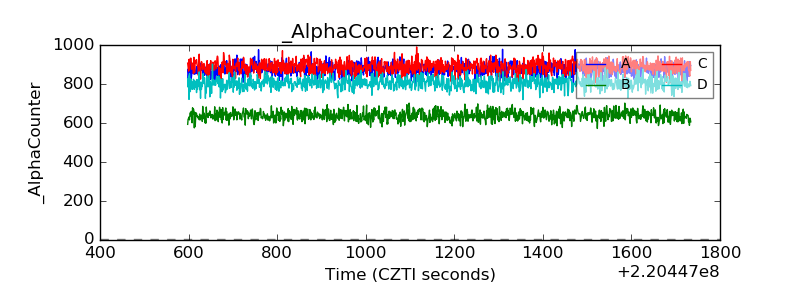 |
| _CPM_Rate | 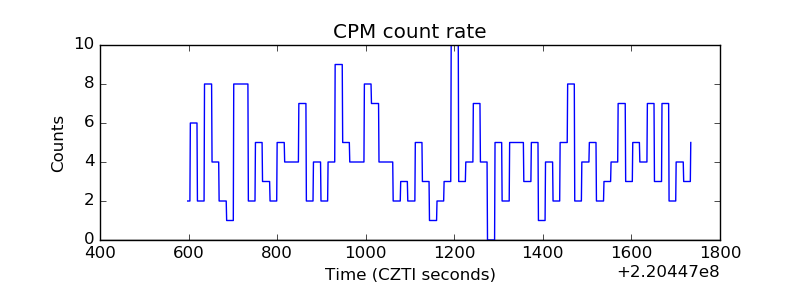 |
| CZT Counter | 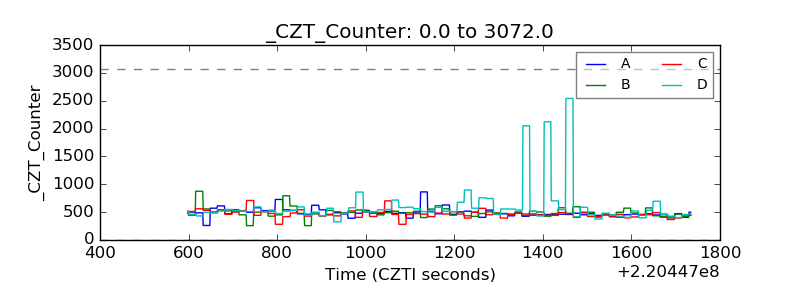 |
| +2.5 Volts monitor |  |
| +5 Volts monitor |  |
| _ROLL_ROT | 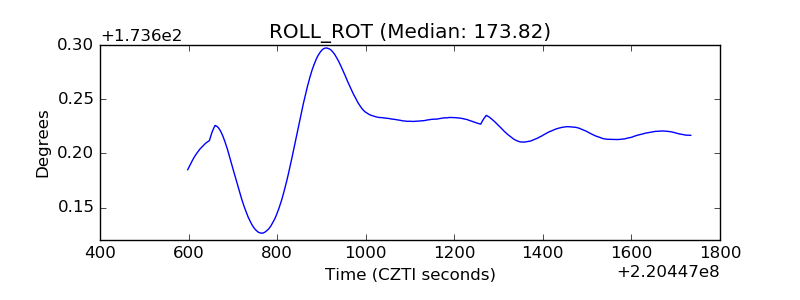 |
| _Roll_DEC | 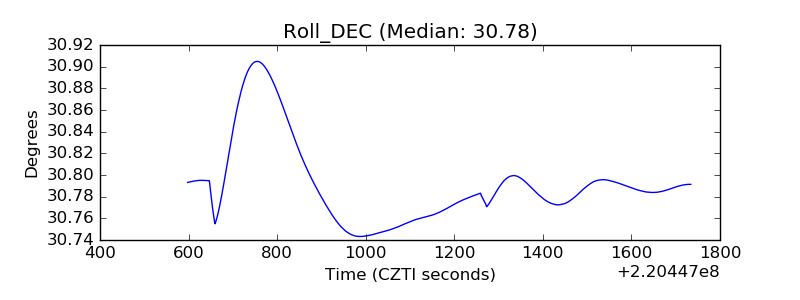 |
| _Roll_RA | 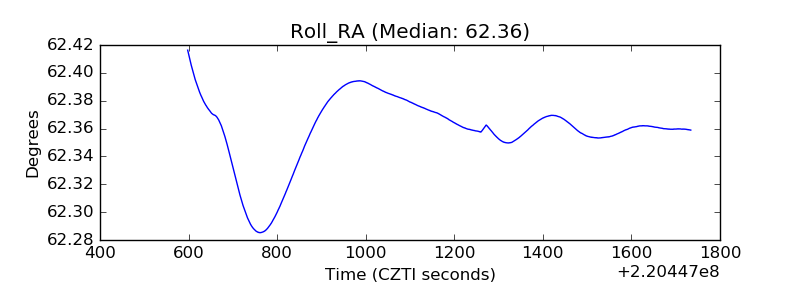 |
| Veto Counter | 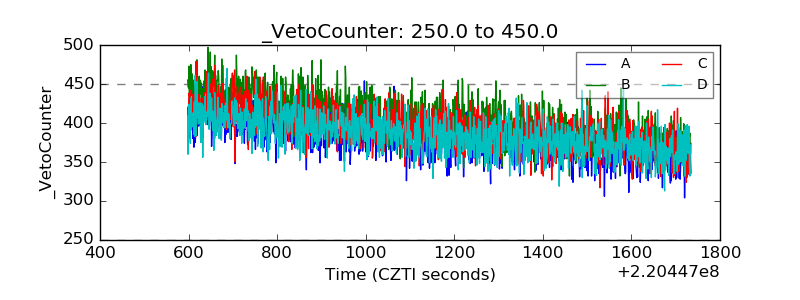 |