| Param | Original file | Final file |
|---|---|---|
| Filename | modeM0/AS1G06_066T01_9000000928_06740cztM0_level2.evt | modeM0/AS1G06_066T01_9000000928_06740cztM0_level2_quad_clean.evt |
| Size (bytes) | 481,896,000 | 82,512,000 |
| Size | 459.6 MB | 78.7 MB |
| Events in quadrant A | 3,400,663 | 522,538 |
| Events in quadrant B | 3,139,342 | 533,131 |
| Events in quadrant C | 2,889,126 | 520,608 |
| Events in quadrant D | 4,739,812 | 484,979 |
| Mode M9 | |||
|---|---|---|---|
| Quadrant | BADHDUFLAG | Total packets | Discarded packets |
| A | 0 | 11 | 0 |
| B | 0 | 11 | 0 |
| C | 0 | 11 | 0 |
| D | 0 | 11 | 0 |
| Mode SS | |||
|---|---|---|---|
| Quadrant | BADHDUFLAG | Total packets | Discarded packets |
| A | 0 | 124 | 0 |
| B | 0 | 124 | 0 |
| C | 0 | 124 | 0 |
| D | 0 | 124 | 0 |
| Mode M0 | |||
|---|---|---|---|
| Quadrant | BADHDUFLAG | Total packets | Discarded packets |
| A | 0 | 14221 | 1 |
| B | 0 | 13385 | 0 |
| C | 0 | 12865 | 0 |
| D | 0 | 18157 | 0 |
| Quadrant | Total seconds | Saturated seconds | Saturation percentage |
|---|---|---|---|
| A | 6277 | 156 | 2.485264% |
| B | 6277 | 100 | 1.593118% |
| C | 6277 | 56 | 0.892146% |
| D | 6277 | 303 | 4.827147% |
Noise dominated data is calculated using 1-second bins in cleaned event files. If a bin has >2000 counts, and if more than 50% of those come from <1% of pixels, then it is considered to be noise-dominated and hence unusable.
| Quadrant | # 1 sec bins | Bins with >0 counts | Bins with >2000 counts | High rate bins dominated by noise | Noise dominated (total time) | Noise dominated (detector-on time) | Marked lightcurve |
|---|---|---|---|---|---|---|---|
| A | 7287 | 6278 | 35 | 35 | 0.48% | 0.56% | 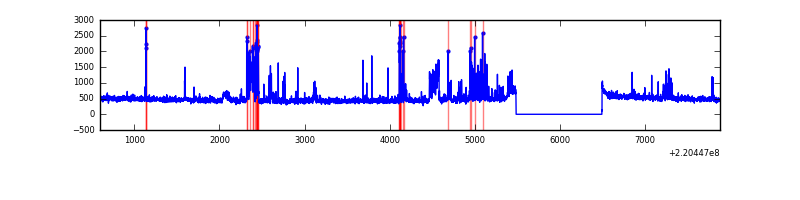 |
| B | 7287 | 6278 | 20 | 20 | 0.27% | 0.32% | 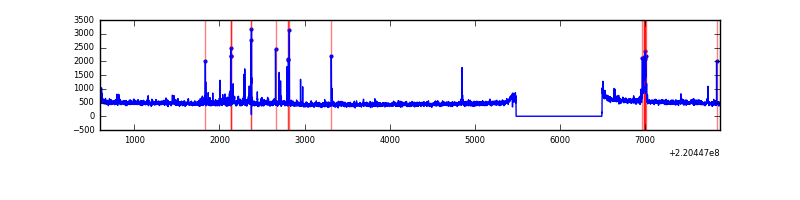 |
| C | 7287 | 6278 | 0 | 0 | 0.00% | 0.00% | 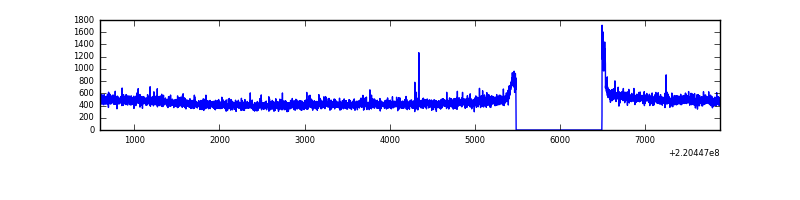 |
| D | 7287 | 6278 | 265 | 265 | 3.64% | 4.22% | 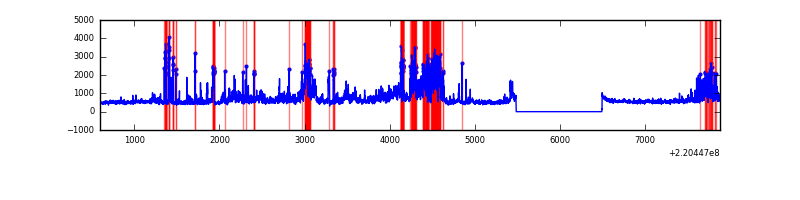 |
Top three noisy pixels from each quadrant. If the there are fewer than three noisy pixels in the level2.evt file, extra rows are filled as -1
| Pixel properties | Quadrant properties | ||||||
|---|---|---|---|---|---|---|---|
| Quadrant | DetID | PixID | Counts | Sigma | Mean | Median | Sigma |
| A | 14 | 111 | 465866 | 3079.49 | 742 | 725 | 151.0 |
| A | 8 | 15 | 32674 | 211.52 | 742 | 725 | 151.0 |
| A | 15 | 236 | 17670 | 112.19 | 742 | 725 | 151.0 |
| B | 3 | 220 | 63994 | 440.26 | 745 | 727 | 143.7 |
| B | 0 | 214 | 50389 | 345.58 | 745 | 727 | 143.7 |
| B | 4 | 48 | 44050 | 301.47 | 745 | 727 | 143.7 |
| C | 9 | 16 | 69282 | 410.33 | 715 | 718 | 167.1 |
| C | 9 | 247 | 17381 | 99.72 | 715 | 718 | 167.1 |
| C | 12 | 4 | 6187 | 32.73 | 715 | 718 | 167.1 |
| D | 2 | 33 | 600297 | 3423.93 | 712 | 691 | 175.1 |
| D | 7 | 203 | 407871 | 2325.12 | 712 | 691 | 175.1 |
| D | 8 | 195 | 356530 | 2031.95 | 712 | 691 | 175.1 |
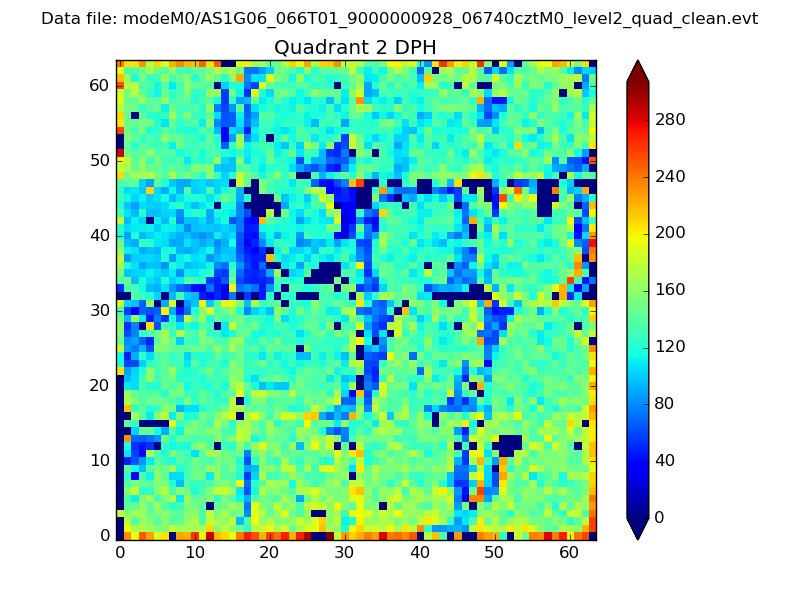
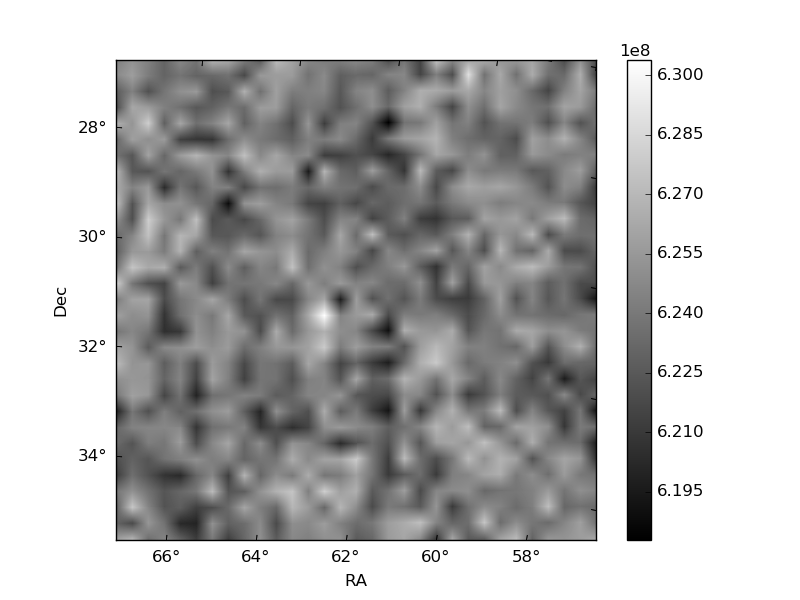
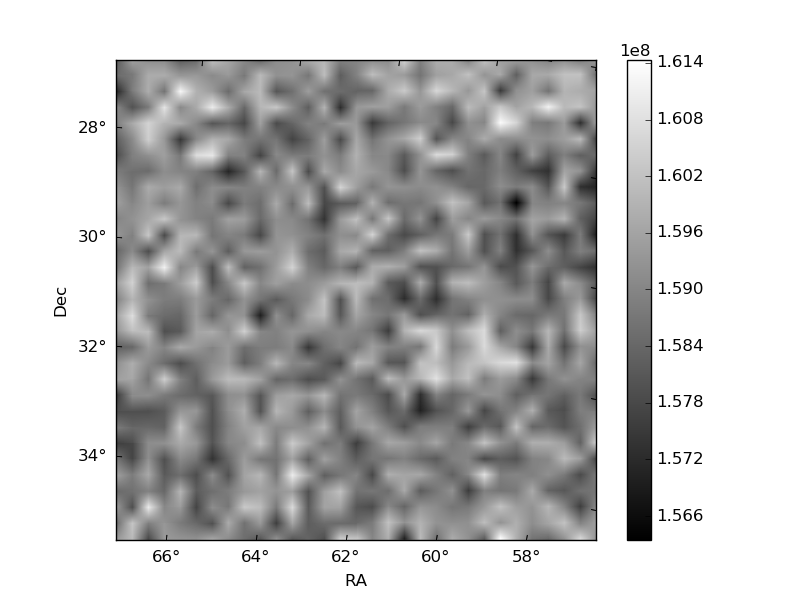
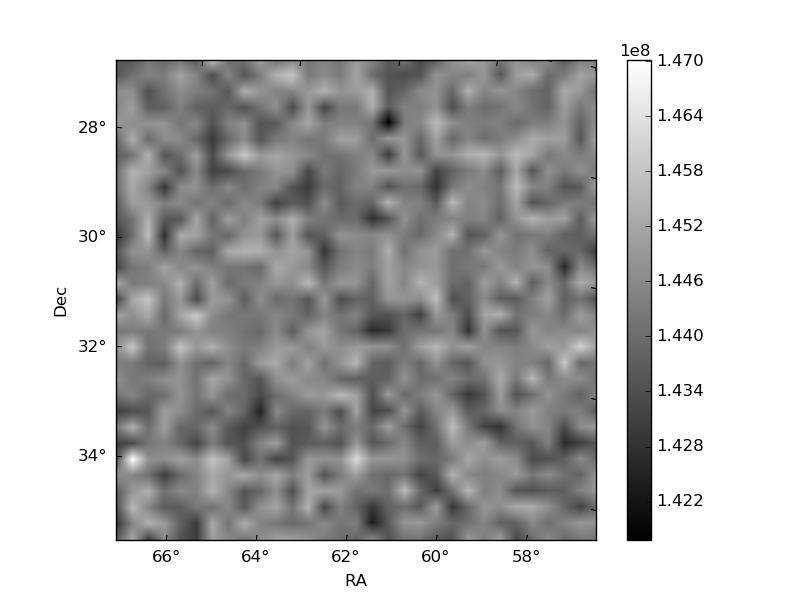
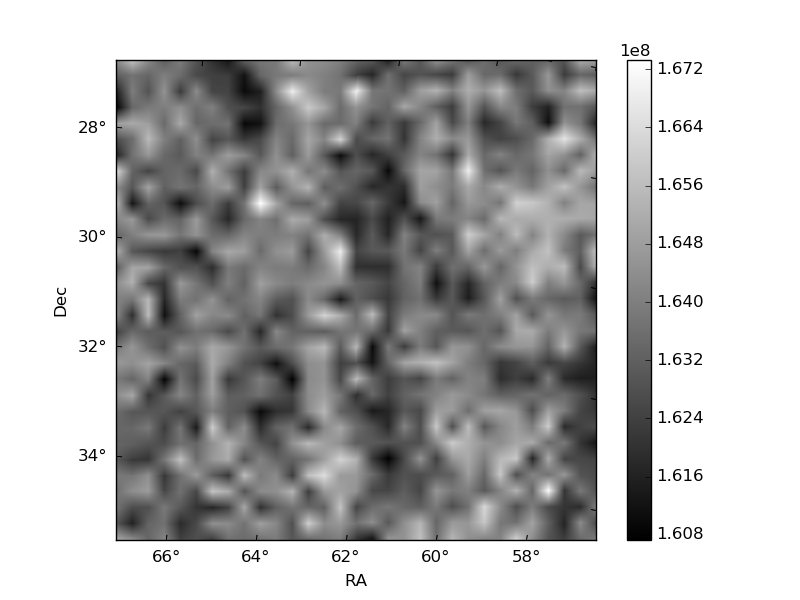
Histogram calculated using DETX and DETY for each event in the final _common_clean file
| Quadrant A | 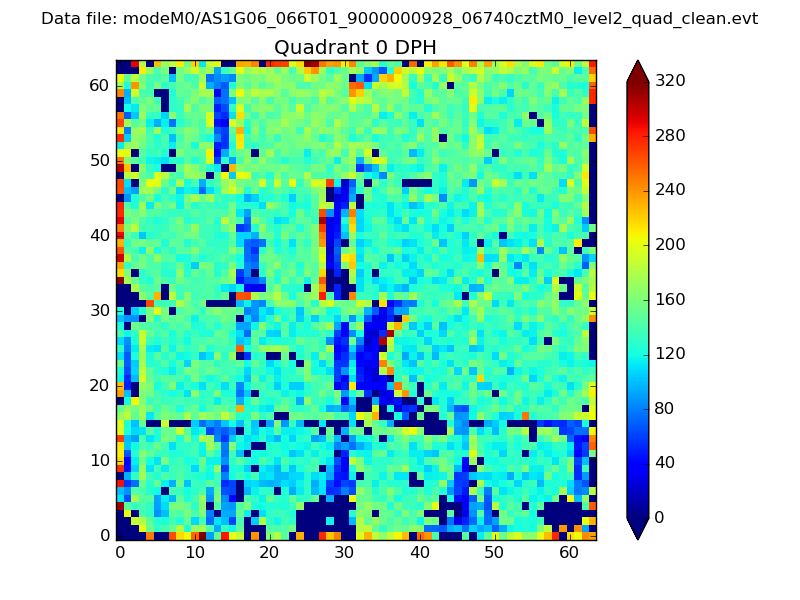 |
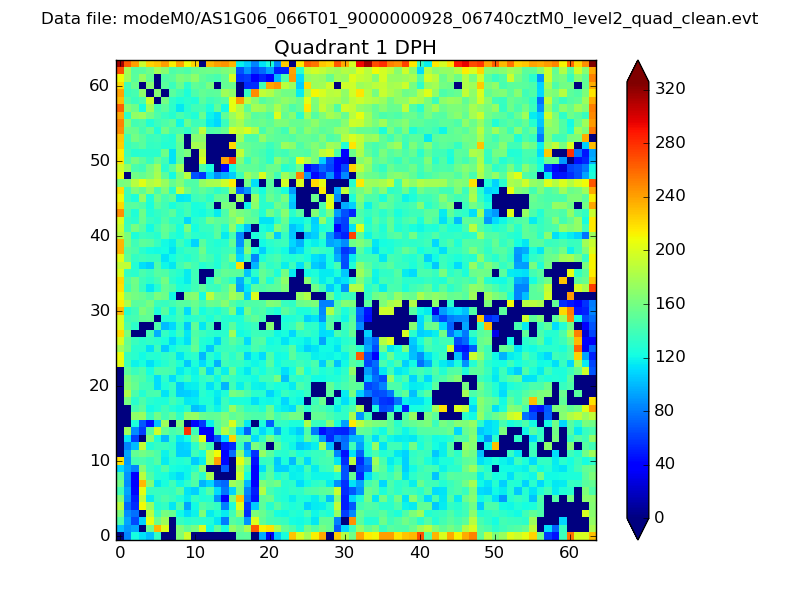 |
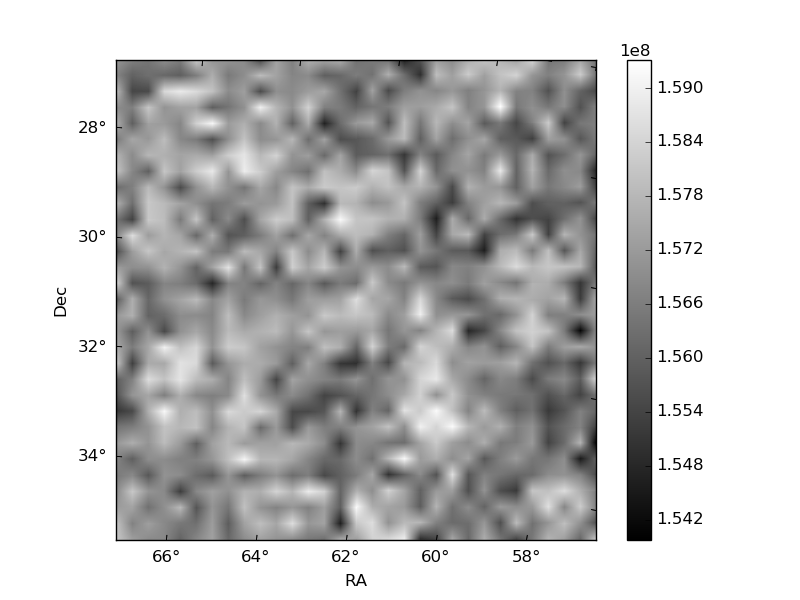
Quadrant B |
|---|---|---|---|
| Quadrant D | 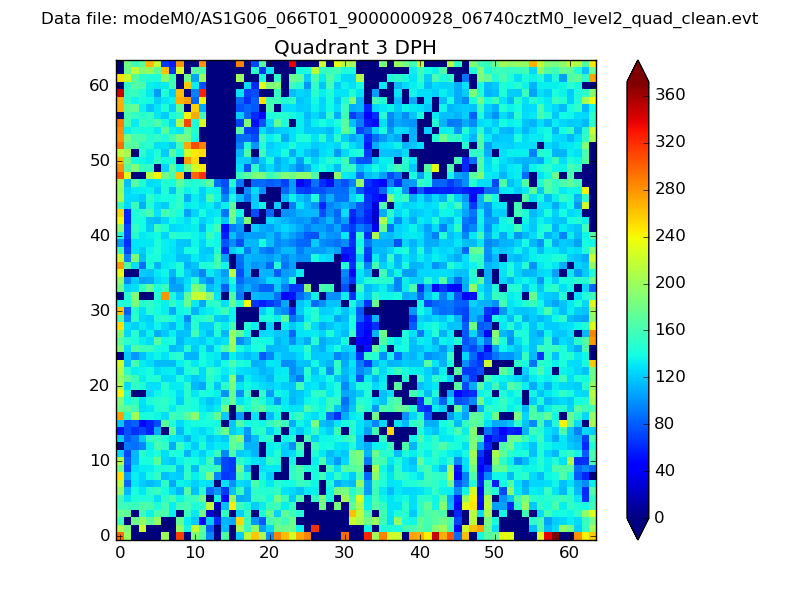 |
 |
Quadrant C |
| Plot type | Count rate plots | Images |
|---|---|---|
| Comparison with Poisson distribution Blue bars denote a histogram of data divided into 1 sec bins. Red curve is a Poisson curve with rate = median count rate of data. |
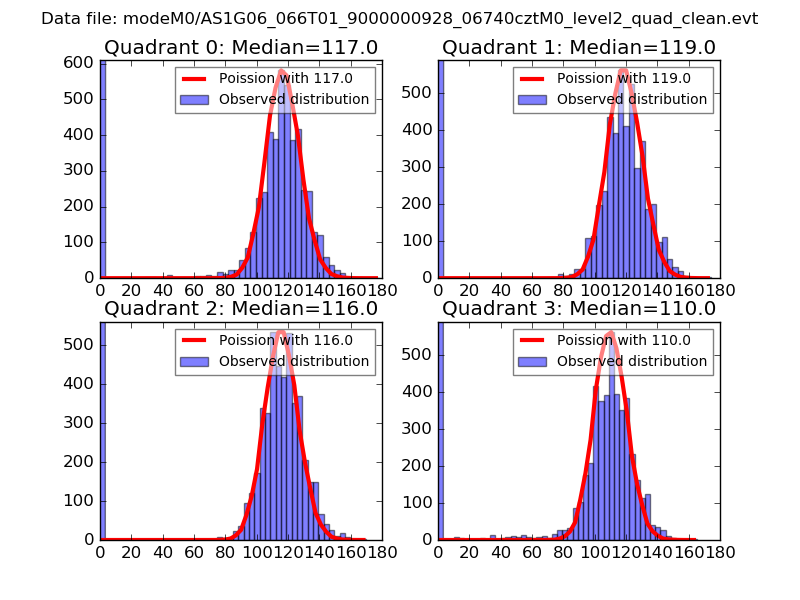 |
 |
| Quadrant-wise count rates Data is divided into 100 sec bins |
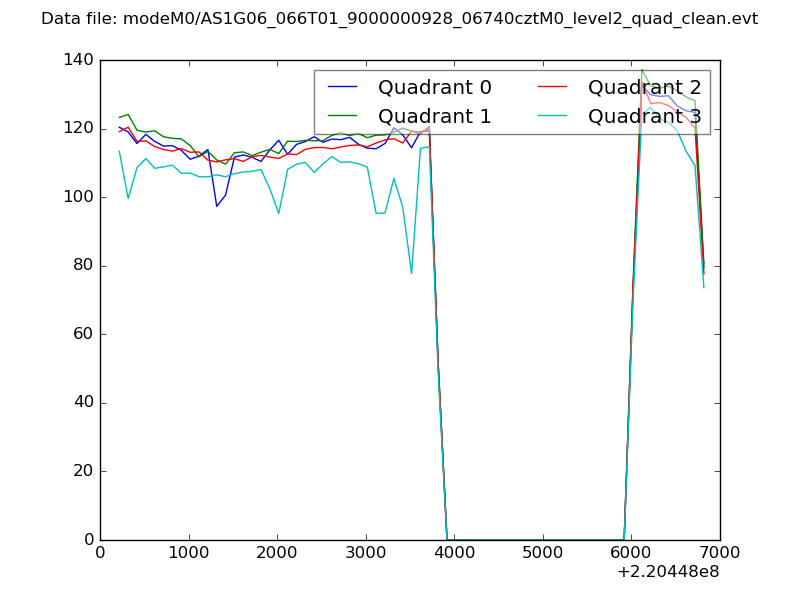 |
|
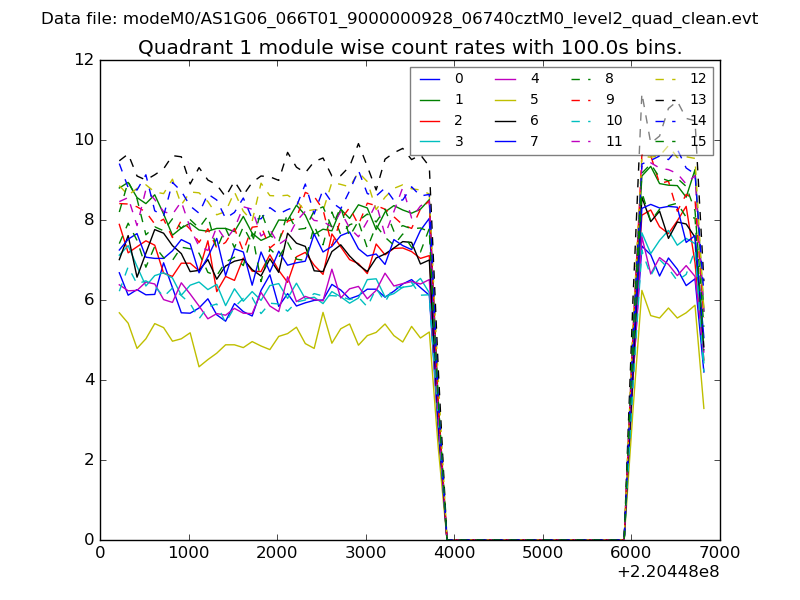
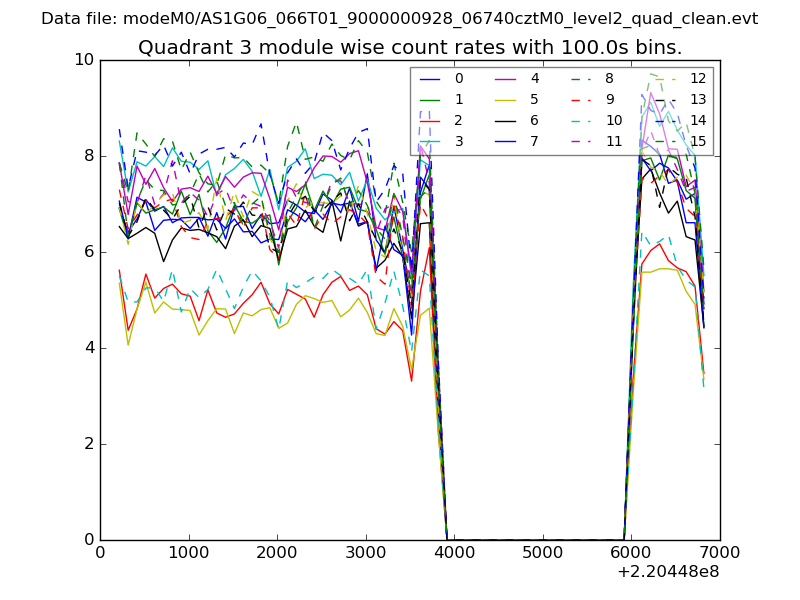
| Module-wise count rates for Quadrant A Data is divided into 100 sec bins |
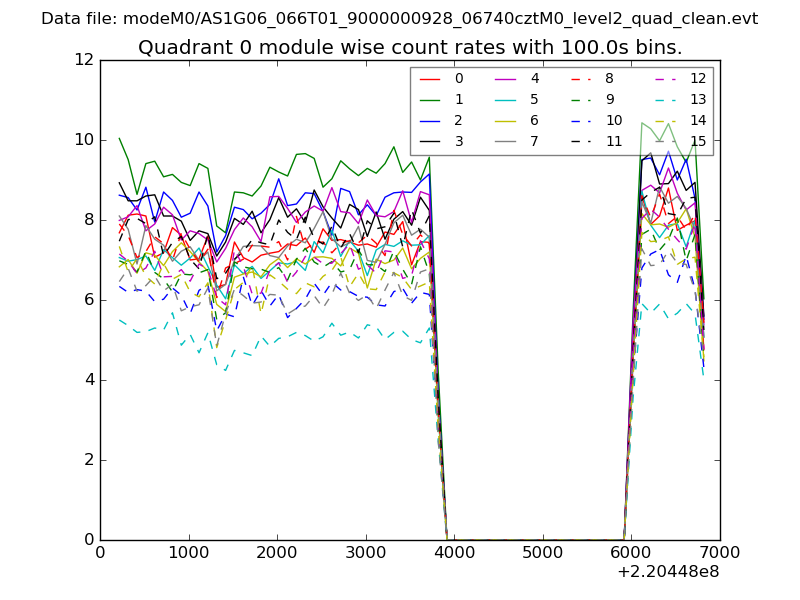 |
 |
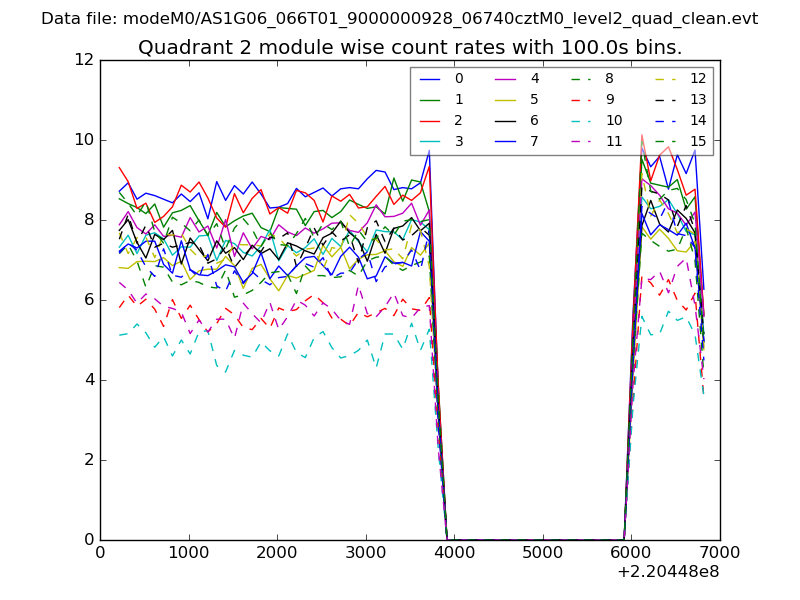
| Module-wise count rates for Quadrant B Data is divided into 100 sec bins |
 |
 |
| Module-wise count rates for Quadrant C Data is divided into 100 sec bins |
 |
 |
| Module-wise count rates for Quadrant D Data is divided into 100 sec bins |
 |
 |
| Parameter | Plot |
|---|---|
| CZT HV Monitor | 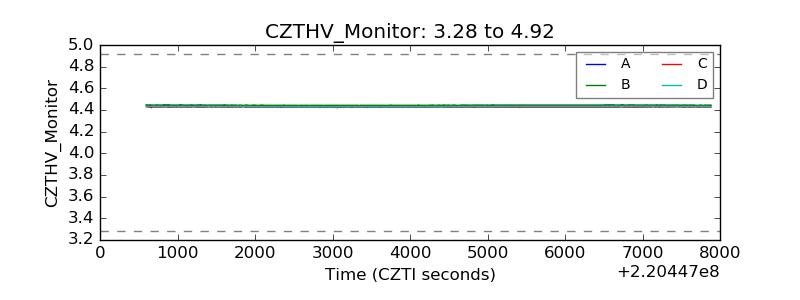 |
| D_VDD | 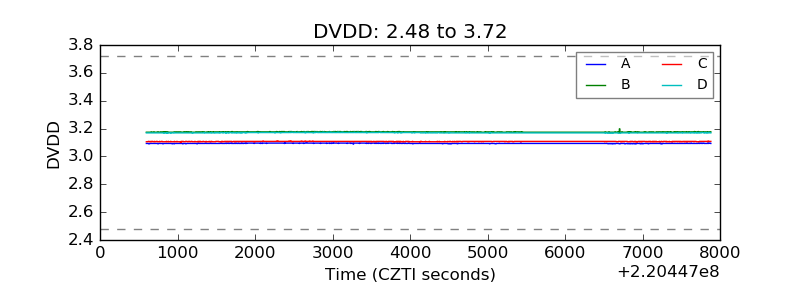 |
| Temperature 1 | 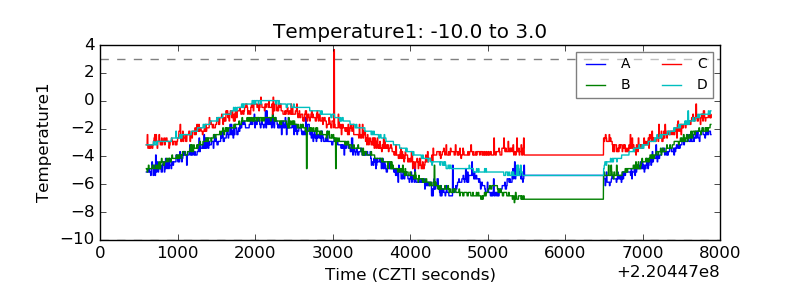 |
| Veto HV Monitor | 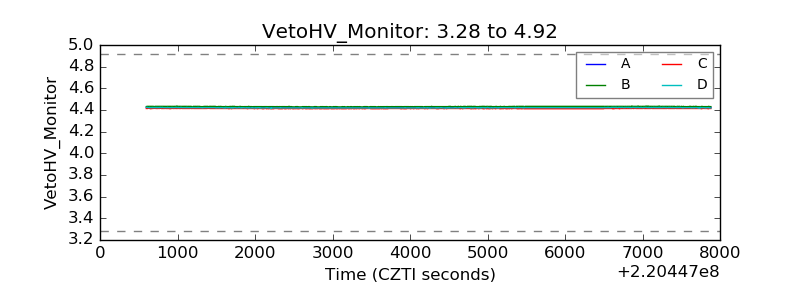 |
| Veto LLD | 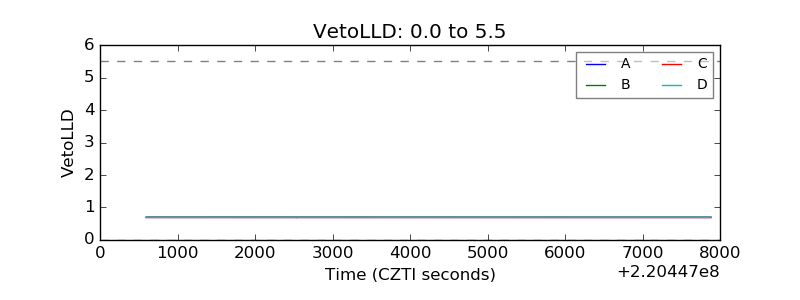 |
| Alpha Counter | 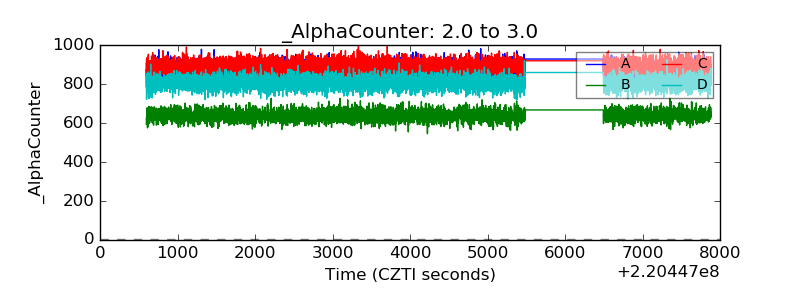 |
| _CPM_Rate | 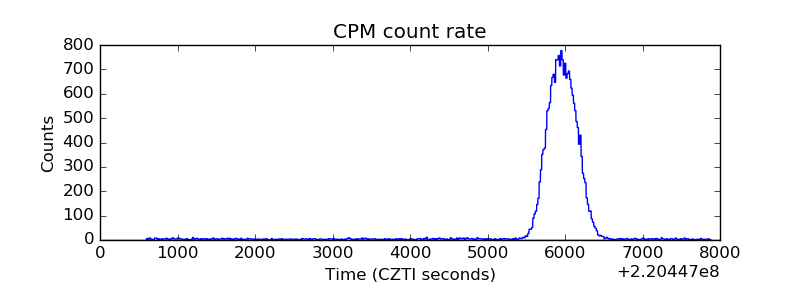 |
| CZT Counter | 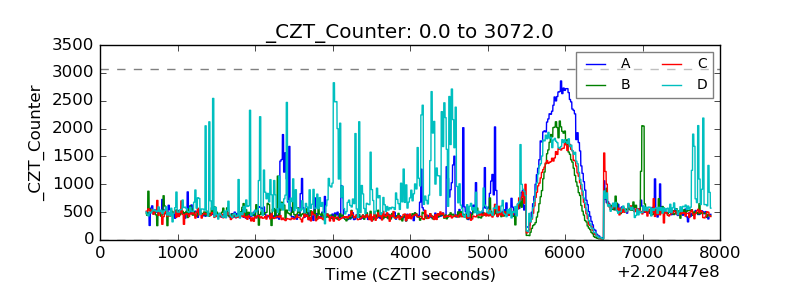 |
| +2.5 Volts monitor | 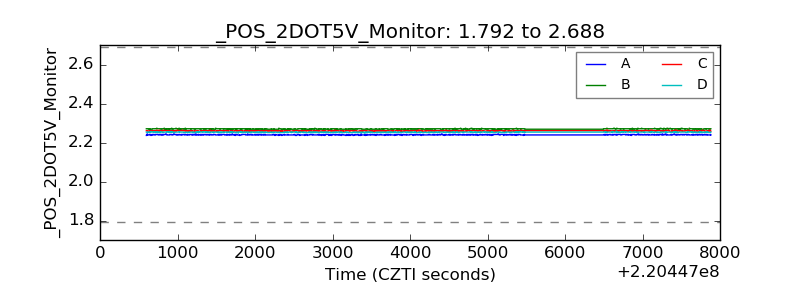 |
| +5 Volts monitor | 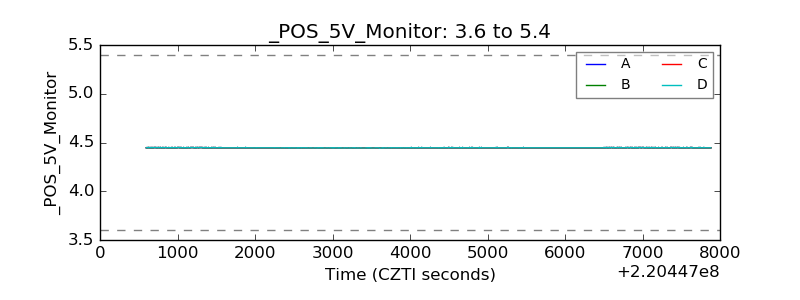 |
| _ROLL_ROT | 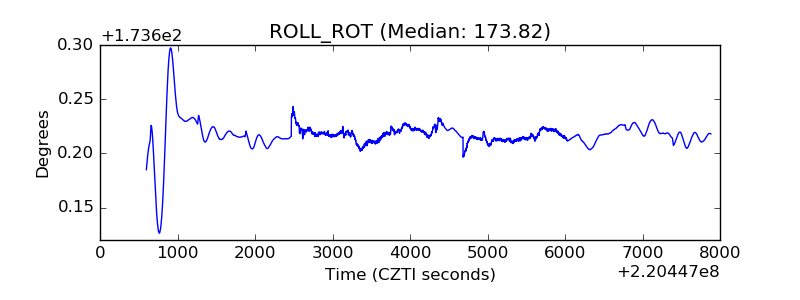 |
| _Roll_DEC | 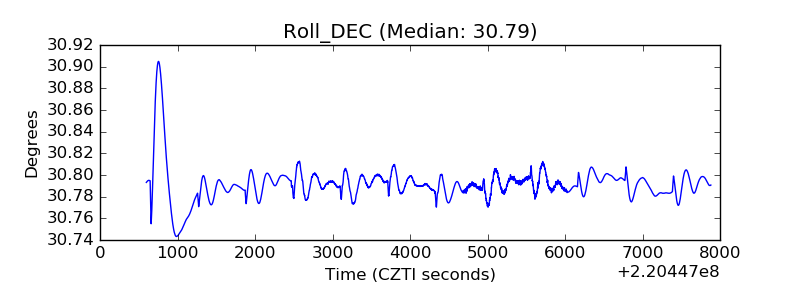 |
| _Roll_RA | 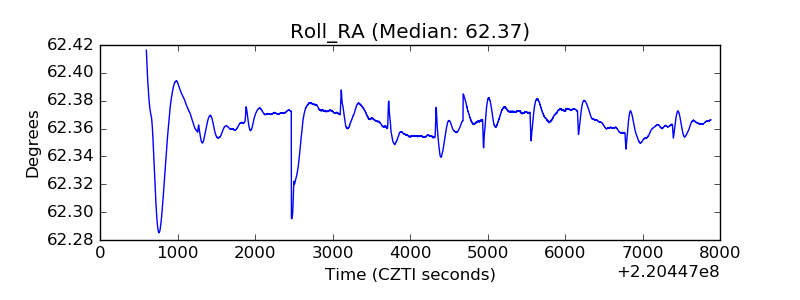 |
| Veto Counter | 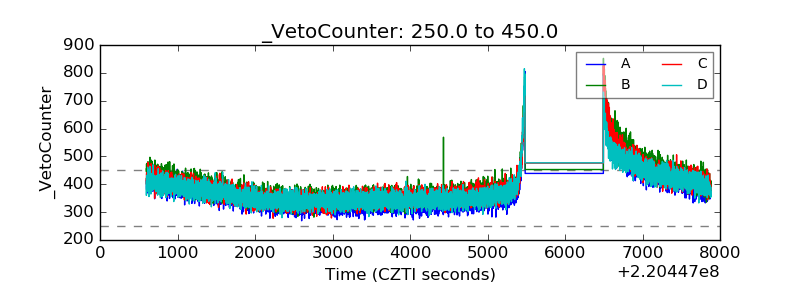 |