| Param | Original file | Final file |
|---|---|---|
| Filename | modeM0/AS1G06_066T01_9000000928_06742cztM0_level2.evt | modeM0/AS1G06_066T01_9000000928_06742cztM0_level2_quad_clean.evt |
| Size (bytes) | 251,729,280 | 44,740,800 |
| Size | 240.1 MB | 42.7 MB |
| Events in quadrant A | 1,557,071 | 291,059 |
| Events in quadrant B | 1,594,246 | 294,144 |
| Events in quadrant C | 1,523,007 | 285,494 |
| Events in quadrant D | 2,738,288 | 264,275 |
| Mode M9 | |||
|---|---|---|---|
| Quadrant | BADHDUFLAG | Total packets | Discarded packets |
| A | 0 | 11 | 0 |
| B | 0 | 11 | 0 |
| C | 0 | 11 | 0 |
| D | 0 | 11 | 0 |
| Mode SS | |||
|---|---|---|---|
| Quadrant | BADHDUFLAG | Total packets | Discarded packets |
| A | 0 | 62 | 0 |
| B | 0 | 62 | 0 |
| C | 0 | 62 | 0 |
| D | 0 | 62 | 0 |
| Mode M0 | |||
|---|---|---|---|
| Quadrant | BADHDUFLAG | Total packets | Discarded packets |
| A | 0 | 6699 | 0 |
| B | 0 | 6759 | 0 |
| C | 0 | 6460 | 0 |
| D | 0 | 10161 | 0 |
| Quadrant | Total seconds | Saturated seconds | Saturation percentage |
|---|---|---|---|
| A | 3086 | 80 | 2.592353% |
| B | 3086 | 87 | 2.819183% |
| C | 3086 | 55 | 1.782242% |
| D | 3086 | 263 | 8.522359% |
Noise dominated data is calculated using 1-second bins in cleaned event files. If a bin has >2000 counts, and if more than 50% of those come from <1% of pixels, then it is considered to be noise-dominated and hence unusable.
| Quadrant | # 1 sec bins | Bins with >0 counts | Bins with >2000 counts | High rate bins dominated by noise | Noise dominated (total time) | Noise dominated (detector-on time) | Marked lightcurve |
|---|---|---|---|---|---|---|---|
| A | 4096 | 3087 | 9 | 9 | 0.22% | 0.29% | 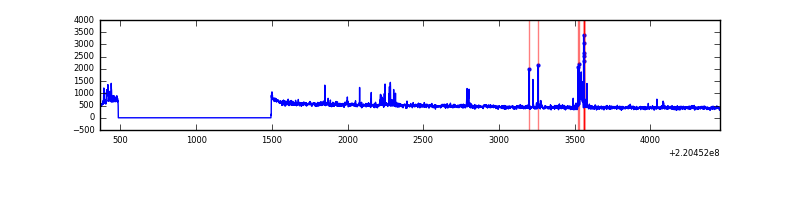 |
| B | 4096 | 3087 | 12 | 12 | 0.29% | 0.39% | 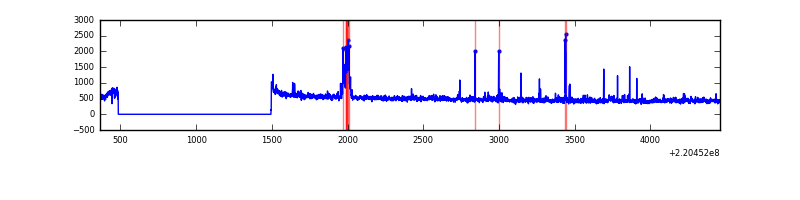 |
| C | 4096 | 3087 | 0 | 0 | 0.00% | 0.00% | 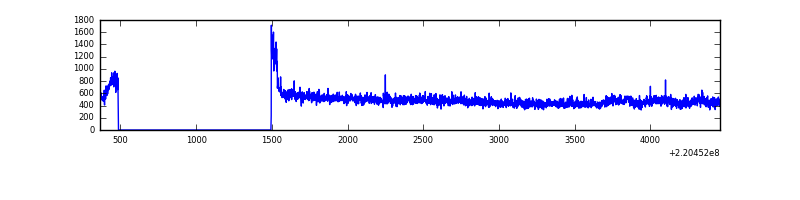 |
| D | 4096 | 3087 | 208 | 208 | 5.08% | 6.74% | 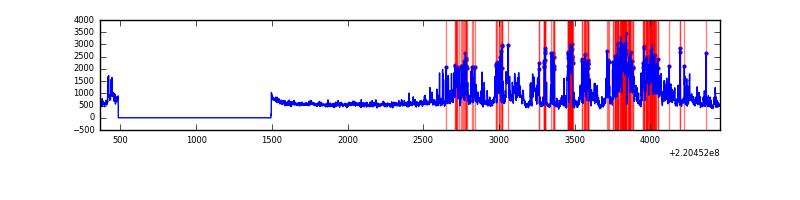 |
Top three noisy pixels from each quadrant. If the there are fewer than three noisy pixels in the level2.evt file, extra rows are filled as -1
| Pixel properties | Quadrant properties | ||||||
|---|---|---|---|---|---|---|---|
| Quadrant | DetID | PixID | Counts | Sigma | Mean | Median | Sigma |
| A | 14 | 111 | 67408 | 866.84 | 377 | 368 | 77.3 |
| A | 8 | 15 | 30971 | 395.7 | 377 | 368 | 77.3 |
| A | 4 | 2 | 7915 | 97.58 | 377 | 368 | 77.3 |
| B | 3 | 220 | 63037 | 859.98 | 374 | 365 | 72.9 |
| B | 0 | 214 | 23391 | 315.96 | 374 | 365 | 72.9 |
| B | 0 | 219 | 16383 | 219.8 | 374 | 365 | 72.9 |
| C | 9 | 16 | 62708 | 736.29 | 359 | 359 | 84.7 |
| C | 9 | 247 | 58545 | 687.13 | 359 | 359 | 84.7 |
| C | 13 | 61 | 2768 | 28.45 | 359 | 359 | 84.7 |
| D | 2 | 33 | 575797 | 6492.74 | 359 | 346 | 88.6 |
| D | 2 | 152 | 359616 | 4053.6 | 359 | 346 | 88.6 |
| D | 14 | 34 | 198067 | 2230.86 | 359 | 346 | 88.6 |
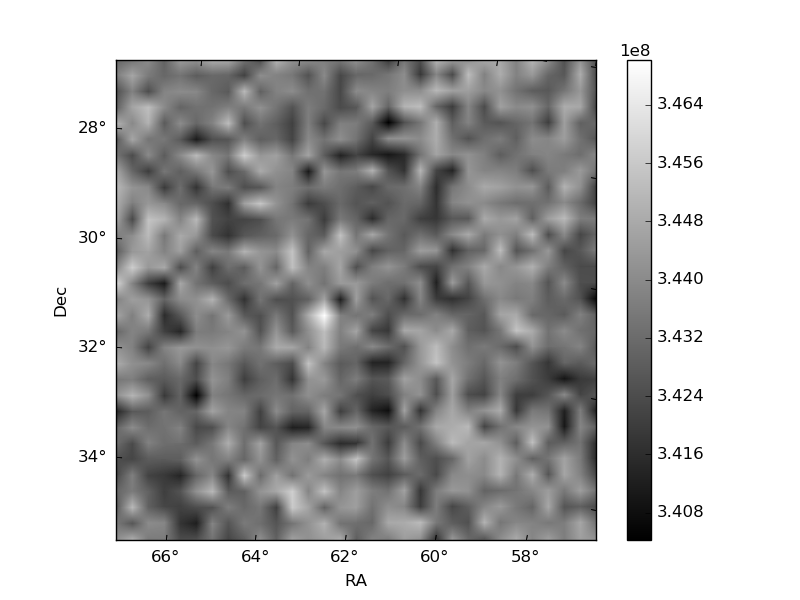
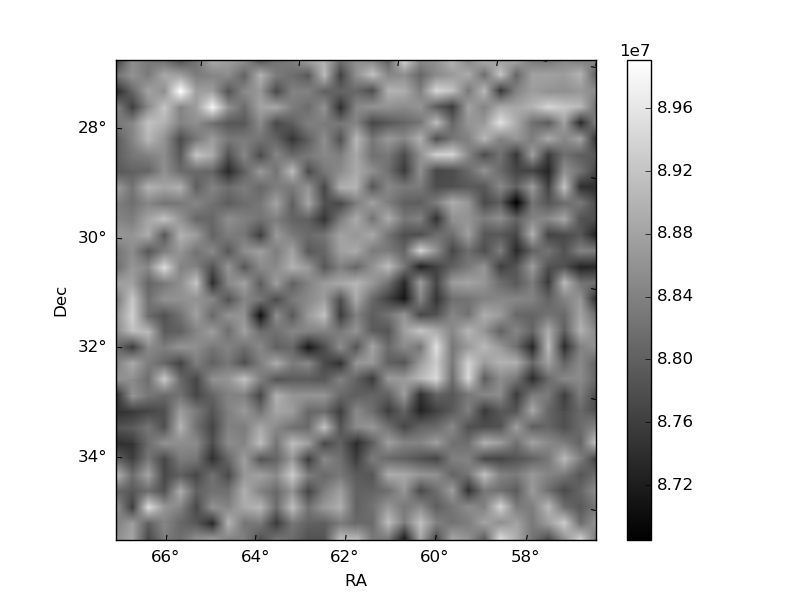
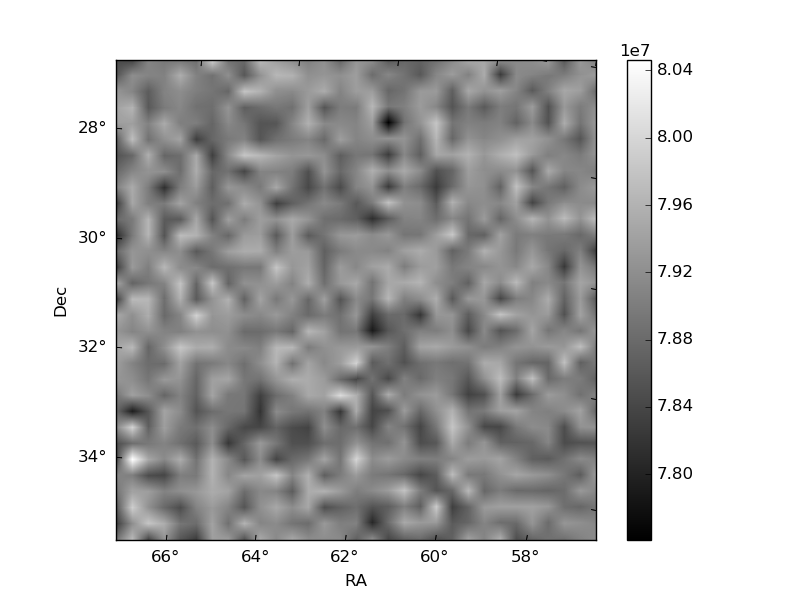
Histogram calculated using DETX and DETY for each event in the final _common_clean file
| Quadrant A | 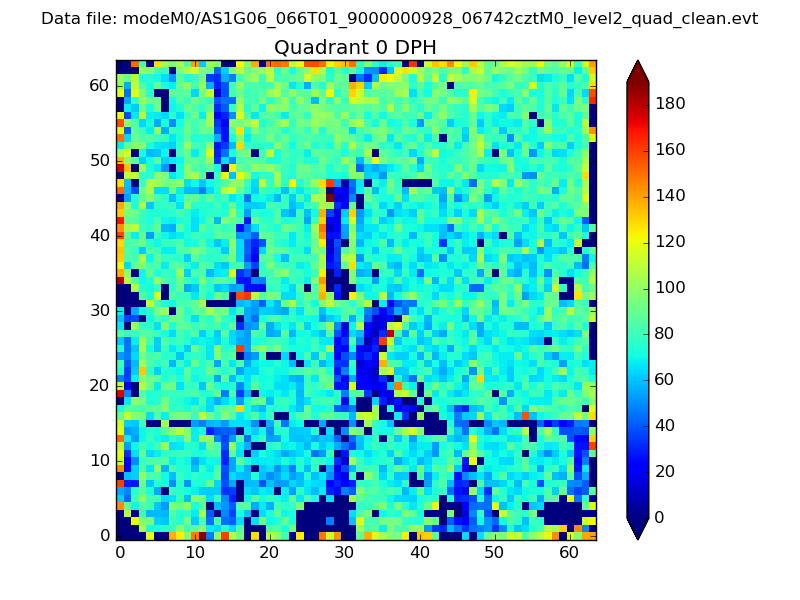 |
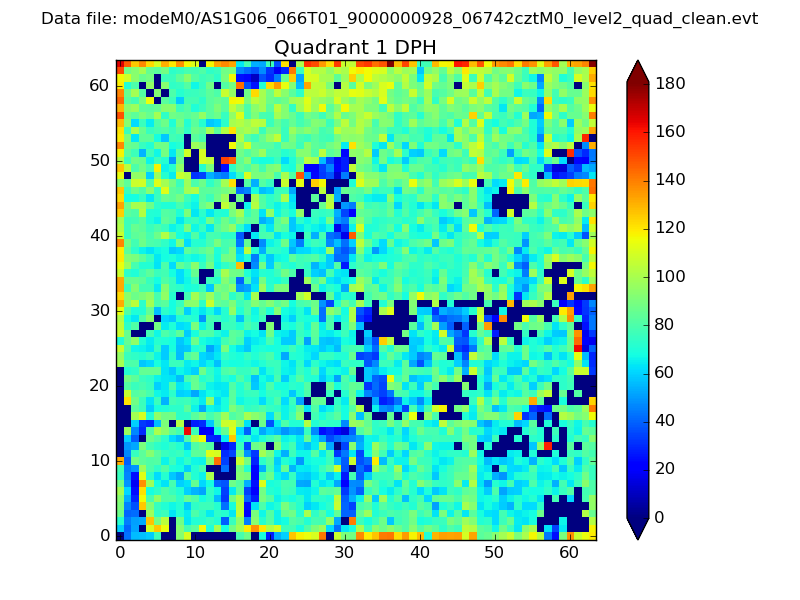 |
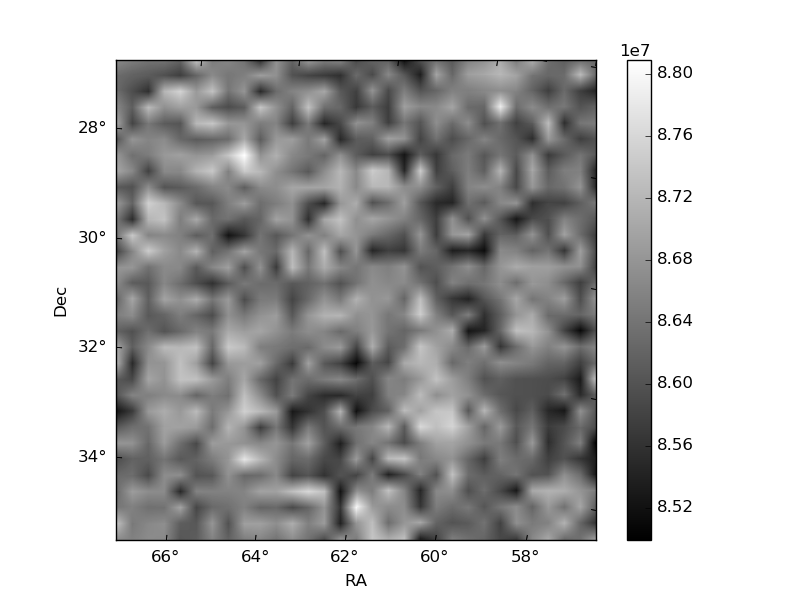
Quadrant B |
|---|---|---|---|
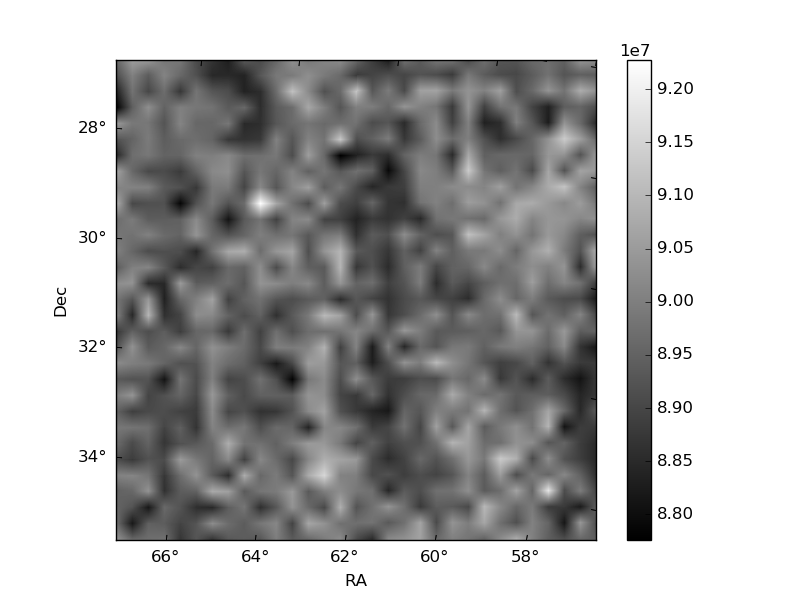
| Quadrant D | 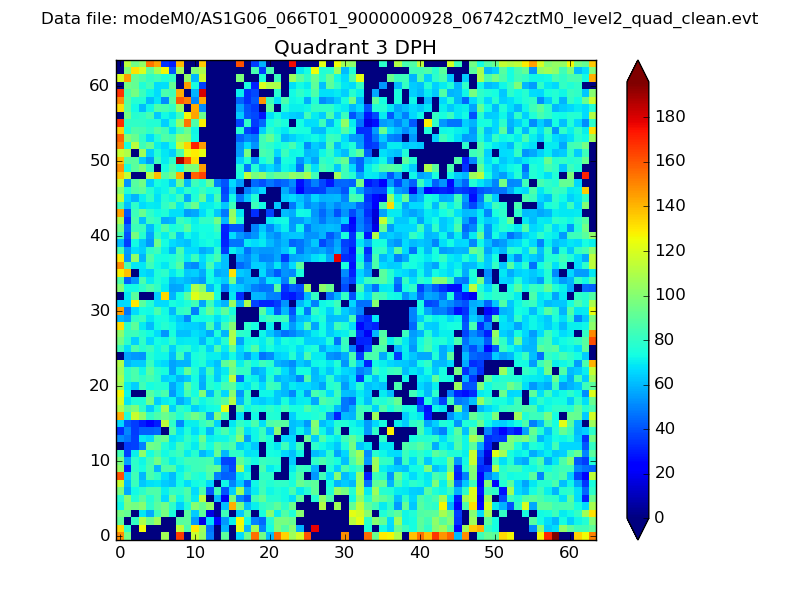 |
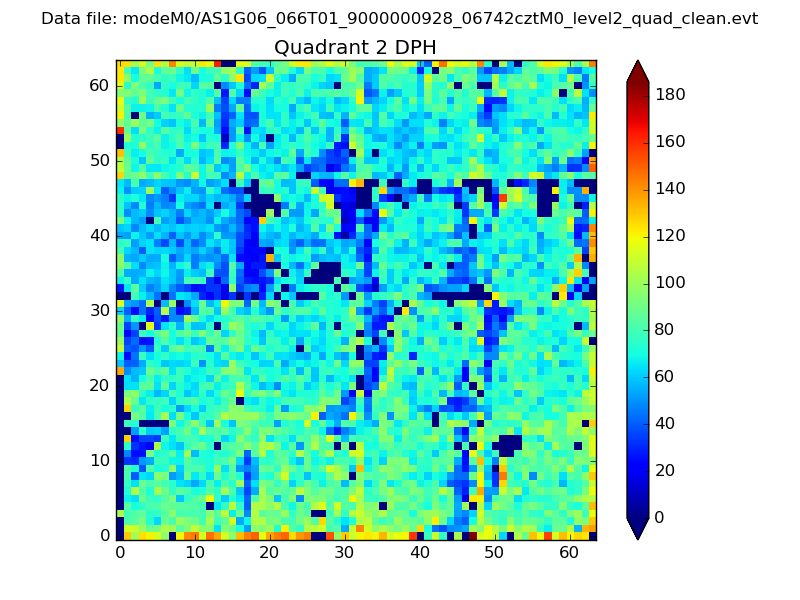 |
Quadrant C |
| Plot type | Count rate plots | Images |
|---|---|---|
| Comparison with Poisson distribution Blue bars denote a histogram of data divided into 1 sec bins. Red curve is a Poisson curve with rate = median count rate of data. |
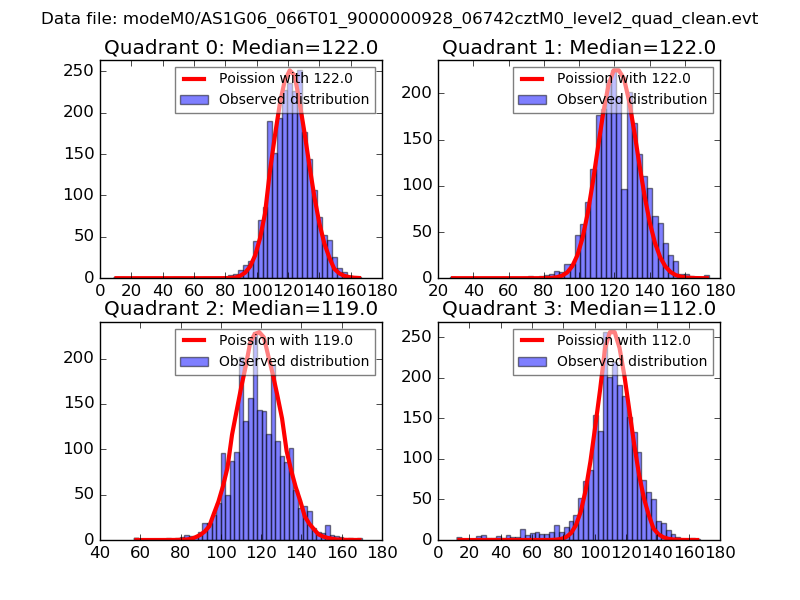 |
 |
| Quadrant-wise count rates Data is divided into 100 sec bins |
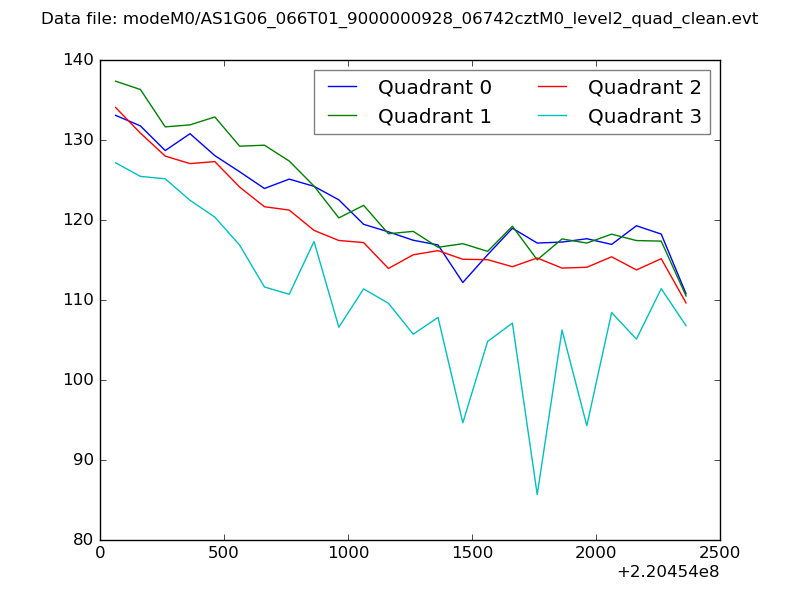 |
|
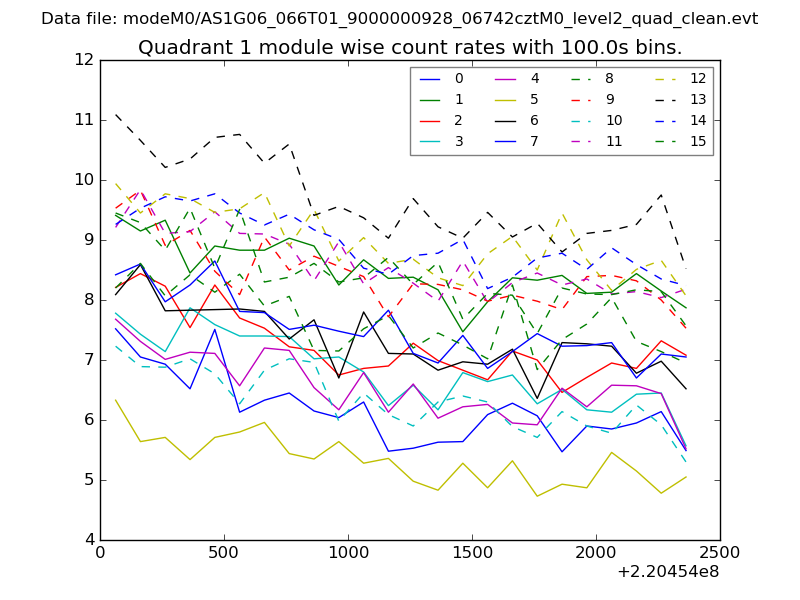
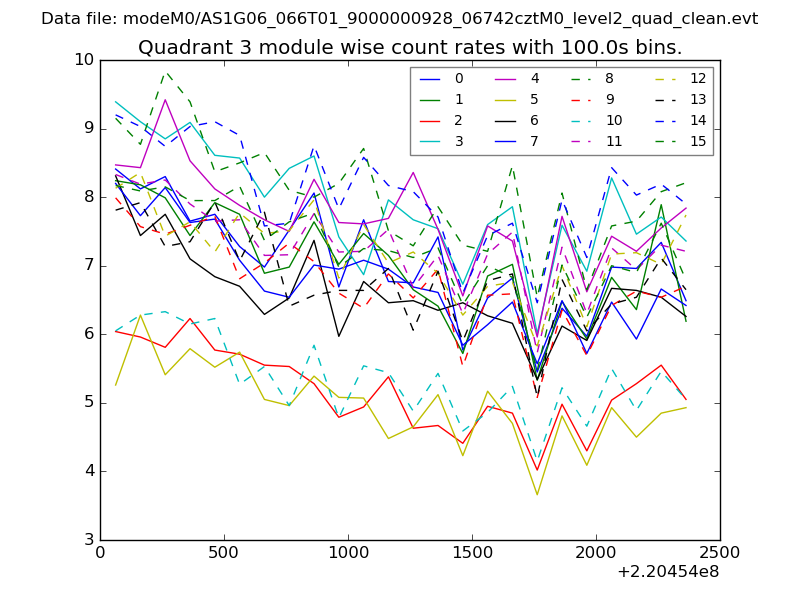
| Module-wise count rates for Quadrant A Data is divided into 100 sec bins |
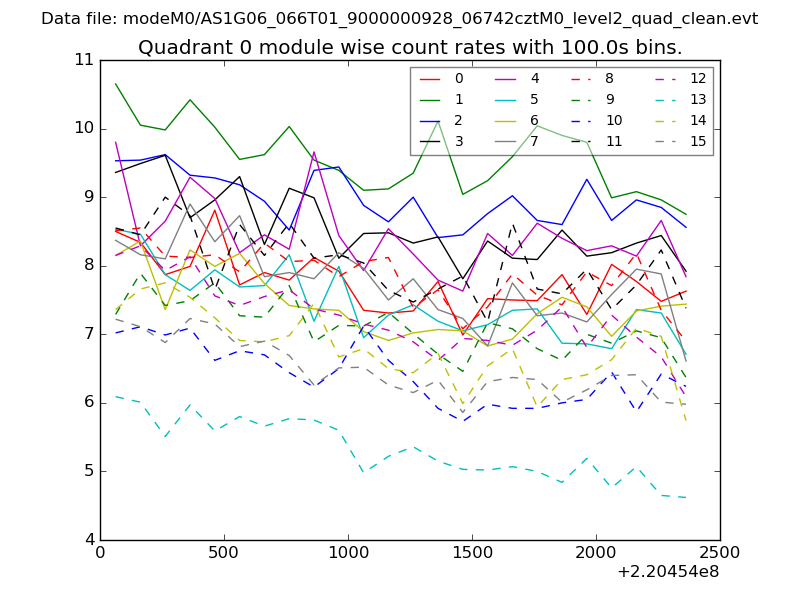 |
 |
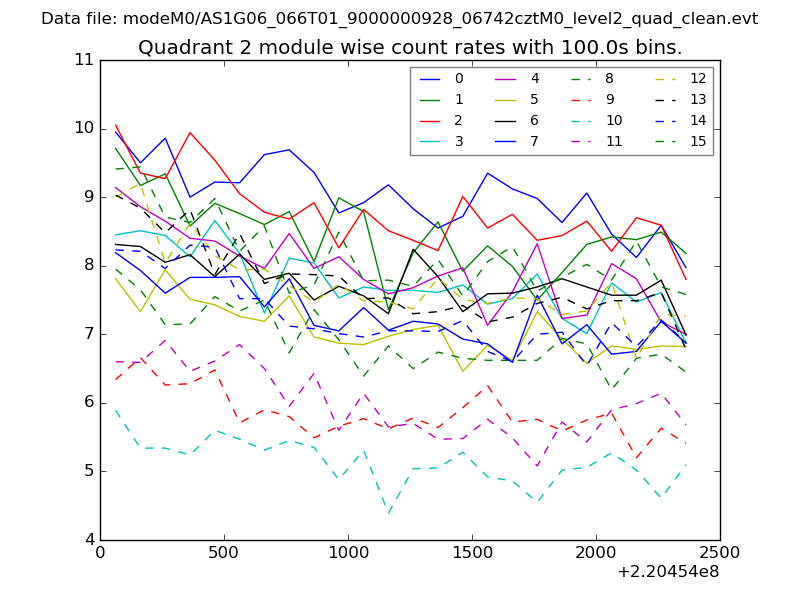
| Module-wise count rates for Quadrant B Data is divided into 100 sec bins |
 |
 |
| Module-wise count rates for Quadrant C Data is divided into 100 sec bins |
 |
 |
| Module-wise count rates for Quadrant D Data is divided into 100 sec bins |
 |
 |
| Parameter | Plot |
|---|---|
| CZT HV Monitor | 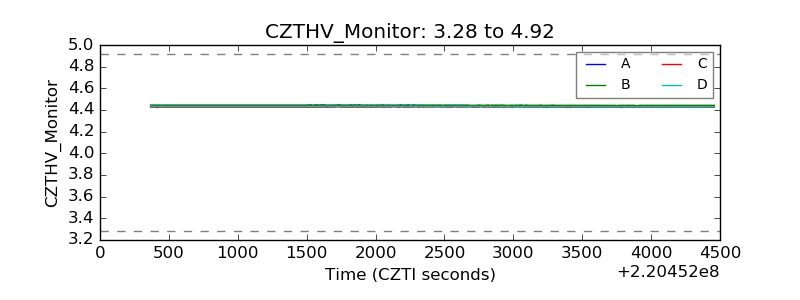 |
| D_VDD | 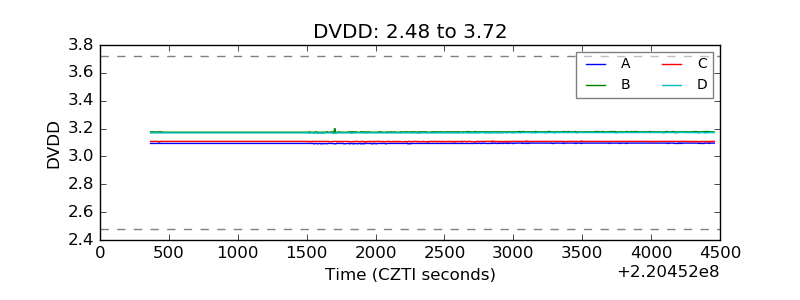 |
| Temperature 1 | 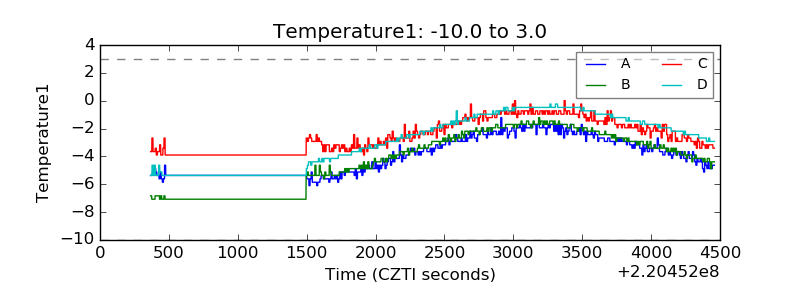 |
| Veto HV Monitor | 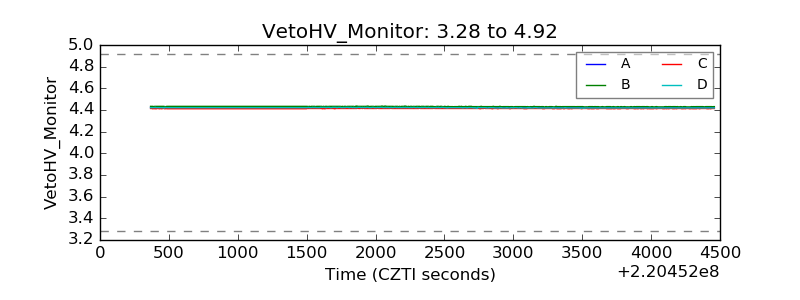 |
| Veto LLD | 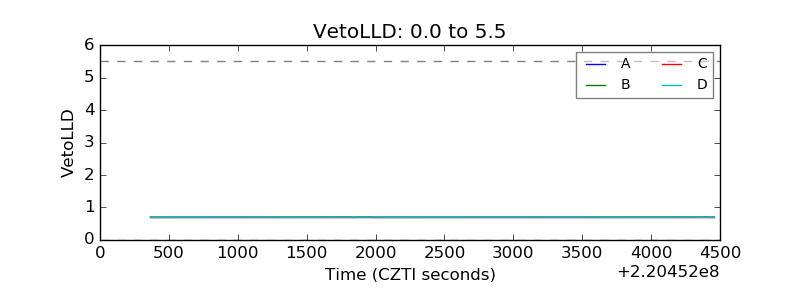 |
| Alpha Counter | 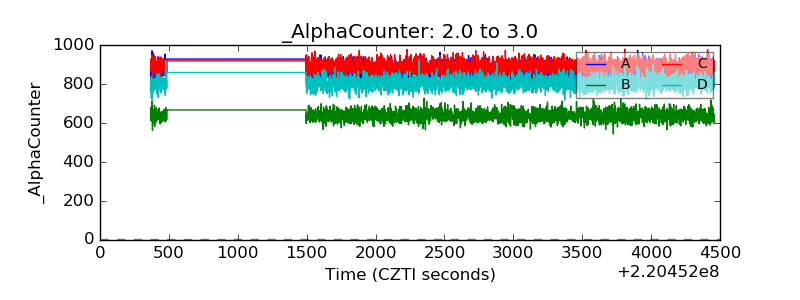 |
| _CPM_Rate | 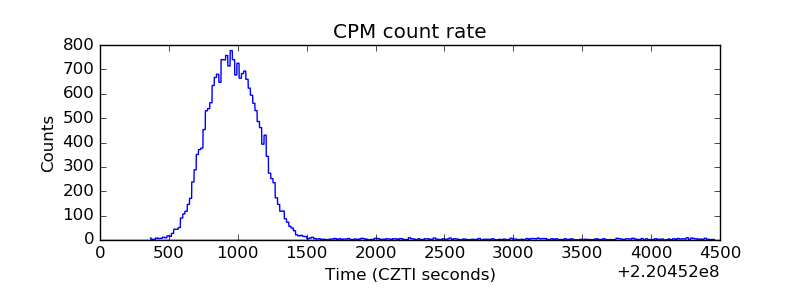 |
| CZT Counter | 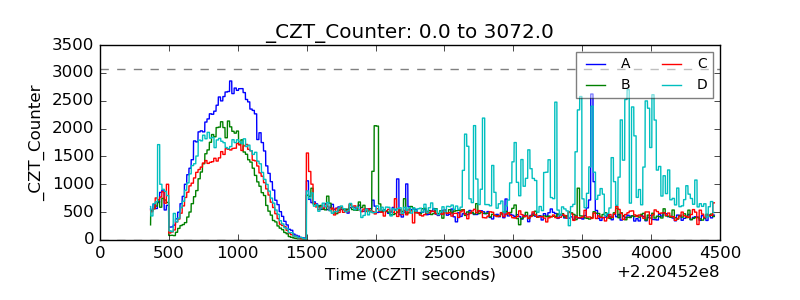 |
| +2.5 Volts monitor | 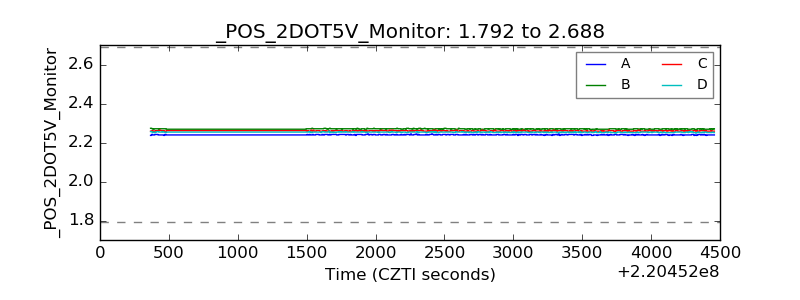 |
| +5 Volts monitor | 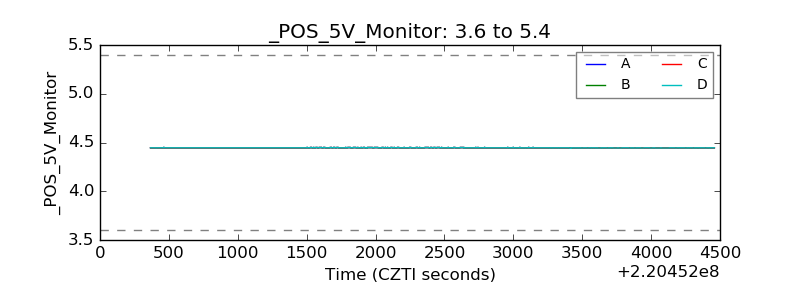 |
| _ROLL_ROT | 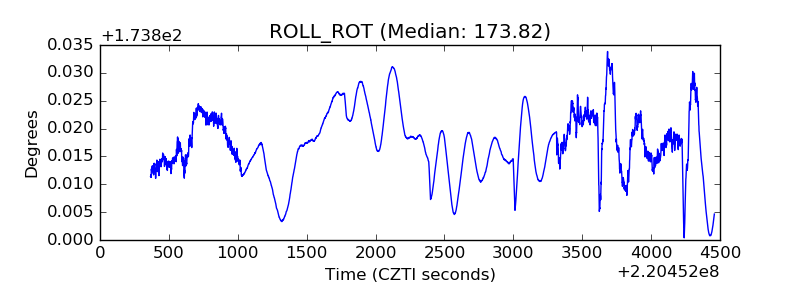 |
| _Roll_DEC | 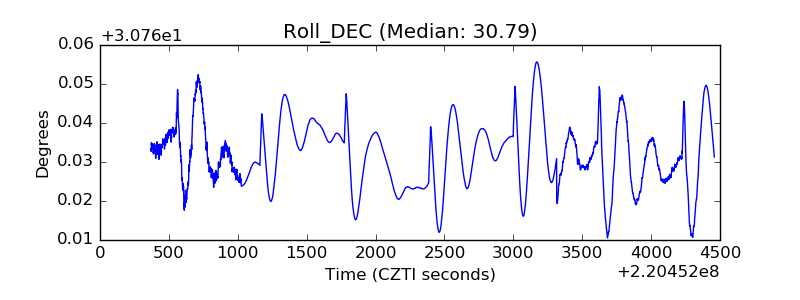 |
| _Roll_RA | 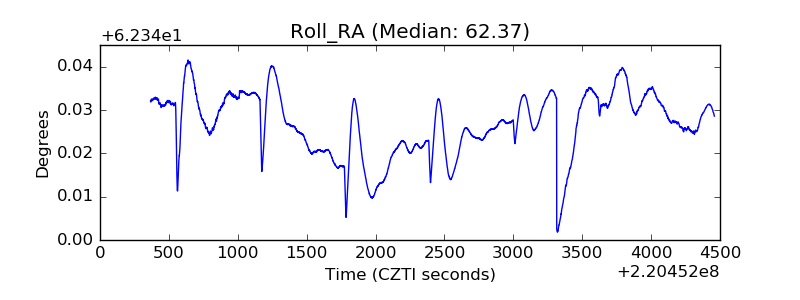 |
| Veto Counter | 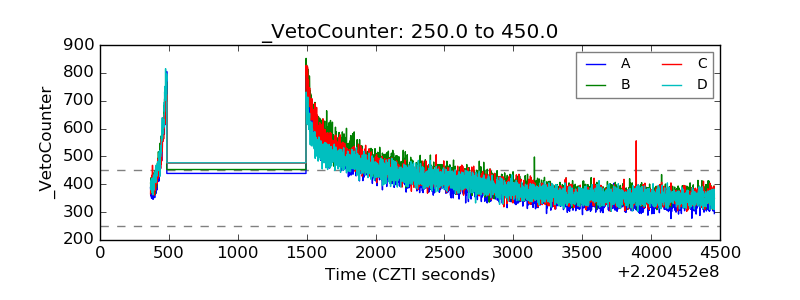 |