| Param | Original file | Final file |
|---|---|---|
| Filename | modeM0/AS1G06_068T01_9000000930cztM0_level2.fits | modeM0/AS1G06_068T01_9000000930cztM0_level2_quad_clean.evt |
| Size (bytes) | 92,128,320 | 99,987,840 |
| Size | 87.9 MB | 95.4 MB |
| Events in quadrant A | 562,464 | 625,351 |
| Events in quadrant B | 548,212 | 625,264 |
| Events in quadrant C | 560,510 | 593,568 |
| Events in quadrant D | 460,832 | 525,423 |
| Mode M0 | |||
|---|---|---|---|
| Quadrant | BADHDUFLAG | Total packets | Discarded packets |
| A | 0 | 21158 | 0 |
| B | 0 | 20437 | 0 |
| C | 0 | 19746 | 0 |
| D | 0 | 27569 | 0 |
| Mode M9 | |||
|---|---|---|---|
| Quadrant | BADHDUFLAG | Total packets | Discarded packets |
| A | 0 | 24 | 0 |
| B | 0 | 24 | 0 |
| C | 0 | 24 | 0 |
| D | 0 | 24 | 0 |
| Mode SS | |||
|---|---|---|---|
| Quadrant | BADHDUFLAG | Total packets | Discarded packets |
| A | 0 | 194 | 0 |
| B | 0 | 194 | 0 |
| C | 0 | 194 | 0 |
| D | 0 | 194 | 0 |
| Quadrant | Total seconds | Saturated seconds | Saturation percentage |
|---|---|---|---|
| A | 9488 | 164 | 1.728499% |
| B | 9488 | 107 | 1.127740% |
| C | 9488 | 70 | 0.737774% |
| D | 9488 | 823 | 8.674115% |
Noise dominated data is calculated using 1-second bins in cleaned event files. If a bin has >2000 counts, and if more than 50% of those come from <1% of pixels, then it is considered to be noise-dominated and hence unusable.
| Quadrant | # 1 sec bins | Bins with >0 counts | Bins with >2000 counts | High rate bins dominated by noise | Noise dominated (total time) | Noise dominated (detector-on time) | Marked lightcurve |
|---|---|---|---|---|---|---|---|
| A | 11888 | 9488 | 0 | 0 | 0.00% | 0.00% | 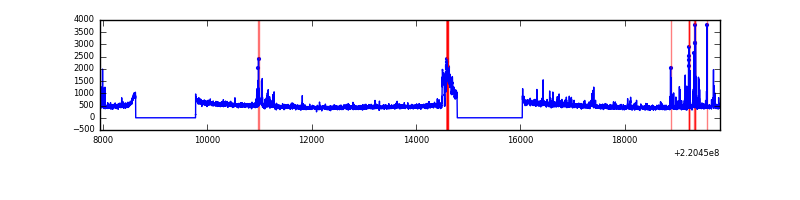 |
| B | 11888 | 9488 | 0 | 0 | 0.00% | 0.00% | 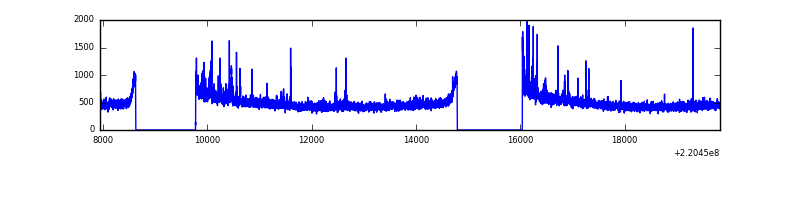 |
| C | 11888 | 9488 | 0 | 0 | 0.00% | 0.00% | 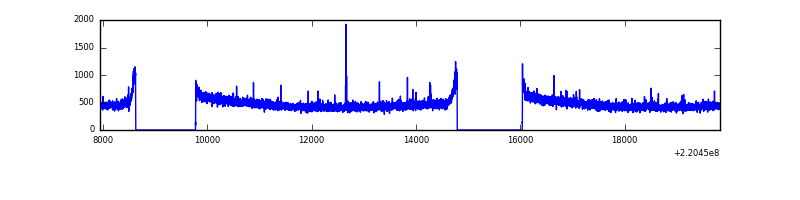 |
| D | 11888 | 9483 | 0 | 0 | 0.00% | 0.00% | 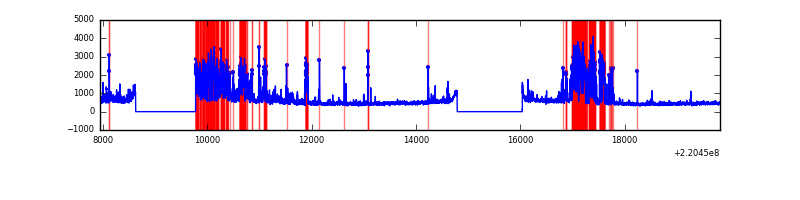 |
Top three noisy pixels from each quadrant. If the there are fewer than three noisy pixels in the level2.evt file, extra rows are filled as -1
| Pixel properties | Quadrant properties | ||||||
|---|---|---|---|---|---|---|---|
| Quadrant | DetID | PixID | Counts | Sigma | Mean | Median | Sigma |
| A | 0 | 29 | 590 | 11.87 | 146 | 137 | 38.2 |
| A | 14 | 188 | 574 | 11.45 | 146 | 137 | 38.2 |
| A | 14 | 204 | 495 | 9.38 | 146 | 137 | 38.2 |
| B | 2 | 9 | 466 | 10.5 | 144 | 138 | 31.2 |
| B | 5 | 128 | 388 | 8.01 | 144 | 138 | 31.2 |
| B | 12 | 226 | 377 | 7.65 | 144 | 138 | 31.2 |
| C | 9 | 242 | 394 | 6.39 | 147 | 137 | 40.2 |
| C | 3 | 158 | 387 | 6.22 | 147 | 137 | 40.2 |
| C | 12 | 241 | 386 | 6.19 | 147 | 137 | 40.2 |
| D | 7 | 5 | 341 | 5.94 | 131 | 120 | 37.2 |
| D | 6 | 231 | 337 | 5.83 | 131 | 120 | 37.2 |
| D | 10 | 189 | 331 | 5.67 | 131 | 120 | 37.2 |
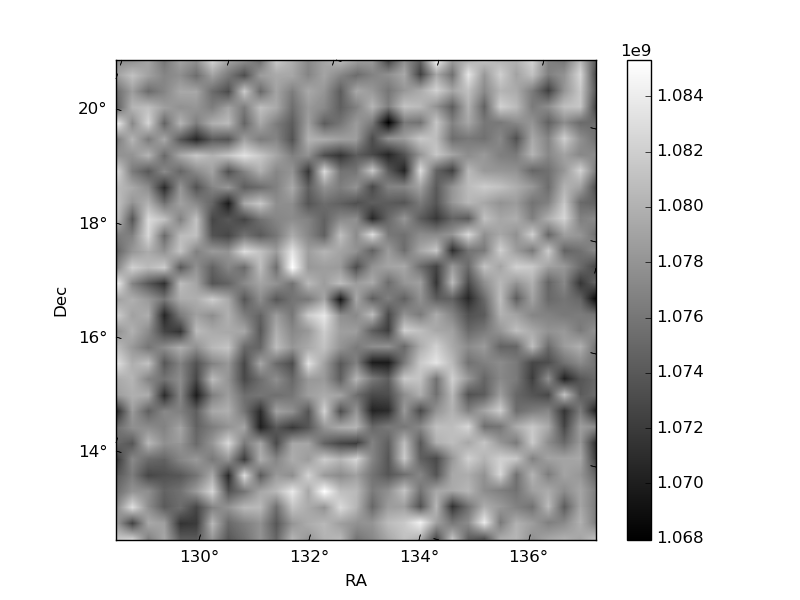
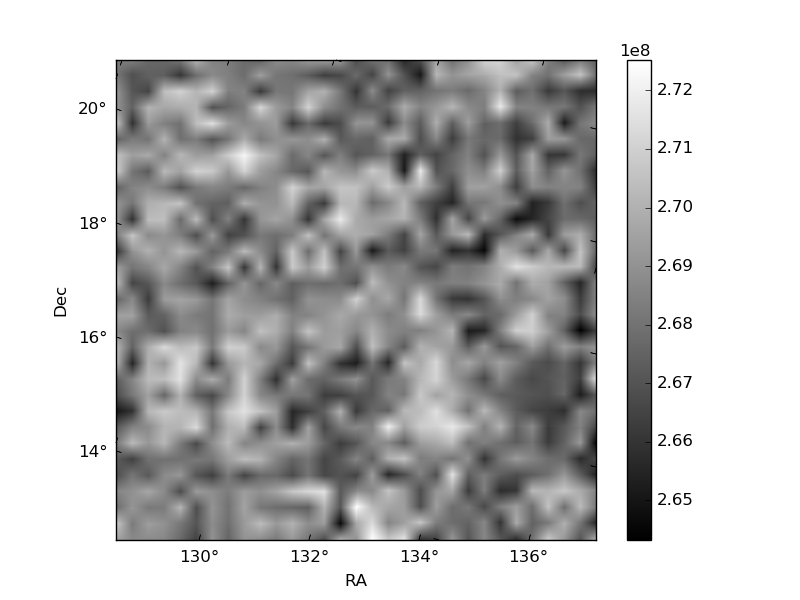
Histogram calculated using DETX and DETY for each event in the final _common_clean file
| Quadrant A | 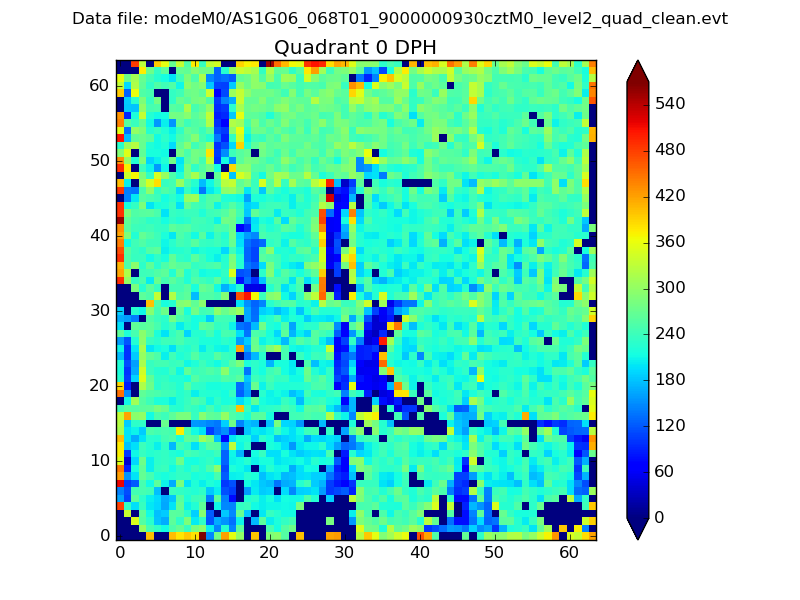 |
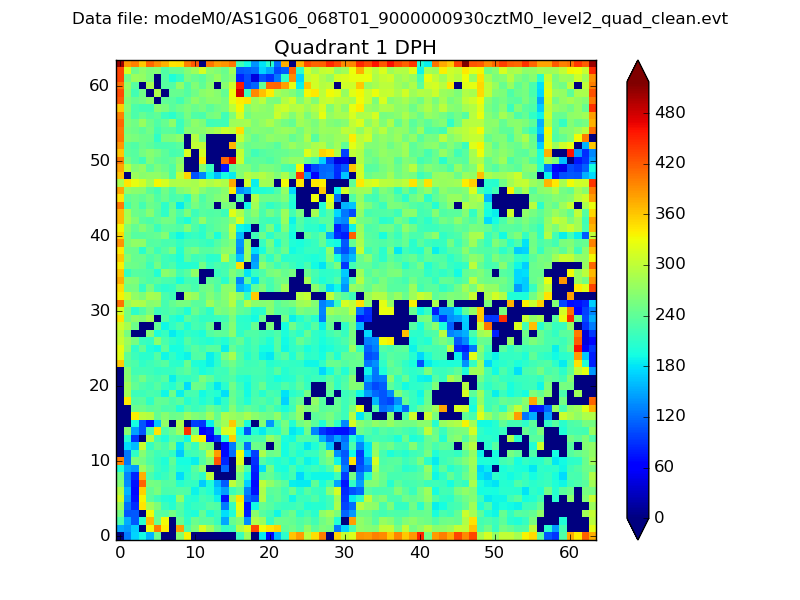 |
Quadrant B |
|---|---|---|---|
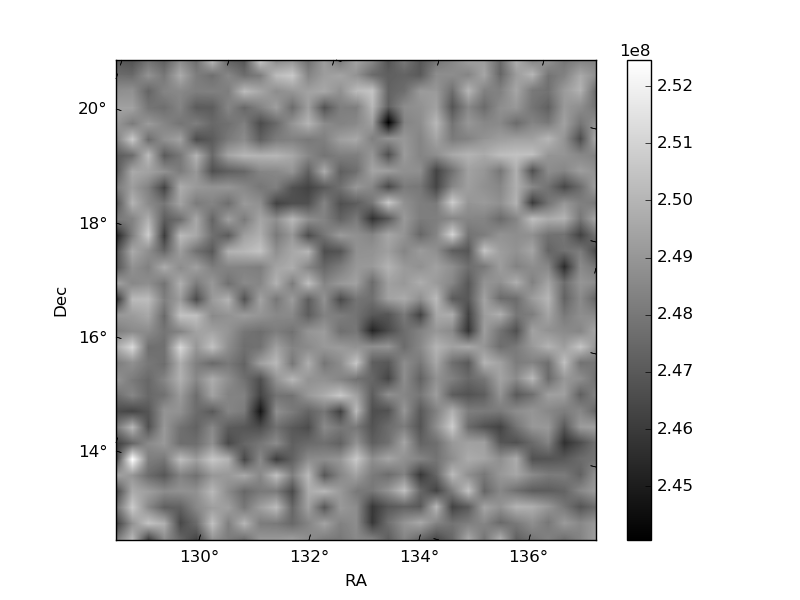
| Quadrant D | 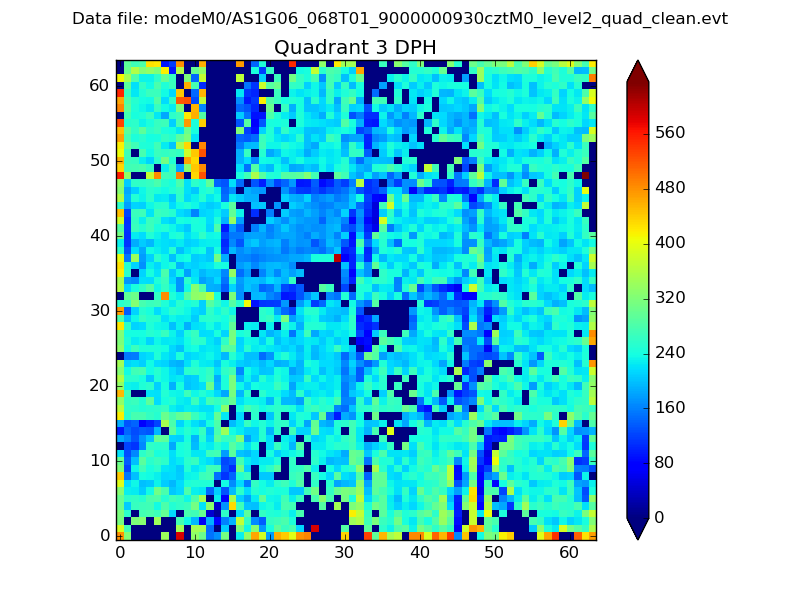 |
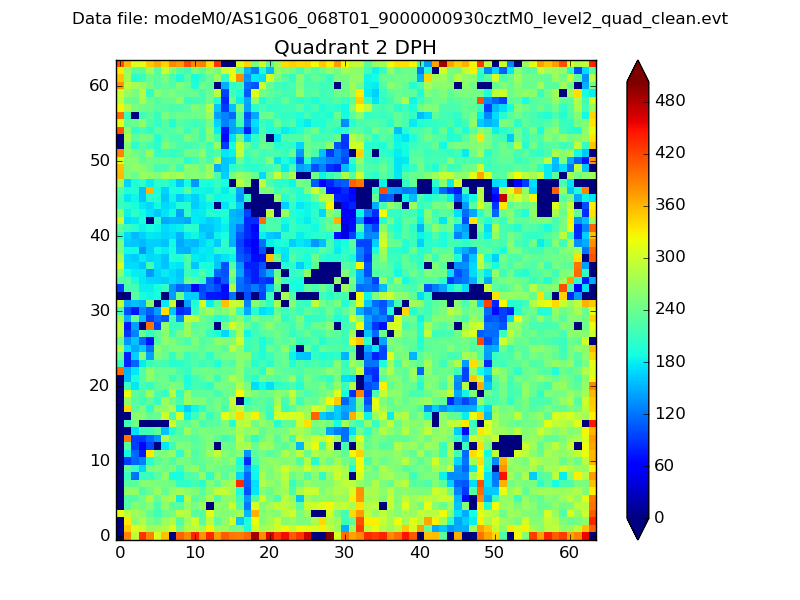 |
Quadrant C |
| Plot type | Count rate plots | Images |
|---|---|---|
| Comparison with Poisson distribution Blue bars denote a histogram of data divided into 1 sec bins. Red curve is a Poisson curve with rate = median count rate of data. |
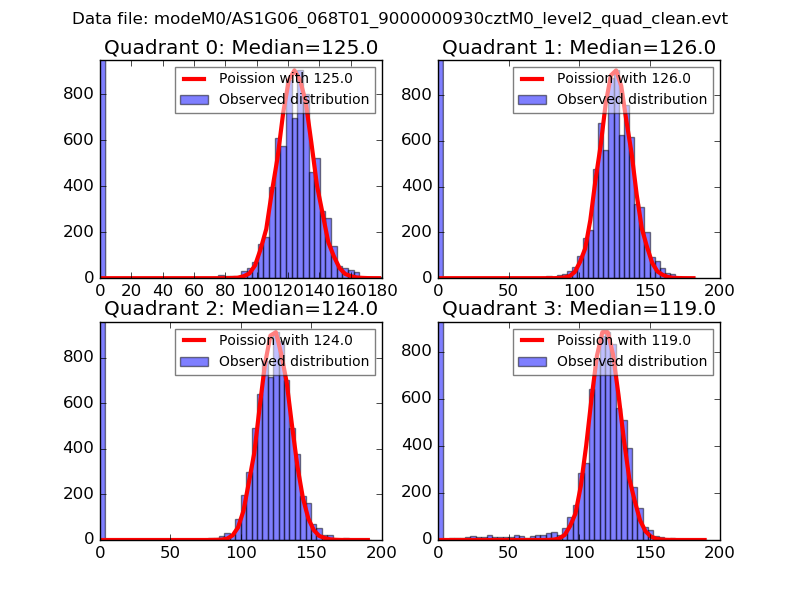 |
 |
| Quadrant-wise count rates Data is divided into 100 sec bins |
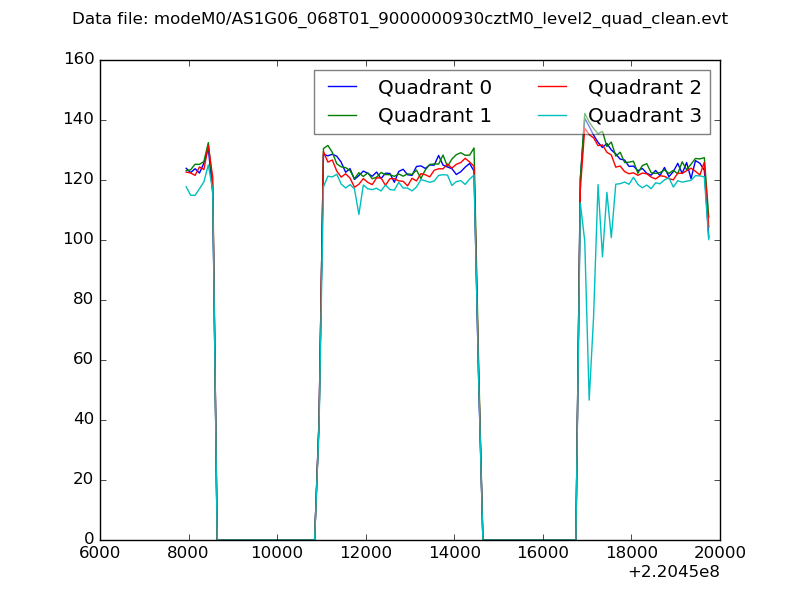 |
|
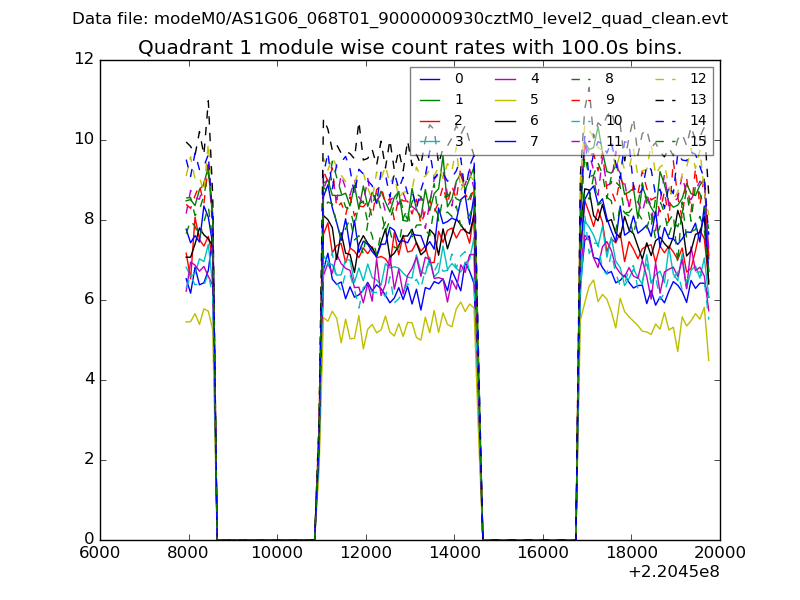
| Module-wise count rates for Quadrant A Data is divided into 100 sec bins |
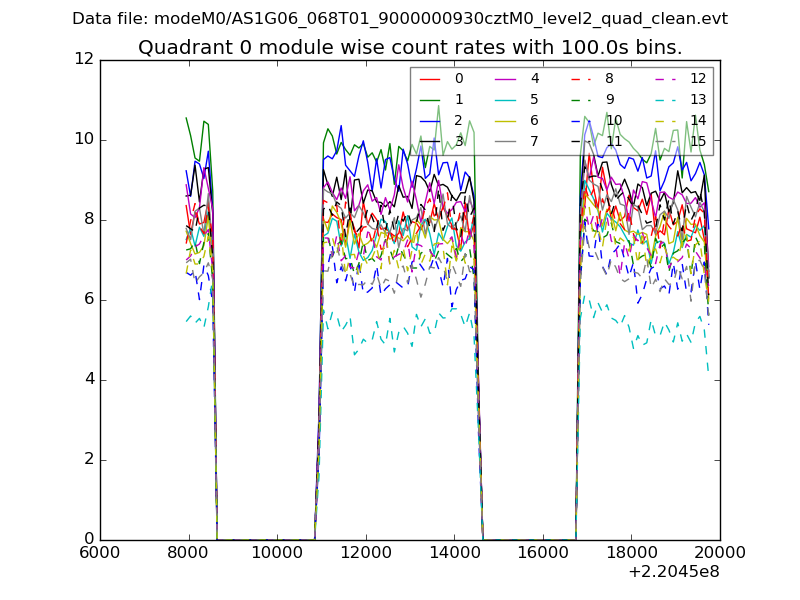 |
 |
| Module-wise count rates for Quadrant B Data is divided into 100 sec bins |
 |
 |
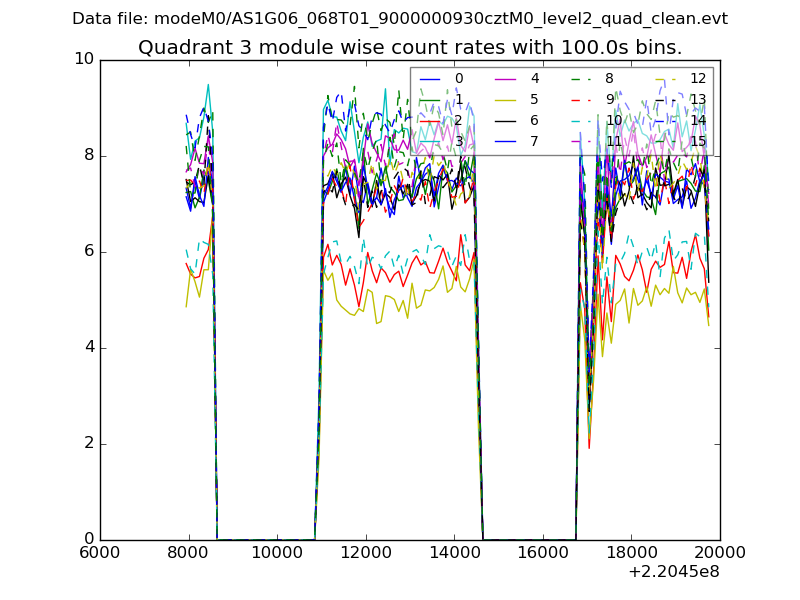
| Module-wise count rates for Quadrant C Data is divided into 100 sec bins |
 |
 |
| Module-wise count rates for Quadrant D Data is divided into 100 sec bins |
 |
 |
| Parameter | Plot |
|---|---|
| CZT HV Monitor |  |
| D_VDD | 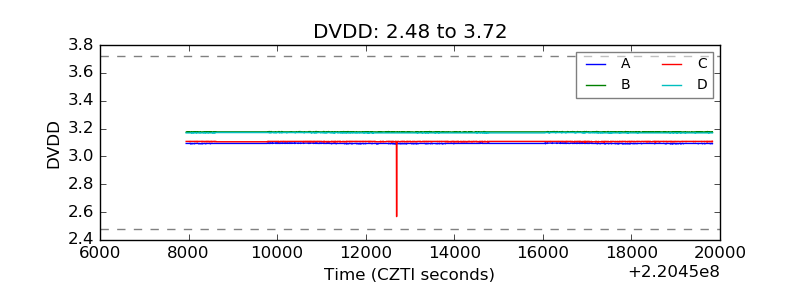 |
| Temperature 1 |  |
| Veto HV Monitor |  |
| Veto LLD | 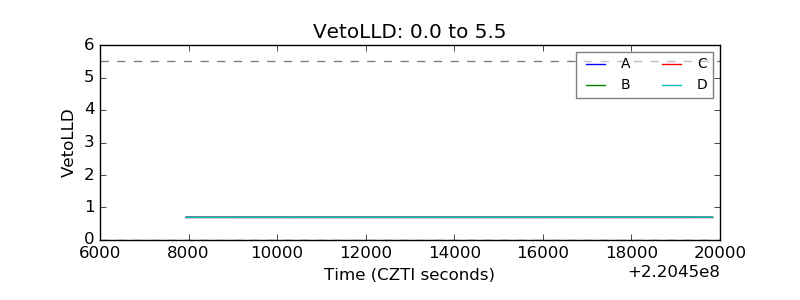 |
| Alpha Counter | 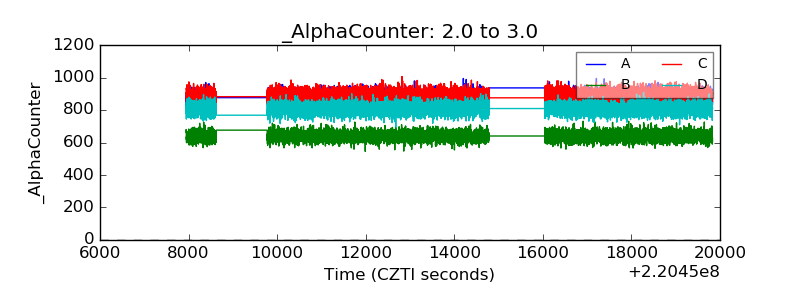 |
| _CPM_Rate | 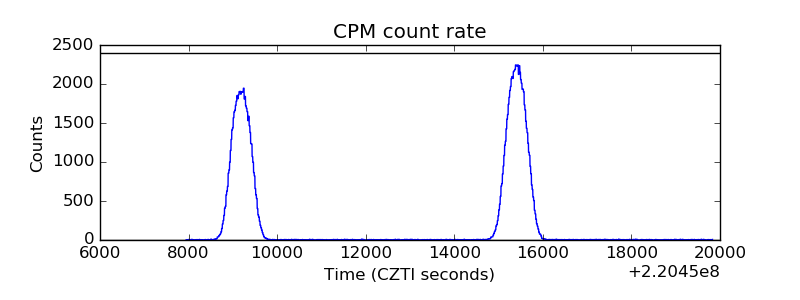 |
| CZT Counter | 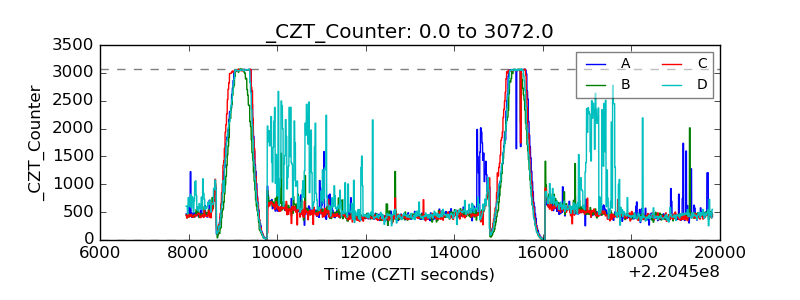 |
| +2.5 Volts monitor |  |
| +5 Volts monitor | 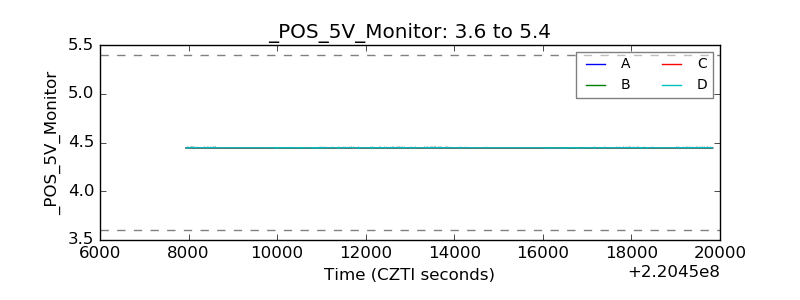 |
| _ROLL_ROT | 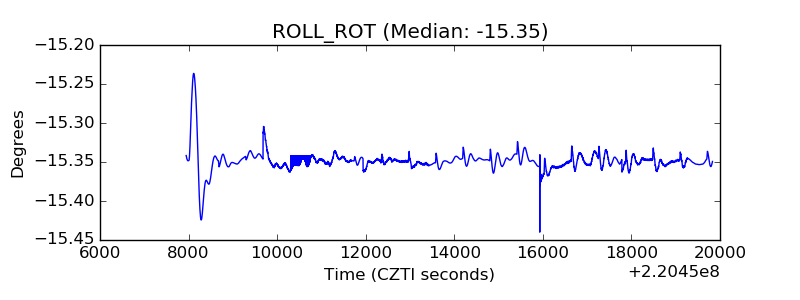 |
| _Roll_DEC | 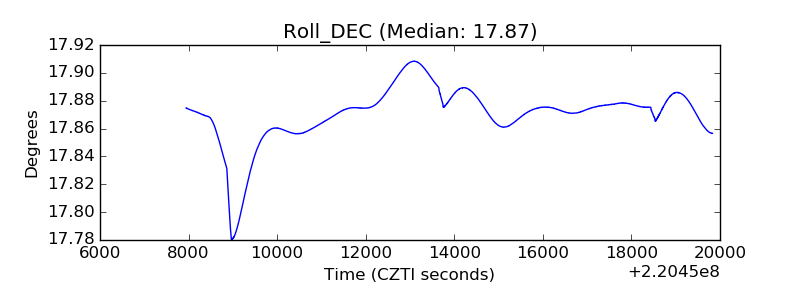 |
| _Roll_RA | 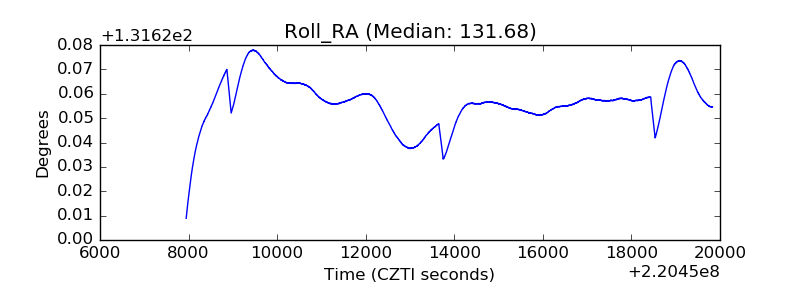 |
| Veto Counter | 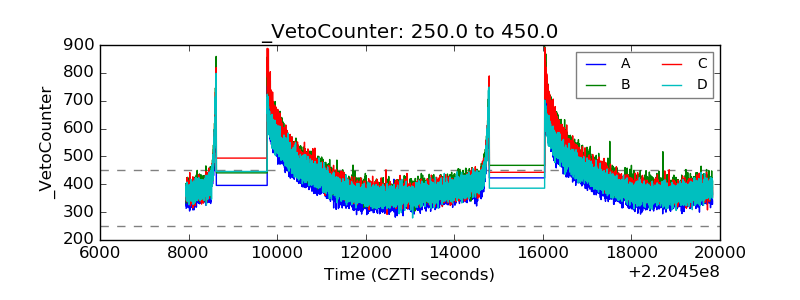 |