| Param | Original file | Final file |
|---|---|---|
| Filename | modeM0/AS1G06_068T01_9000000930_06742cztM0_level2.evt | modeM0/AS1G06_068T01_9000000930_06742cztM0_level2_quad_clean.evt |
| Size (bytes) | 191,033,280 | 17,982,720 |
| Size | 182.2 MB | 17.1 MB |
| Events in quadrant A | 1,140,240 | 99,718 |
| Events in quadrant B | 1,158,906 | 101,157 |
| Events in quadrant C | 1,066,977 | 100,264 |
| Events in quadrant D | 2,279,130 | 95,207 |
| Mode M0 | |||
|---|---|---|---|
| Quadrant | BADHDUFLAG | Total packets | Discarded packets |
| A | 0 | 4632 | 2 |
| B | 0 | 4760 | 1 |
| C | 0 | 4428 | 1 |
| D | 0 | 8212 | 1 |
| Mode M9 | |||
|---|---|---|---|
| Quadrant | BADHDUFLAG | Total packets | Discarded packets |
| A | 0 | 11 | 0 |
| B | 0 | 11 | 0 |
| C | 0 | 11 | 0 |
| D | 0 | 11 | 0 |
| Mode SS | |||
|---|---|---|---|
| Quadrant | BADHDUFLAG | Total packets | Discarded packets |
| A | 0 | 44 | 0 |
| B | 0 | 44 | 0 |
| C | 0 | 44 | 0 |
| D | 0 | 44 | 0 |
| Quadrant | Total seconds | Saturated seconds | Saturation percentage |
|---|---|---|---|
| A | 2026 | 54 | 2.665350% |
| B | 2026 | 46 | 2.270484% |
| C | 2026 | 35 | 1.727542% |
| D | 2026 | 410 | 20.236920% |
Noise dominated data is calculated using 1-second bins in cleaned event files. If a bin has >2000 counts, and if more than 50% of those come from <1% of pixels, then it is considered to be noise-dominated and hence unusable.
| Quadrant | # 1 sec bins | Bins with >0 counts | Bins with >2000 counts | High rate bins dominated by noise | Noise dominated (total time) | Noise dominated (detector-on time) | Marked lightcurve |
|---|---|---|---|---|---|---|---|
| A | 3176 | 2027 | 2 | 2 | 0.06% | 0.10% | 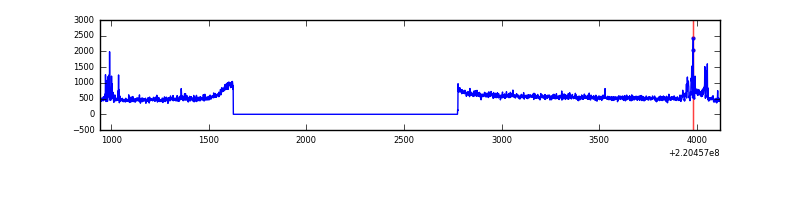 |
| B | 3176 | 2027 | 0 | 0 | 0.00% | 0.00% | 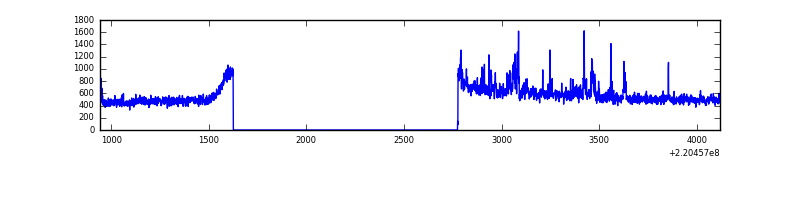 |
| C | 3176 | 2027 | 0 | 0 | 0.00% | 0.00% | 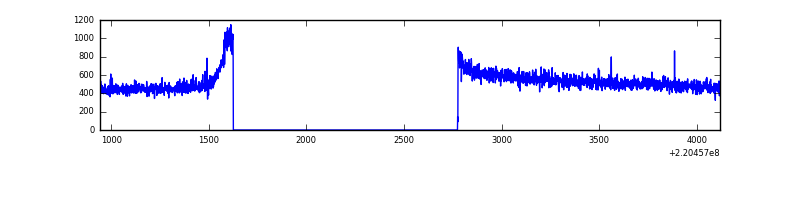 |
| D | 3176 | 2027 | 277 | 277 | 8.72% | 13.67% | 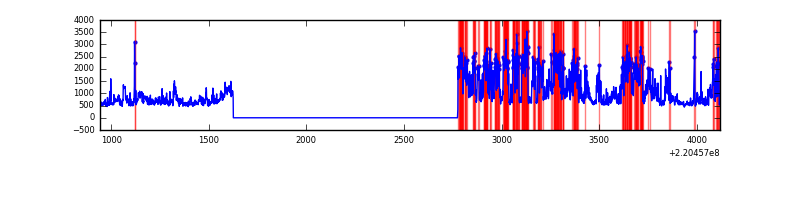 |
Top three noisy pixels from each quadrant. If the there are fewer than three noisy pixels in the level2.evt file, extra rows are filled as -1
| Pixel properties | Quadrant properties | ||||||
|---|---|---|---|---|---|---|---|
| Quadrant | DetID | PixID | Counts | Sigma | Mean | Median | Sigma |
| A | 15 | 234 | 38616 | 655.01 | 279 | 273 | 58.5 |
| A | 4 | 2 | 15984 | 268.39 | 279 | 273 | 58.5 |
| A | 8 | 15 | 6635 | 108.68 | 279 | 273 | 58.5 |
| B | 4 | 48 | 30825 | 553.18 | 278 | 272 | 55.2 |
| B | 0 | 214 | 25491 | 456.6 | 278 | 272 | 55.2 |
| B | 0 | 228 | 14227 | 252.66 | 278 | 272 | 55.2 |
| C | 9 | 247 | 7167 | 108.22 | 270 | 272 | 63.7 |
| C | 13 | 61 | 2152 | 29.51 | 270 | 272 | 63.7 |
| C | 8 | 222 | 1027 | 11.85 | 270 | 272 | 63.7 |
| D | 2 | 33 | 903911 | 14288.26 | 254 | 246 | 63.2 |
| D | 7 | 203 | 128670 | 2030.57 | 254 | 246 | 63.2 |
| D | 8 | 195 | 111778 | 1763.48 | 254 | 246 | 63.2 |
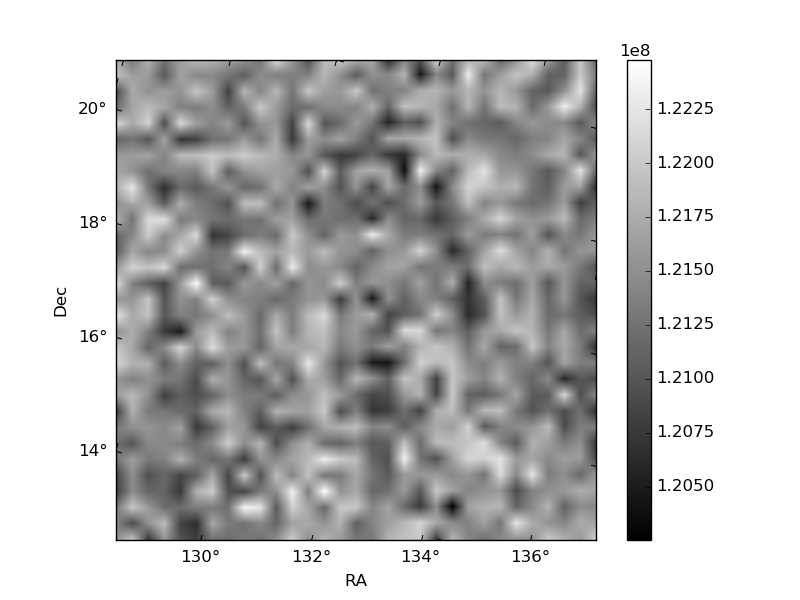
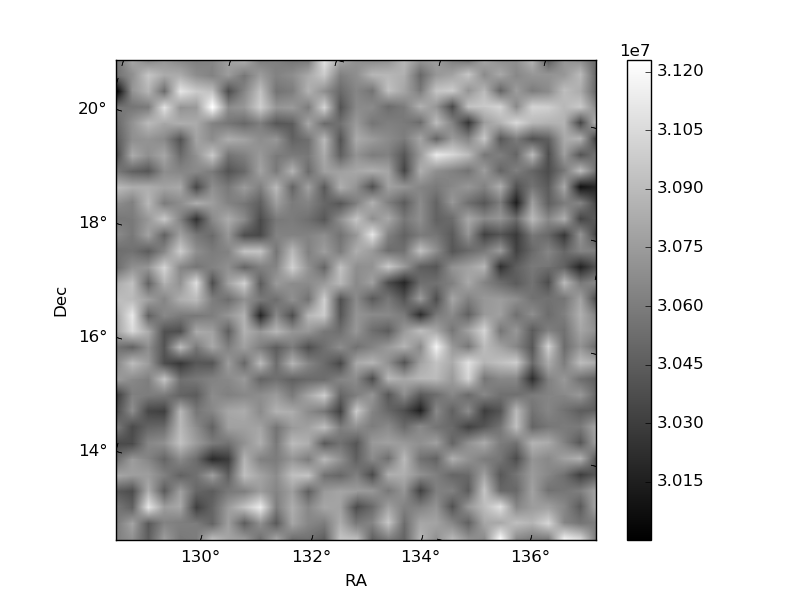
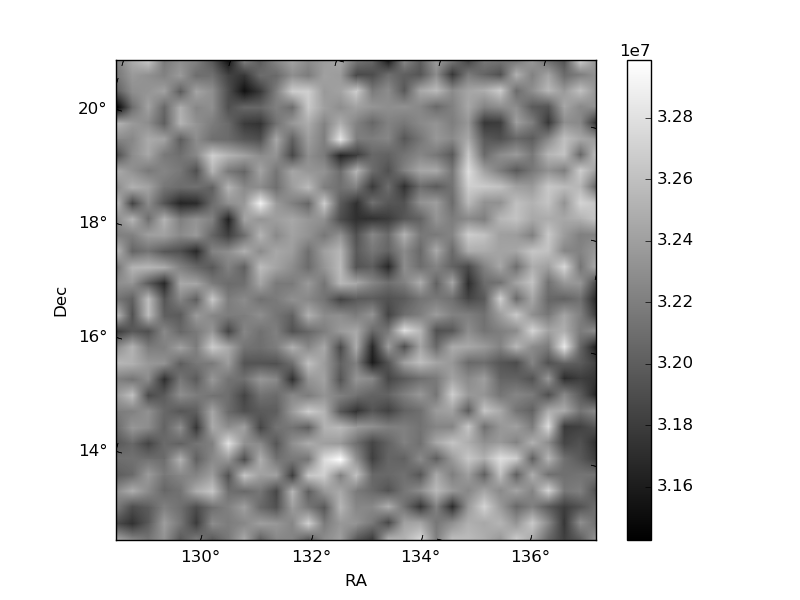
Histogram calculated using DETX and DETY for each event in the final _common_clean file
| Quadrant A | 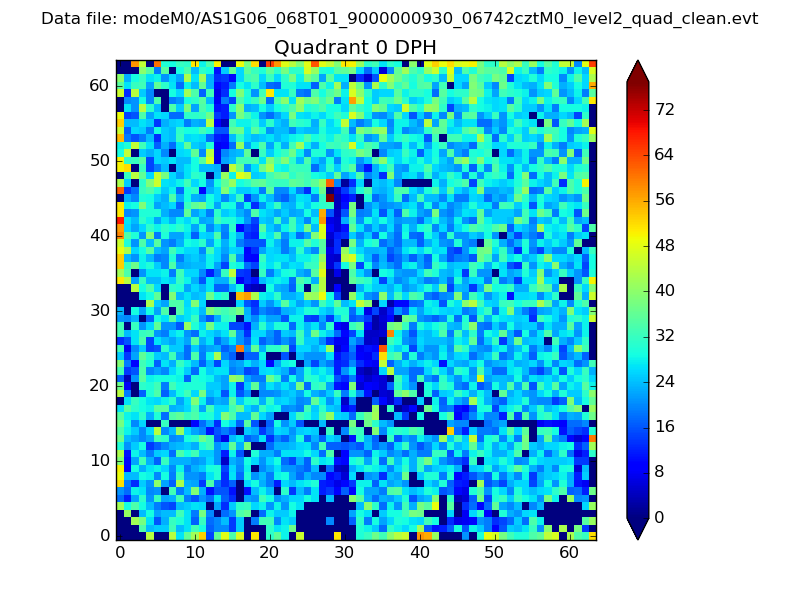 |
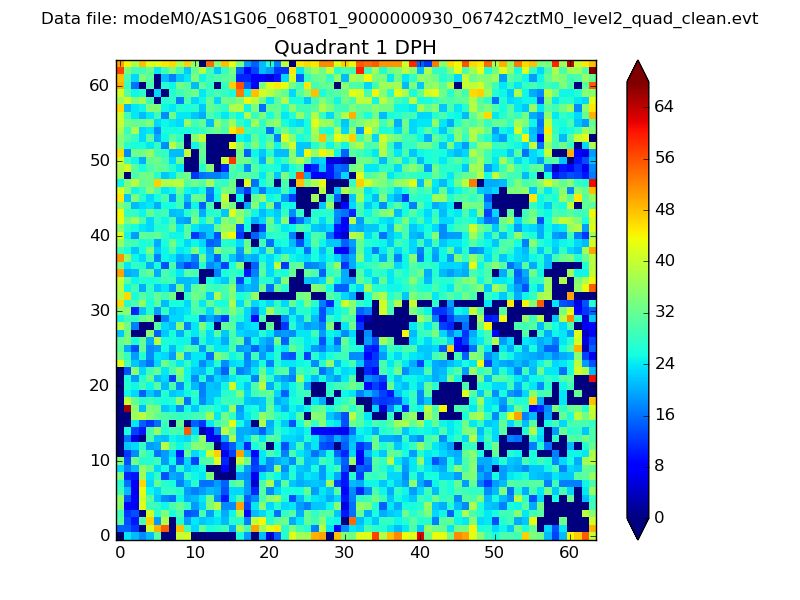 |
Quadrant B |
|---|---|---|---|
| Quadrant D | 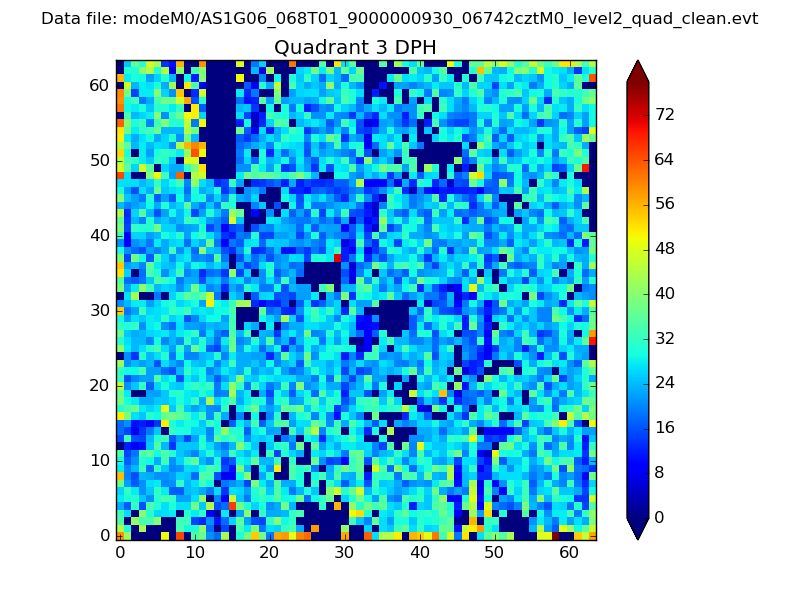 |
 |
Quadrant C |
| Plot type | Count rate plots | Images |
|---|---|---|
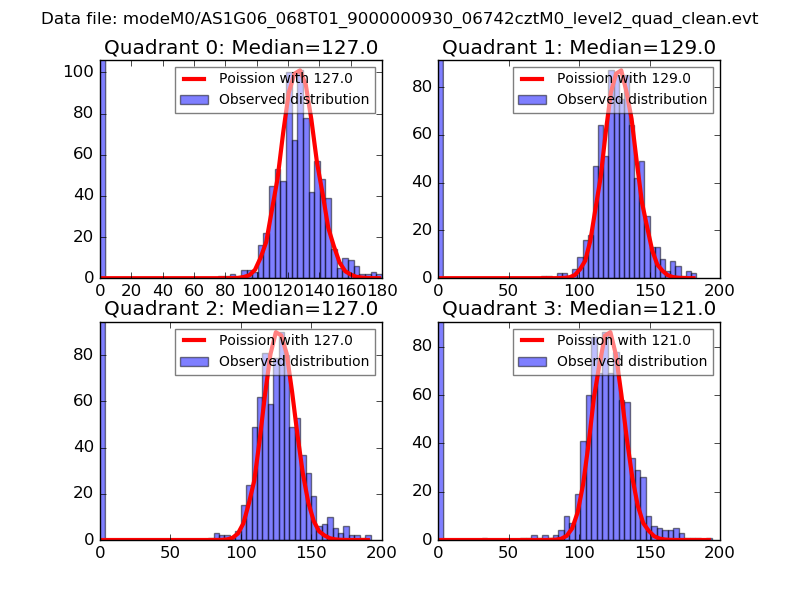
| Comparison with Poisson distribution Blue bars denote a histogram of data divided into 1 sec bins. Red curve is a Poisson curve with rate = median count rate of data. |
 |
 |
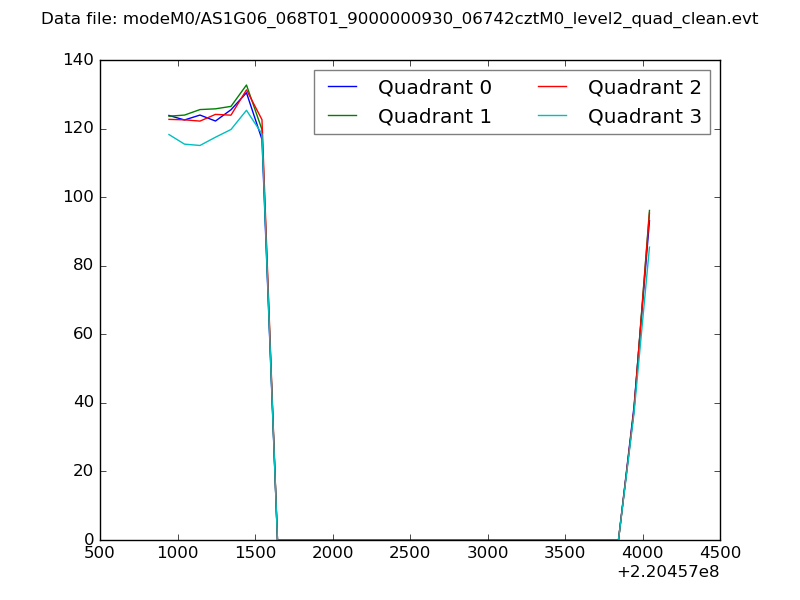
| Quadrant-wise count rates Data is divided into 100 sec bins |
 |
|
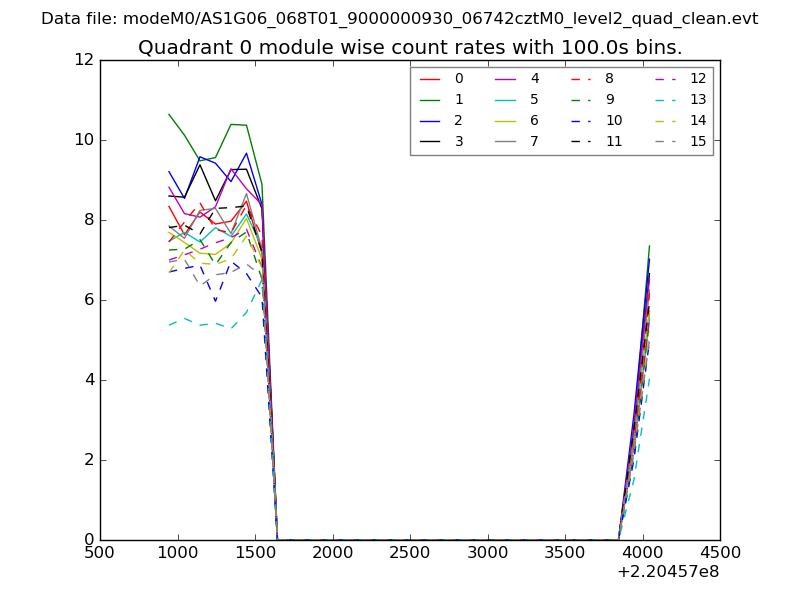
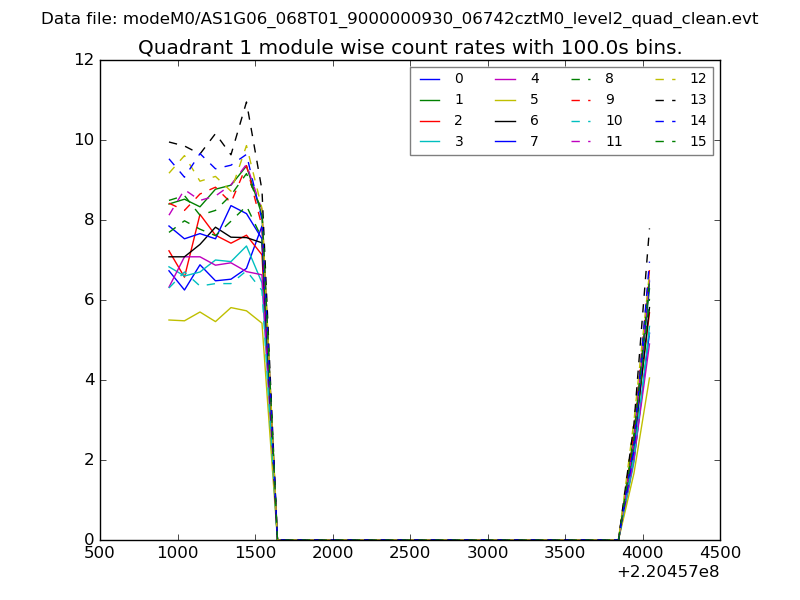
| Module-wise count rates for Quadrant A Data is divided into 100 sec bins |
 |
 |
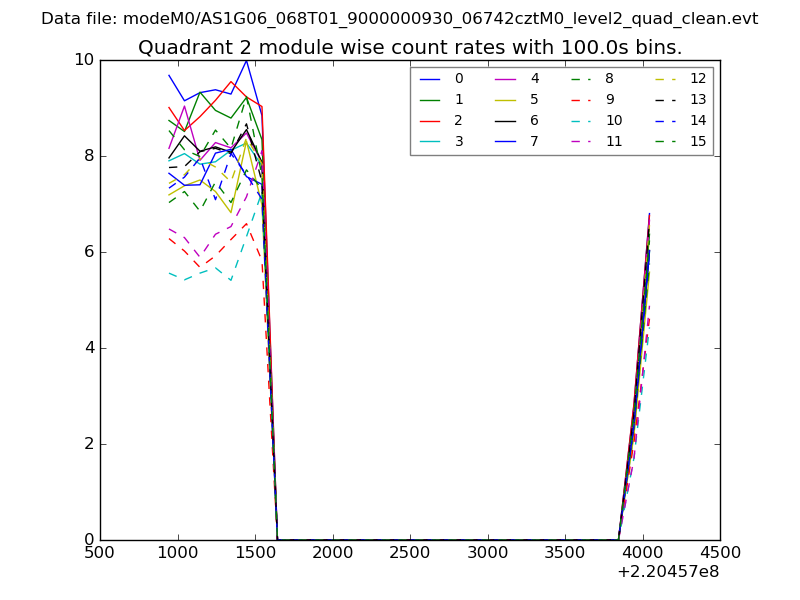
| Module-wise count rates for Quadrant B Data is divided into 100 sec bins |
 |
 |
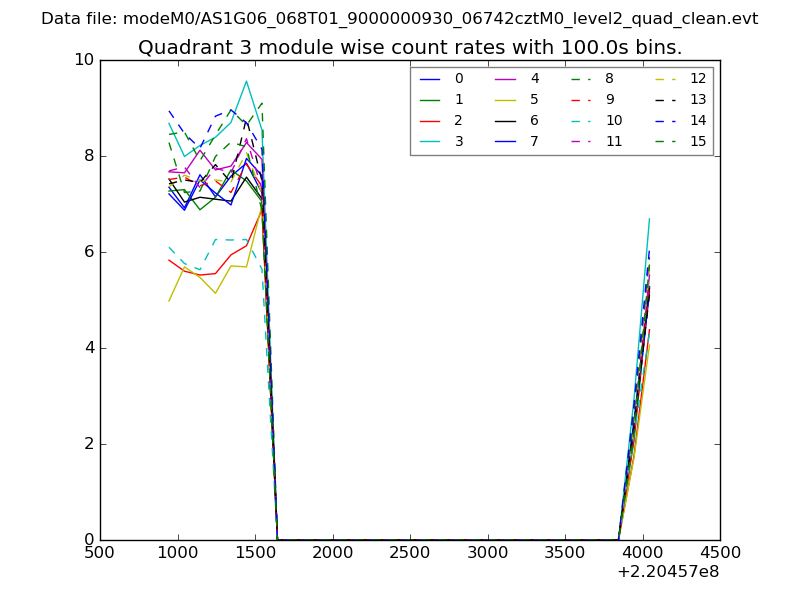
| Module-wise count rates for Quadrant C Data is divided into 100 sec bins |
 |
 |
| Module-wise count rates for Quadrant D Data is divided into 100 sec bins |
 |
 |
| Parameter | Plot |
|---|---|
| CZT HV Monitor | 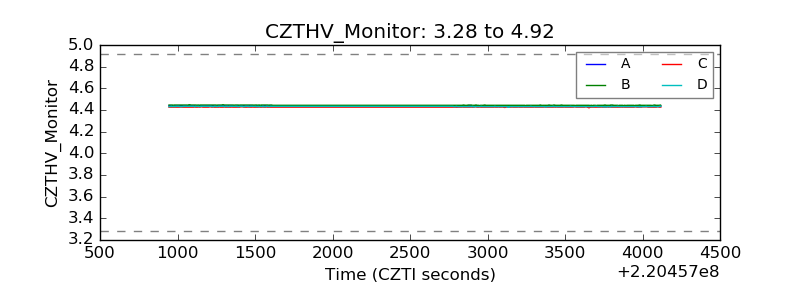 |
| D_VDD | 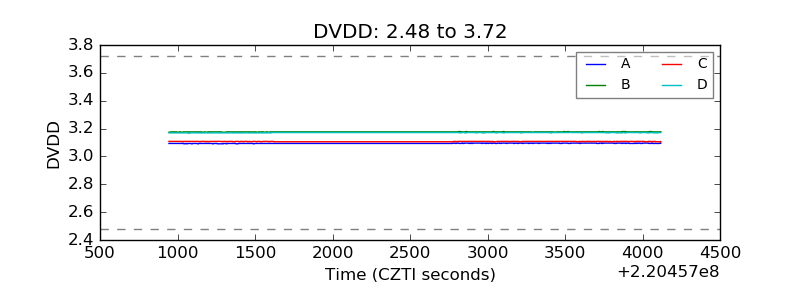 |
| Temperature 1 | 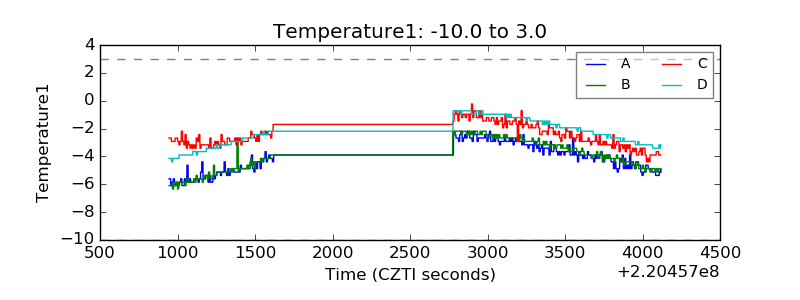 |
| Veto HV Monitor | 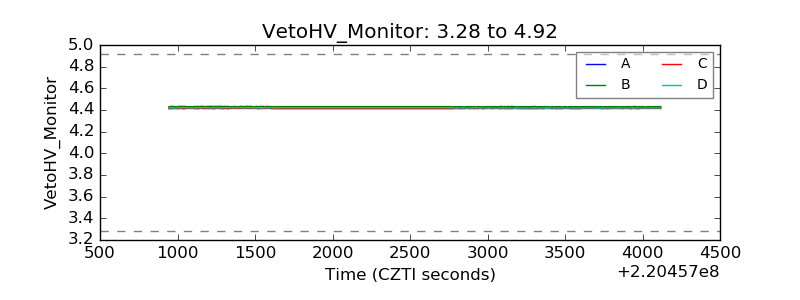 |
| Veto LLD | 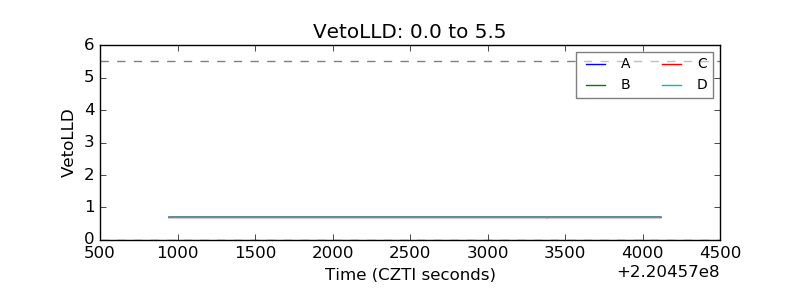 |
| Alpha Counter | 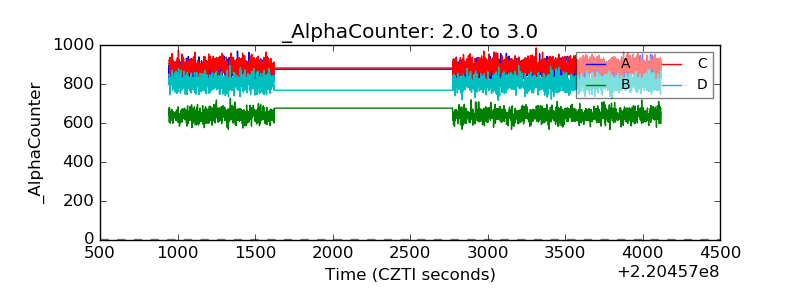 |
| _CPM_Rate |  |
| CZT Counter | 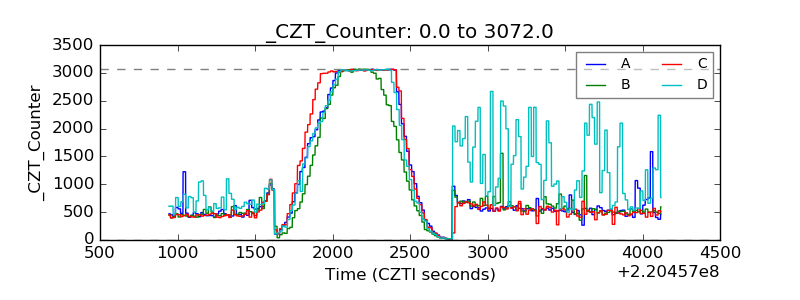 |
| +2.5 Volts monitor |  |
| +5 Volts monitor |  |
| _ROLL_ROT | 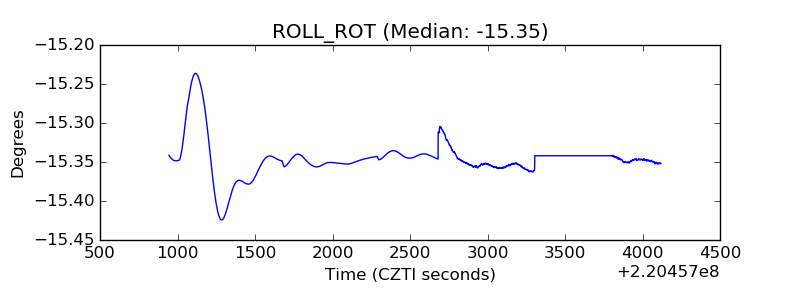 |
| _Roll_DEC | 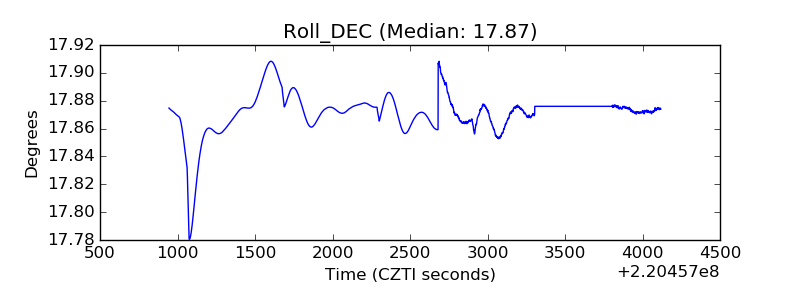 |
| _Roll_RA | 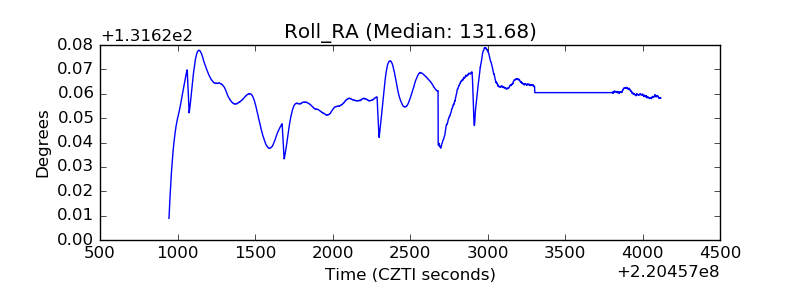 |
| Veto Counter | 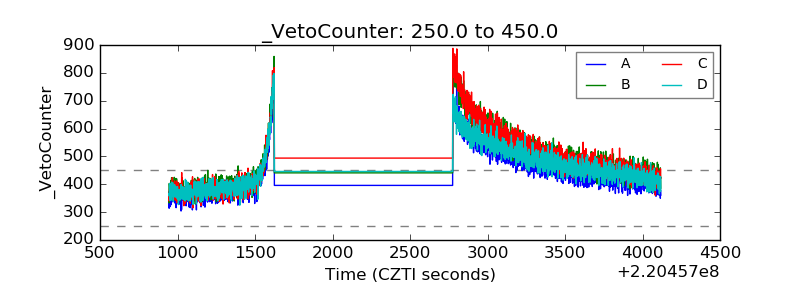 |