| Param | Original file | Final file |
|---|---|---|
| Filename | modeM0/AS1G06_068T01_9000000930_06743cztM0_level2.evt | modeM0/AS1G06_068T01_9000000930_06743cztM0_level2_quad_clean.evt |
| Size (bytes) | 511,165,440 | 81,492,480 |
| Size | 487.5 MB | 77.7 MB |
| Events in quadrant A | 3,440,336 | 517,045 |
| Events in quadrant B | 3,292,179 | 521,888 |
| Events in quadrant C | 3,076,802 | 510,307 |
| Events in quadrant D | 5,238,522 | 473,402 |
| Mode M0 | |||
|---|---|---|---|
| Quadrant | BADHDUFLAG | Total packets | Discarded packets |
| A | 0 | 14447 | 3 |
| B | 0 | 14094 | 2 |
| C | 0 | 13396 | 2 |
| D | 0 | 19938 | 2 |
| Mode M9 | |||
|---|---|---|---|
| Quadrant | BADHDUFLAG | Total packets | Discarded packets |
| A | 0 | 13 | 0 |
| B | 0 | 13 | 0 |
| C | 0 | 13 | 0 |
| D | 0 | 13 | 0 |
| Mode SS | |||
|---|---|---|---|
| Quadrant | BADHDUFLAG | Total packets | Discarded packets |
| A | 0 | 130 | 0 |
| B | 0 | 130 | 0 |
| C | 0 | 130 | 0 |
| D | 0 | 130 | 0 |
| Quadrant | Total seconds | Saturated seconds | Saturation percentage |
|---|---|---|---|
| A | 6376 | 114 | 1.787955% |
| B | 6376 | 71 | 1.113551% |
| C | 6376 | 40 | 0.627353% |
| D | 6377 | 709 | 11.118081% |
Noise dominated data is calculated using 1-second bins in cleaned event files. If a bin has >2000 counts, and if more than 50% of those come from <1% of pixels, then it is considered to be noise-dominated and hence unusable.
| Quadrant | # 1 sec bins | Bins with >0 counts | Bins with >2000 counts | High rate bins dominated by noise | Noise dominated (total time) | Noise dominated (detector-on time) | Marked lightcurve |
|---|---|---|---|---|---|---|---|
| A | 7626 | 6377 | 13 | 13 | 0.17% | 0.20% | 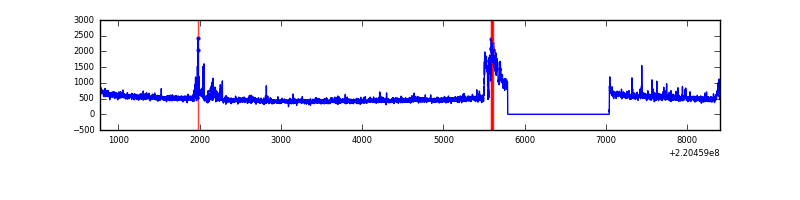 |
| B | 7626 | 6377 | 0 | 0 | 0.00% | 0.00% | 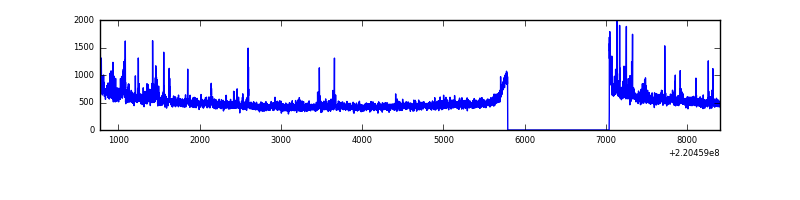 |
| C | 7626 | 6377 | 0 | 0 | 0.00% | 0.00% | 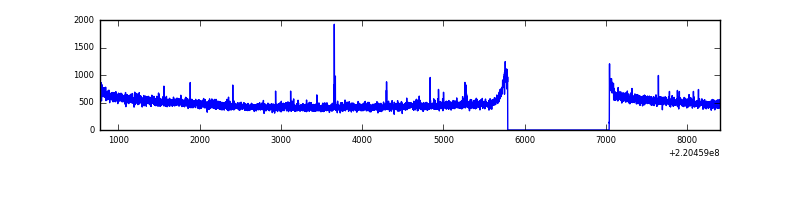 |
| D | 7627 | 6378 | 549 | 549 | 7.20% | 8.61% | 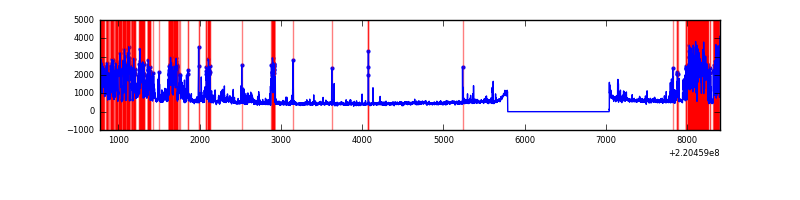 |
Top three noisy pixels from each quadrant. If the there are fewer than three noisy pixels in the level2.evt file, extra rows are filled as -1
| Pixel properties | Quadrant properties | ||||||
|---|---|---|---|---|---|---|---|
| Quadrant | DetID | PixID | Counts | Sigma | Mean | Median | Sigma |
| A | 15 | 234 | 286144 | 1776.38 | 796 | 779 | 160.6 |
| A | 13 | 251 | 58847 | 361.47 | 796 | 779 | 160.6 |
| A | 8 | 15 | 18877 | 112.66 | 796 | 779 | 160.6 |
| B | 0 | 214 | 47771 | 306.7 | 804 | 785 | 153.2 |
| B | 4 | 48 | 36555 | 233.49 | 804 | 785 | 153.2 |
| B | 4 | 81 | 22495 | 141.71 | 804 | 785 | 153.2 |
| C | 9 | 247 | 16704 | 88.32 | 777 | 784 | 180.3 |
| C | 12 | 4 | 14781 | 77.65 | 777 | 784 | 180.3 |
| C | 9 | 16 | 10248 | 52.5 | 777 | 784 | 180.3 |
| D | 2 | 33 | 1779938 | 9875.02 | 742 | 722 | 180.2 |
| D | 8 | 195 | 284881 | 1577.14 | 742 | 722 | 180.2 |
| D | 2 | 152 | 160289 | 885.63 | 742 | 722 | 180.2 |
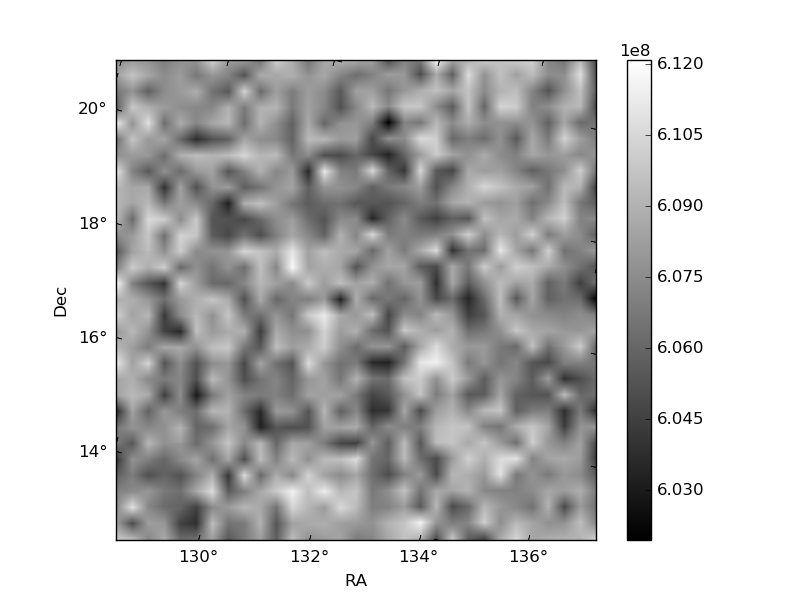
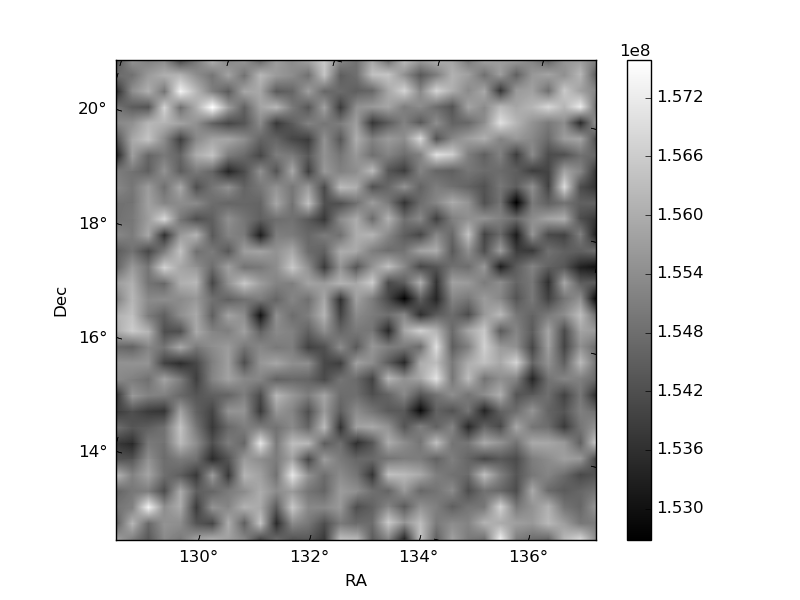
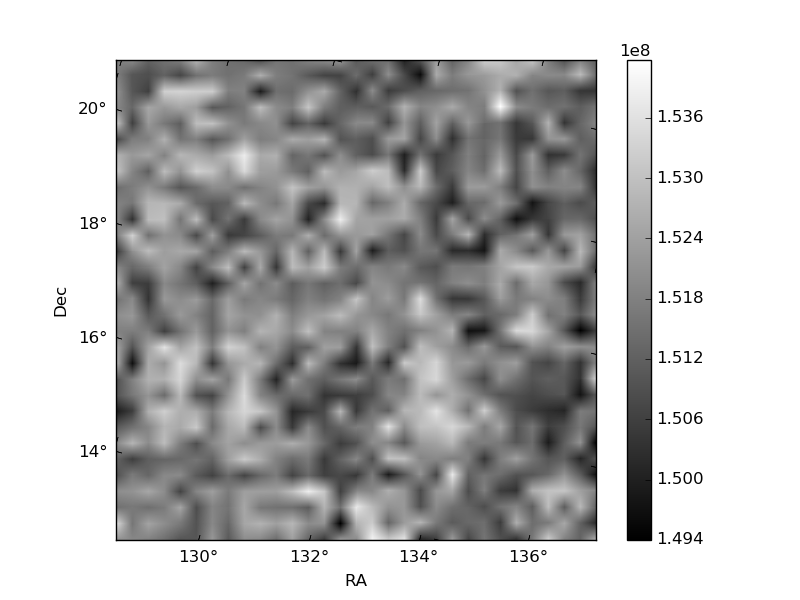
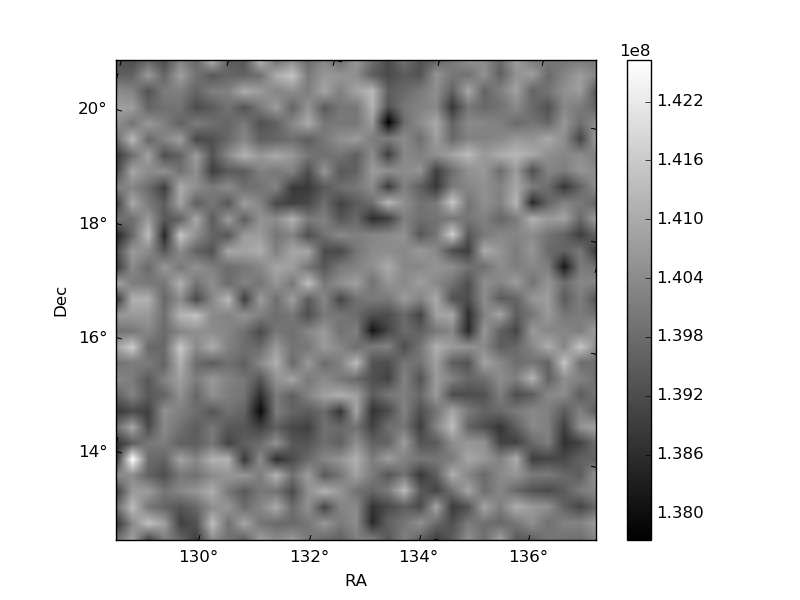
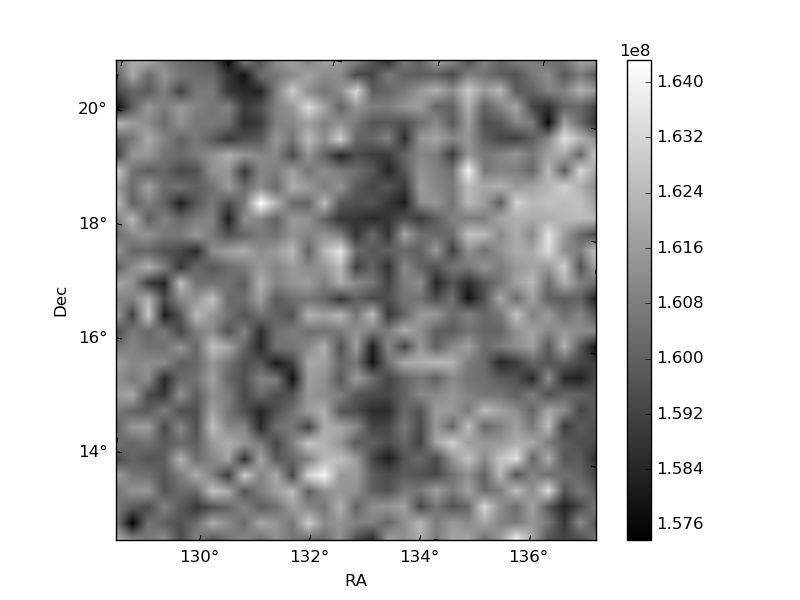
Histogram calculated using DETX and DETY for each event in the final _common_clean file
| Quadrant A | 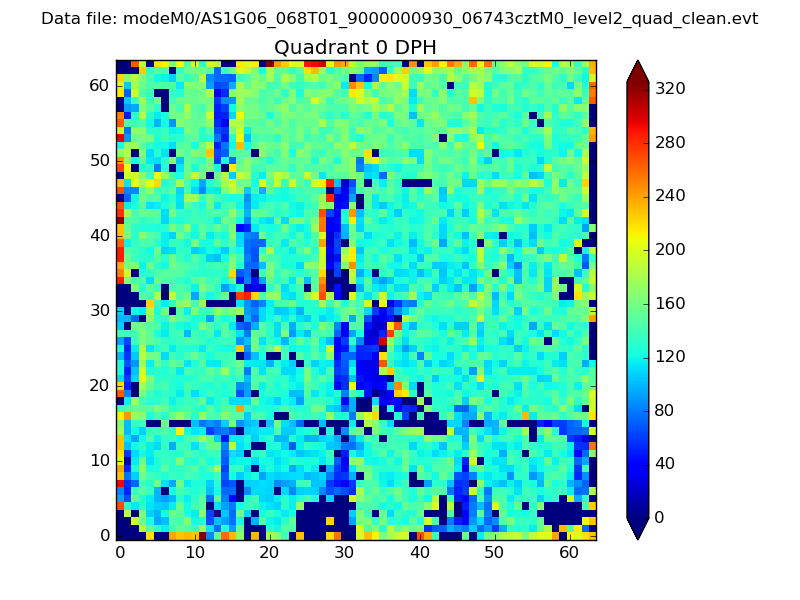 |
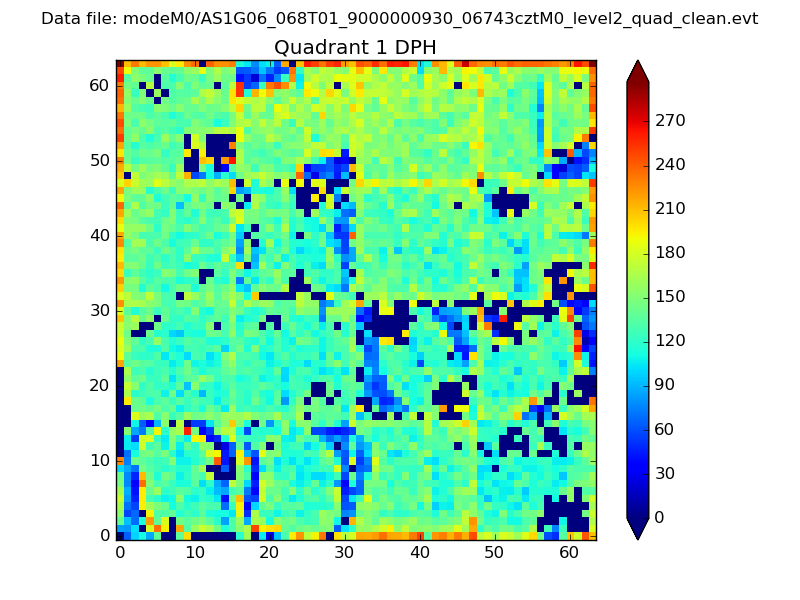 |
Quadrant B |
|---|---|---|---|
| Quadrant D | 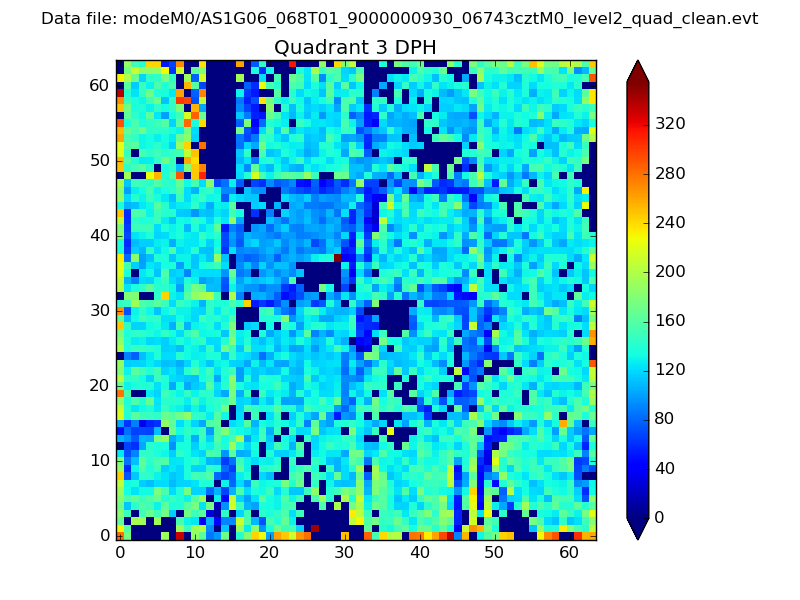 |
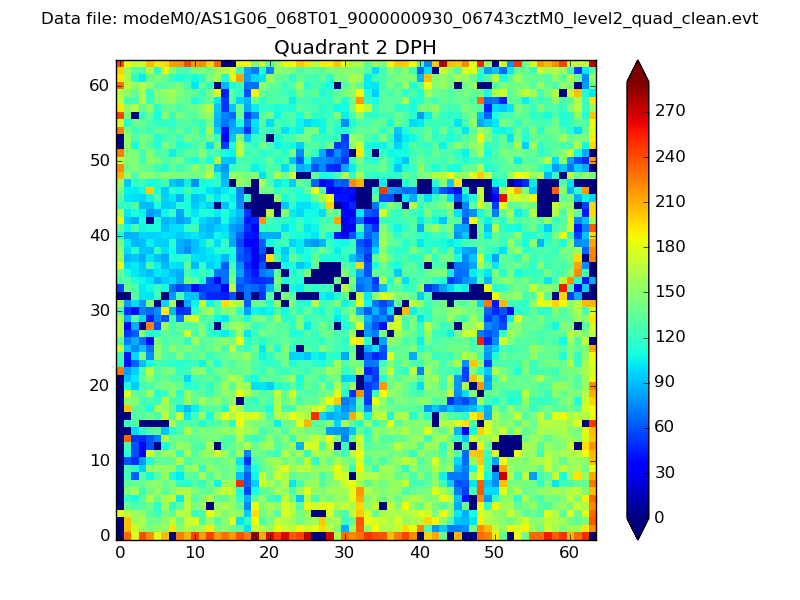 |
Quadrant C |
| Plot type | Count rate plots | Images |
|---|---|---|
| Comparison with Poisson distribution Blue bars denote a histogram of data divided into 1 sec bins. Red curve is a Poisson curve with rate = median count rate of data. |
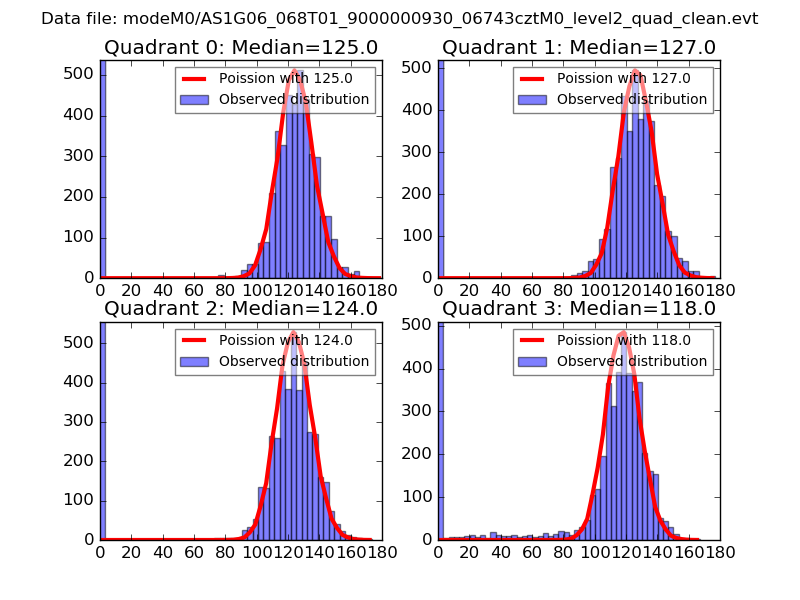 |
 |
| Quadrant-wise count rates Data is divided into 100 sec bins |
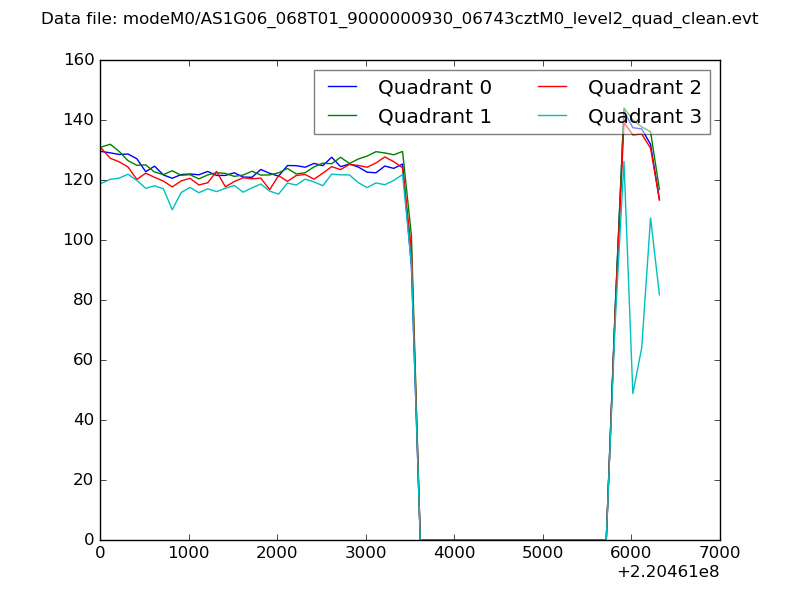 |
|
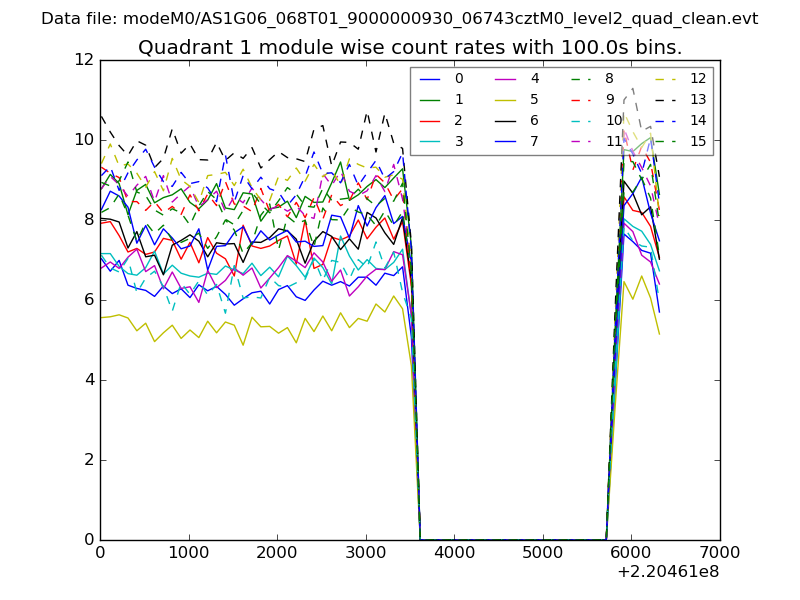
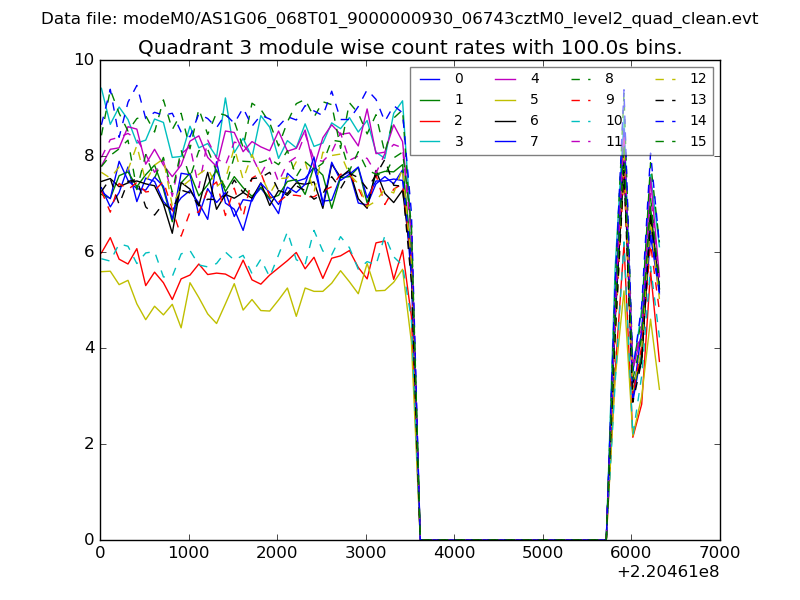
| Module-wise count rates for Quadrant A Data is divided into 100 sec bins |
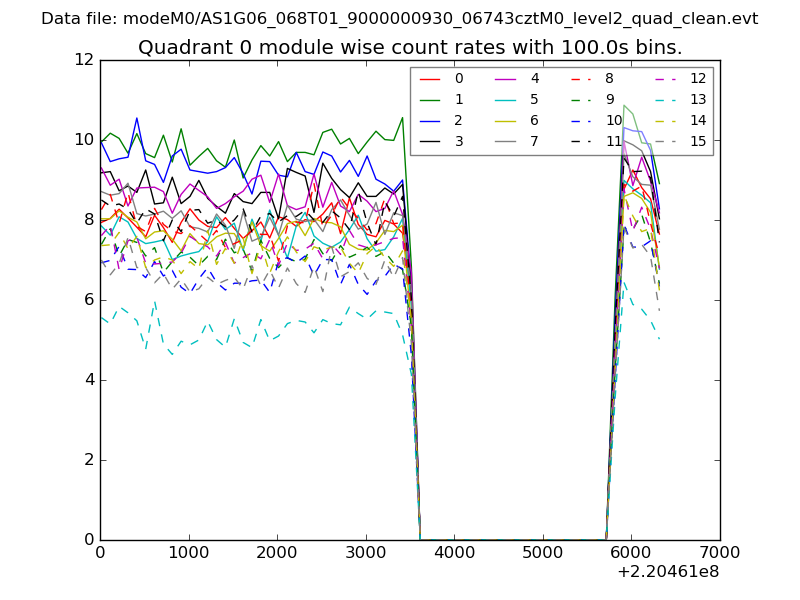 |
 |
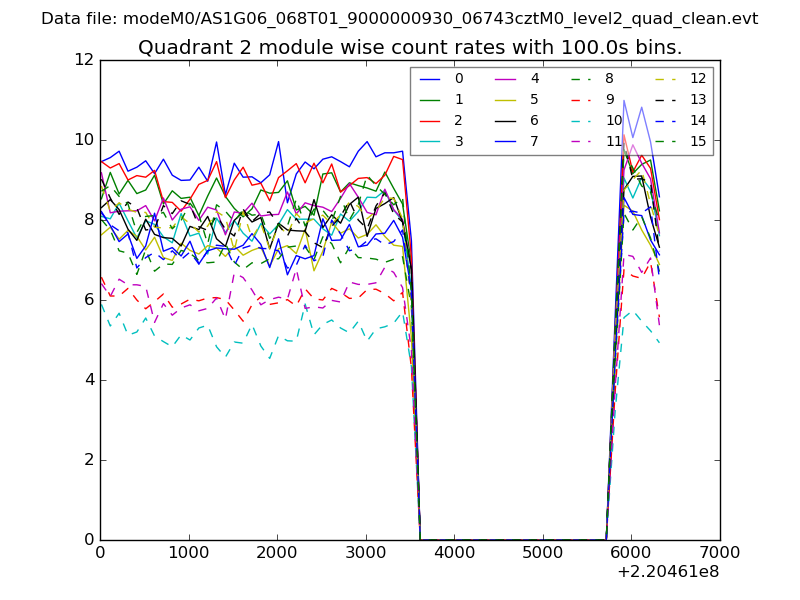
| Module-wise count rates for Quadrant B Data is divided into 100 sec bins |
 |
 |
| Module-wise count rates for Quadrant C Data is divided into 100 sec bins |
 |
 |
| Module-wise count rates for Quadrant D Data is divided into 100 sec bins |
 |
 |
| Parameter | Plot |
|---|---|
| CZT HV Monitor | 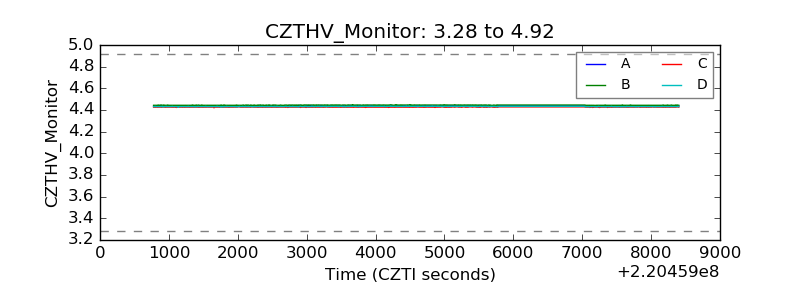 |
| D_VDD | 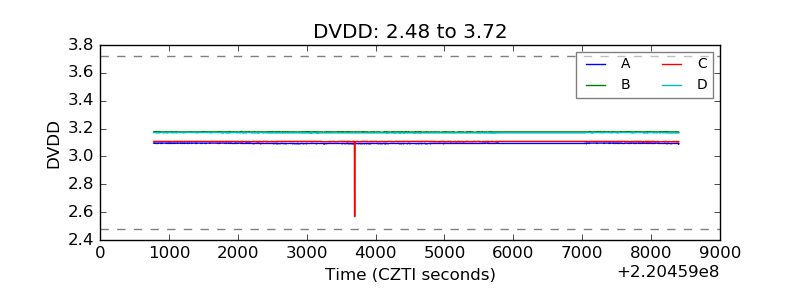 |
| Temperature 1 | 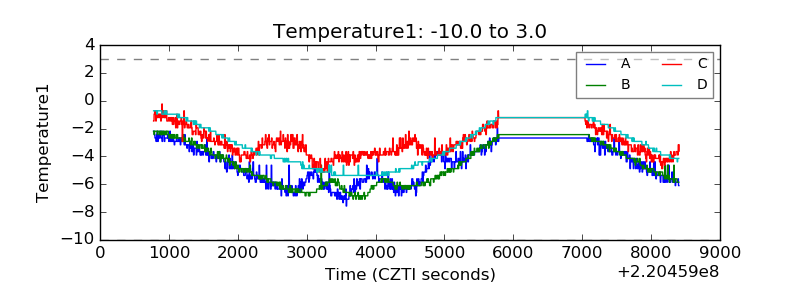 |
| Veto HV Monitor | 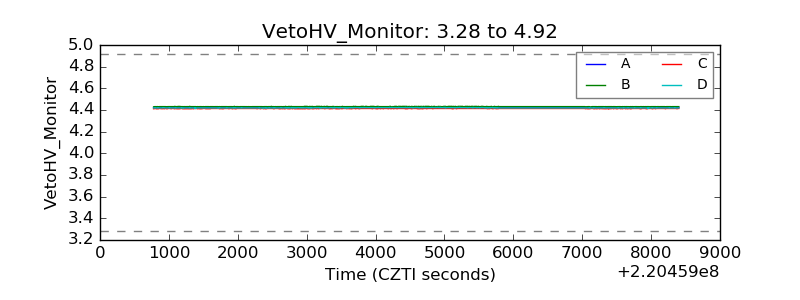 |
| Veto LLD | 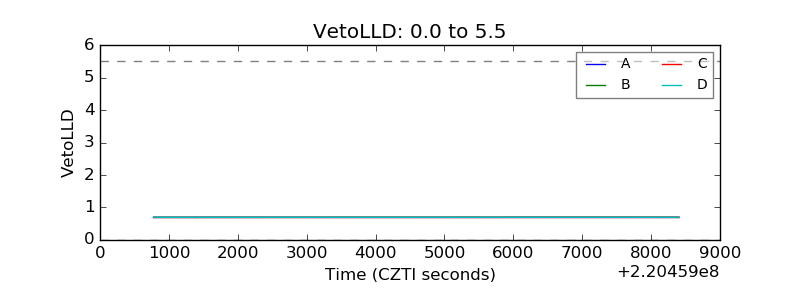 |
| Alpha Counter | 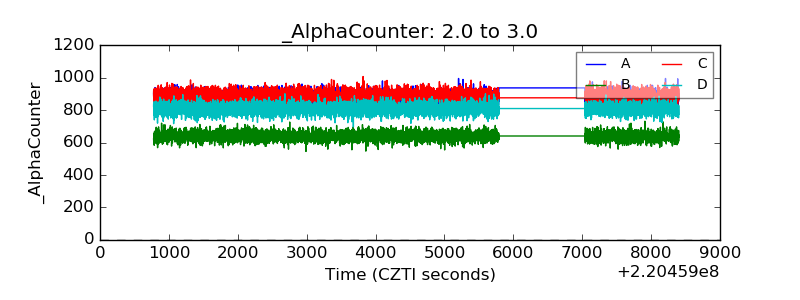 |
| _CPM_Rate | 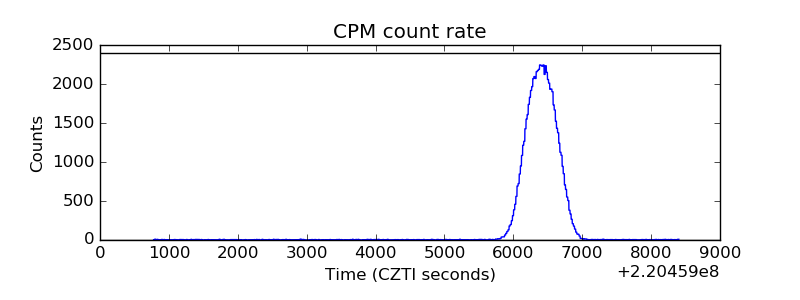 |
| CZT Counter |  |
| +2.5 Volts monitor | 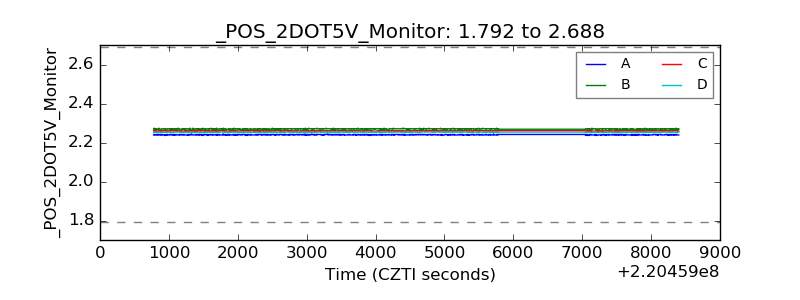 |
| +5 Volts monitor | 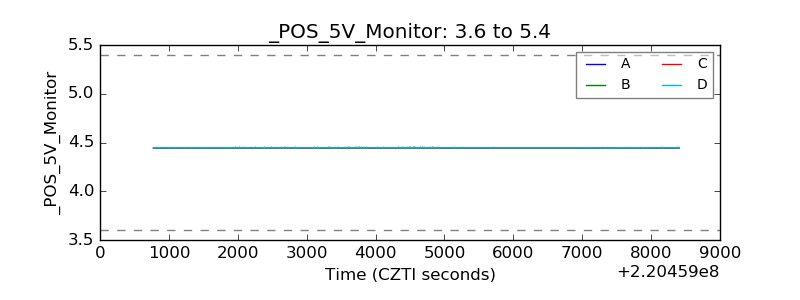 |
| _ROLL_ROT | 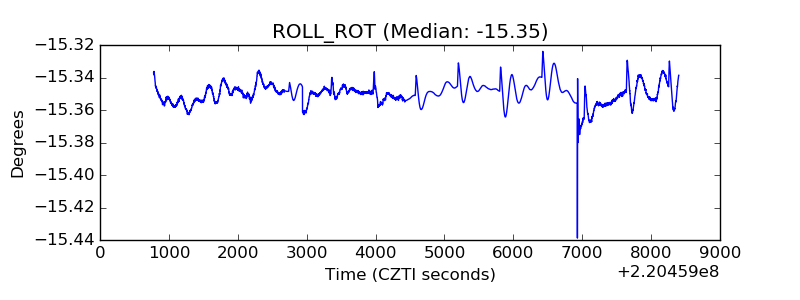 |
| _Roll_DEC | 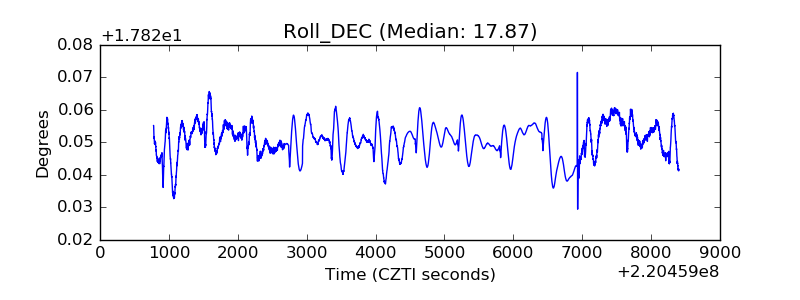 |
| _Roll_RA | 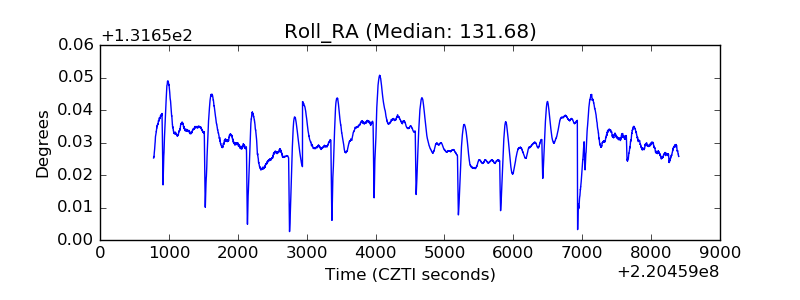 |
| Veto Counter | 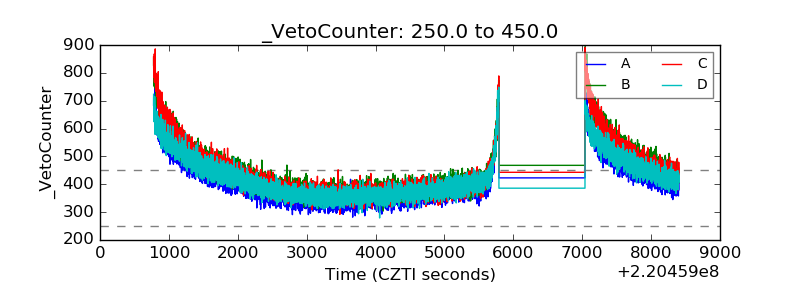 |