| Param | Original file | Final file |
|---|---|---|
| Filename | modeM0/AS1G06_068T01_9000000930_06744cztM0_level2.evt | modeM0/AS1G06_068T01_9000000930_06744cztM0_level2_quad_clean.evt |
| Size (bytes) | 283,582,080 | 57,225,600 |
| Size | 270.4 MB | 54.6 MB |
| Events in quadrant A | 1,911,514 | 376,785 |
| Events in quadrant B | 1,858,460 | 380,000 |
| Events in quadrant C | 1,755,281 | 371,523 |
| Events in quadrant D | 2,803,948 | 336,251 |
| Mode M0 | |||
|---|---|---|---|
| Quadrant | BADHDUFLAG | Total packets | Discarded packets |
| A | 0 | 8275 | 1 |
| B | 0 | 8145 | 1 |
| C | 0 | 7803 | 1 |
| D | 0 | 11024 | 1 |
| Mode M9 | |||
|---|---|---|---|
| Quadrant | BADHDUFLAG | Total packets | Discarded packets |
| A | 0 | 8 | 0 |
| B | 0 | 8 | 0 |
| C | 0 | 8 | 0 |
| D | 0 | 9 | 0 |
| Mode SS | |||
|---|---|---|---|
| Quadrant | BADHDUFLAG | Total packets | Discarded packets |
| A | 0 | 76 | 0 |
| B | 0 | 76 | 0 |
| C | 0 | 76 | 0 |
| D | 0 | 76 | 0 |
| Quadrant | Total seconds | Saturated seconds | Saturation percentage |
|---|---|---|---|
| A | 3790 | 15 | 0.395778% |
| B | 3790 | 19 | 0.501319% |
| C | 3790 | 3 | 0.079156% |
| D | 3790 | 362 | 9.551451% |
Noise dominated data is calculated using 1-second bins in cleaned event files. If a bin has >2000 counts, and if more than 50% of those come from <1% of pixels, then it is considered to be noise-dominated and hence unusable.
| Quadrant | # 1 sec bins | Bins with >0 counts | Bins with >2000 counts | High rate bins dominated by noise | Noise dominated (total time) | Noise dominated (detector-on time) | Marked lightcurve |
|---|---|---|---|---|---|---|---|
| A | 3790 | 3790 | 10 | 10 | 0.26% | 0.26% | 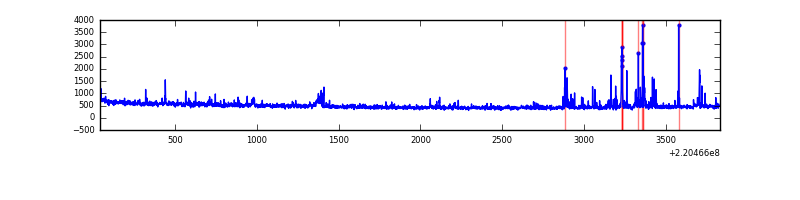 |
| B | 3790 | 3790 | 0 | 0 | 0.00% | 0.00% | 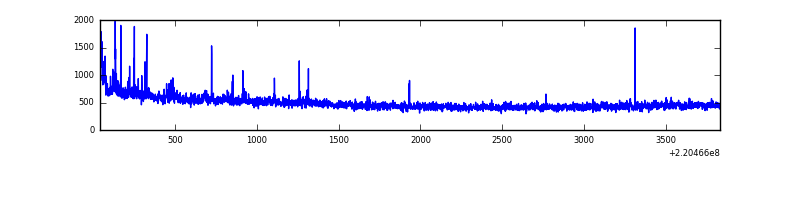 |
| C | 3790 | 3790 | 0 | 0 | 0.00% | 0.00% | 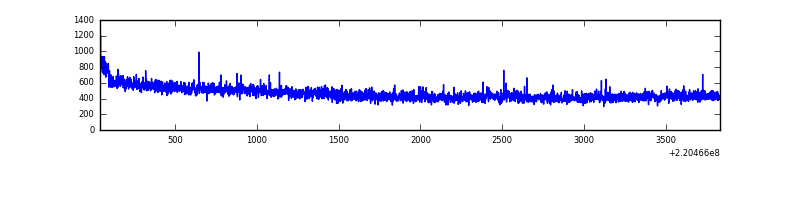 |
| D | 3790 | 3790 | 321 | 321 | 8.47% | 8.47% | 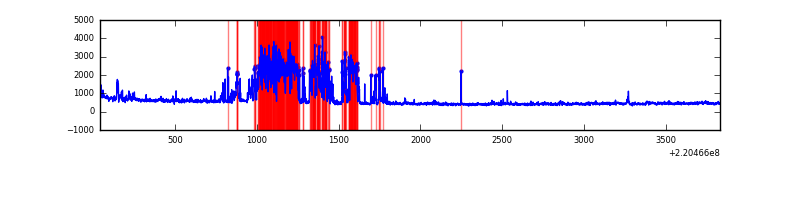 |
Top three noisy pixels from each quadrant. If the there are fewer than three noisy pixels in the level2.evt file, extra rows are filled as -1
| Pixel properties | Quadrant properties | ||||||
|---|---|---|---|---|---|---|---|
| Quadrant | DetID | PixID | Counts | Sigma | Mean | Median | Sigma |
| A | 4 | 2 | 91968 | 1003.93 | 449 | 441 | 91.2 |
| A | 13 | 251 | 54658 | 594.69 | 449 | 441 | 91.2 |
| A | 8 | 15 | 26628 | 287.24 | 449 | 441 | 91.2 |
| B | 0 | 214 | 21773 | 244.8 | 457 | 447 | 87.1 |
| B | 4 | 142 | 18041 | 201.96 | 457 | 447 | 87.1 |
| B | 4 | 81 | 15212 | 169.49 | 457 | 447 | 87.1 |
| C | 9 | 247 | 18458 | 174.54 | 440 | 444 | 103.2 |
| C | 9 | 16 | 9370 | 86.49 | 440 | 444 | 103.2 |
| C | 12 | 4 | 5676 | 50.69 | 440 | 444 | 103.2 |
| D | 2 | 33 | 1007410 | 9916.72 | 417 | 406 | 101.5 |
| D | 8 | 195 | 136520 | 1340.42 | 417 | 406 | 101.5 |
| D | 2 | 152 | 24769 | 239.92 | 417 | 406 | 101.5 |
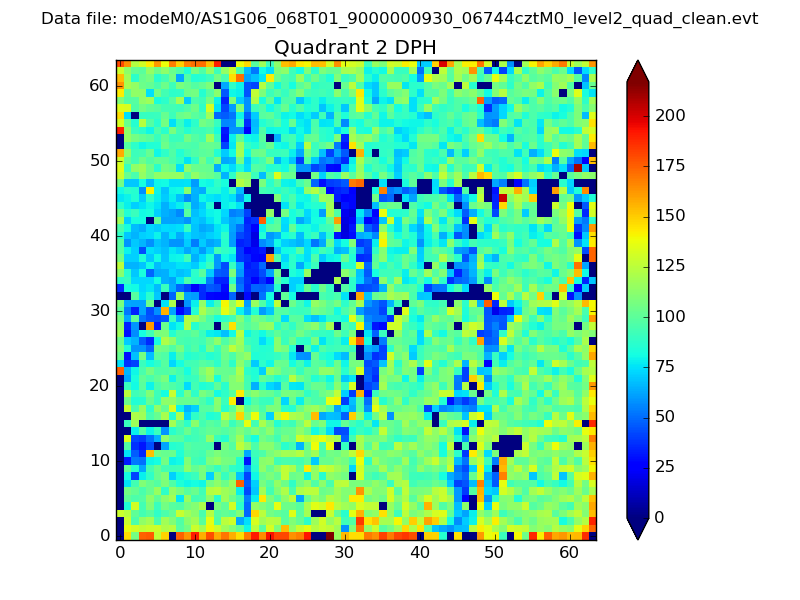
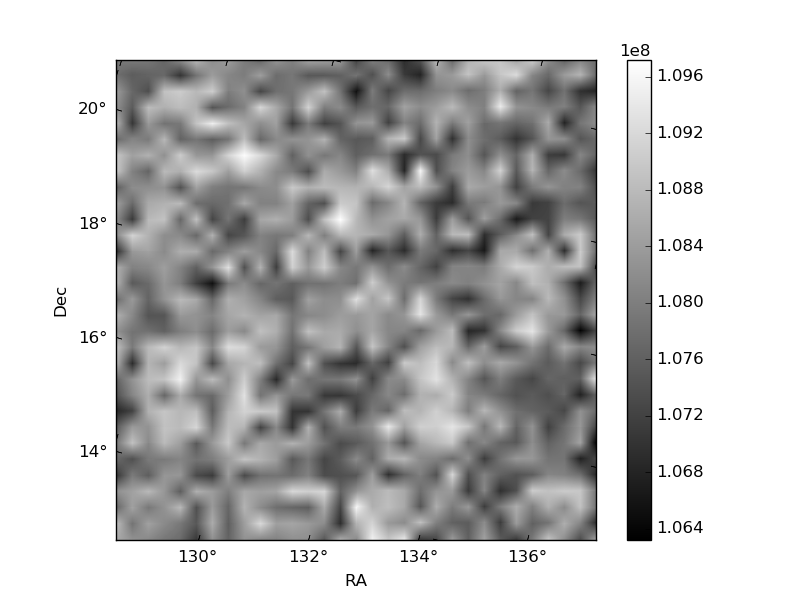
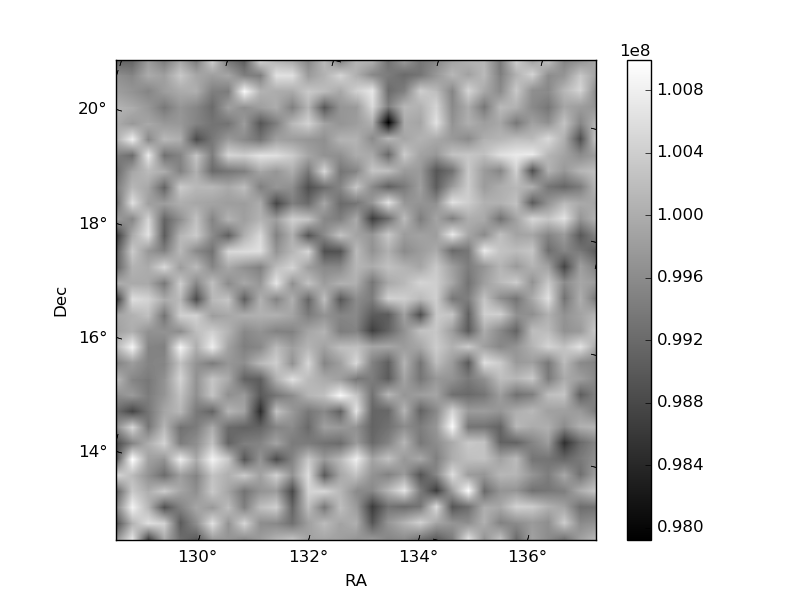
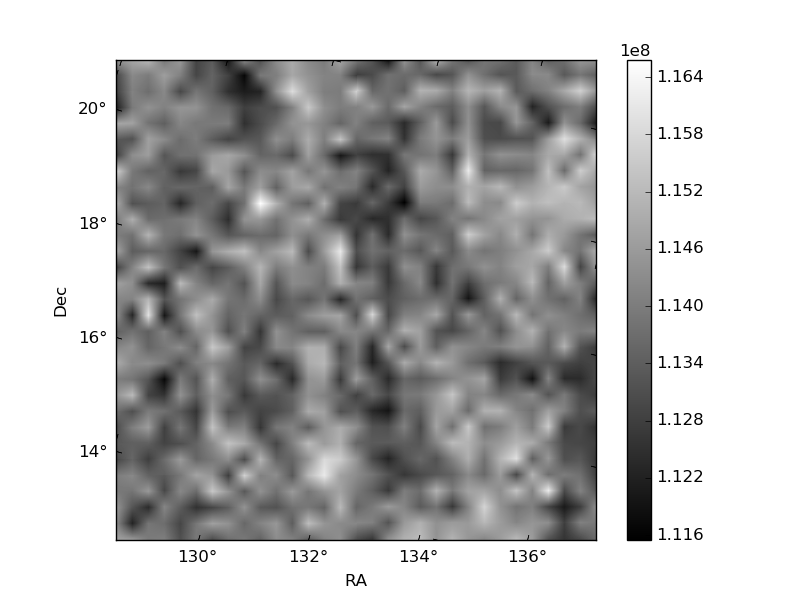
Histogram calculated using DETX and DETY for each event in the final _common_clean file
| Quadrant A | 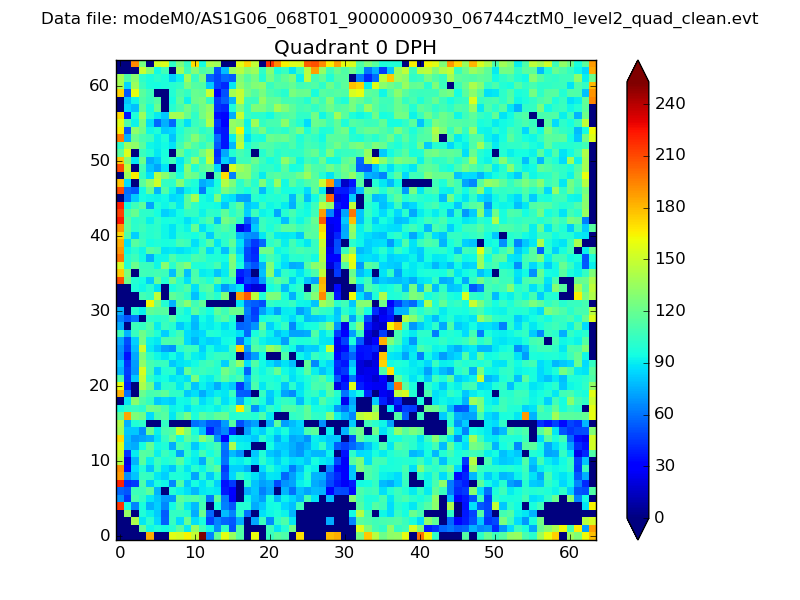 |
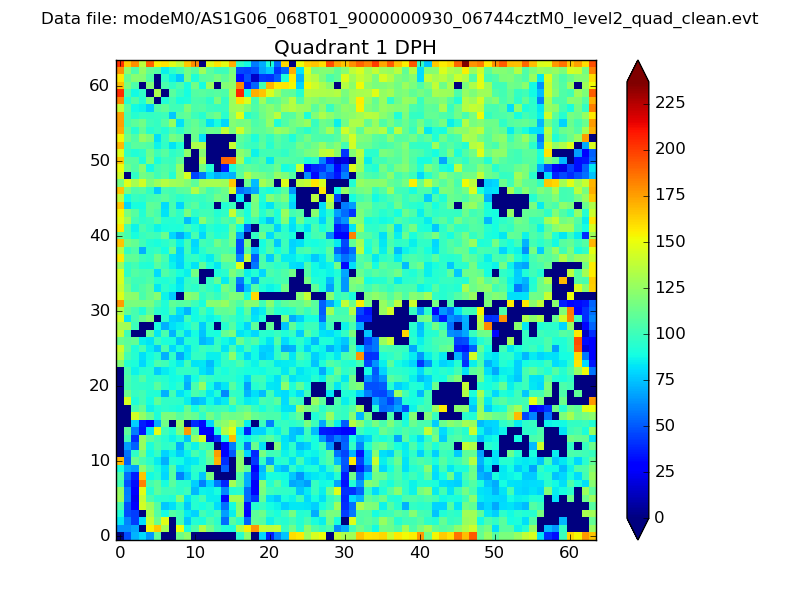 |
Quadrant B |
|---|---|---|---|
| Quadrant D | 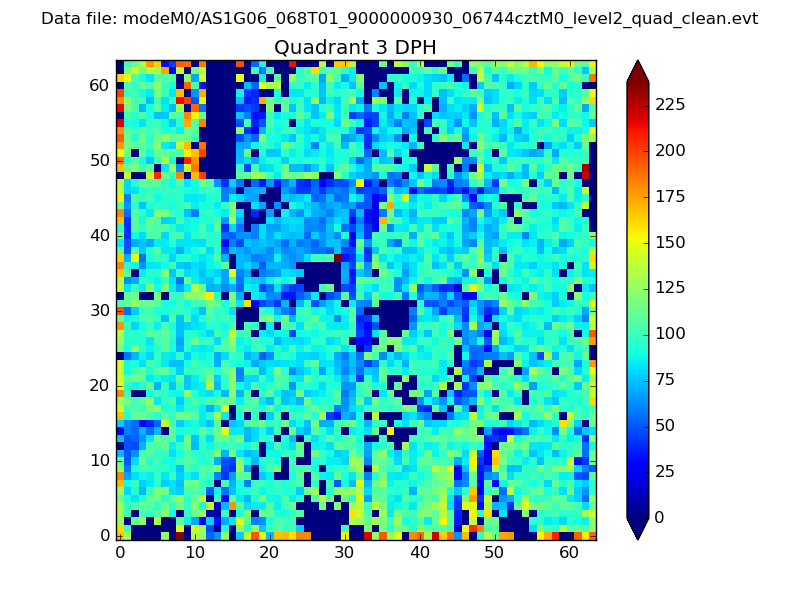 |
 |
Quadrant C |
| Plot type | Count rate plots | Images |
|---|---|---|
| Comparison with Poisson distribution Blue bars denote a histogram of data divided into 1 sec bins. Red curve is a Poisson curve with rate = median count rate of data. |
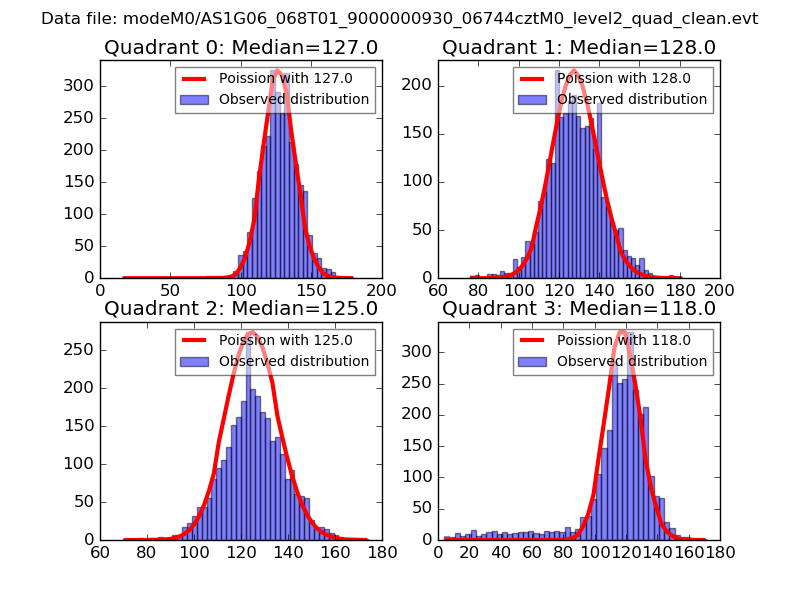 |
 |
| Quadrant-wise count rates Data is divided into 100 sec bins |
 |
|
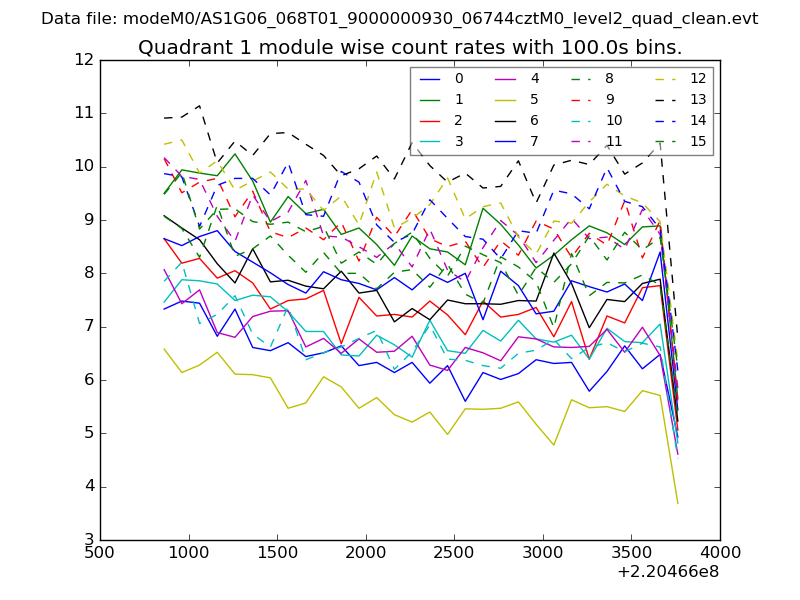
| Module-wise count rates for Quadrant A Data is divided into 100 sec bins |
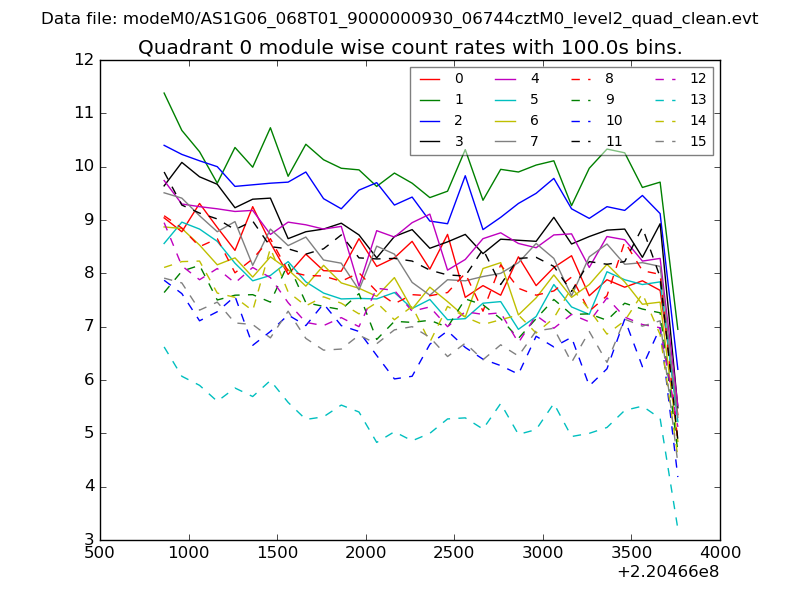 |
 |
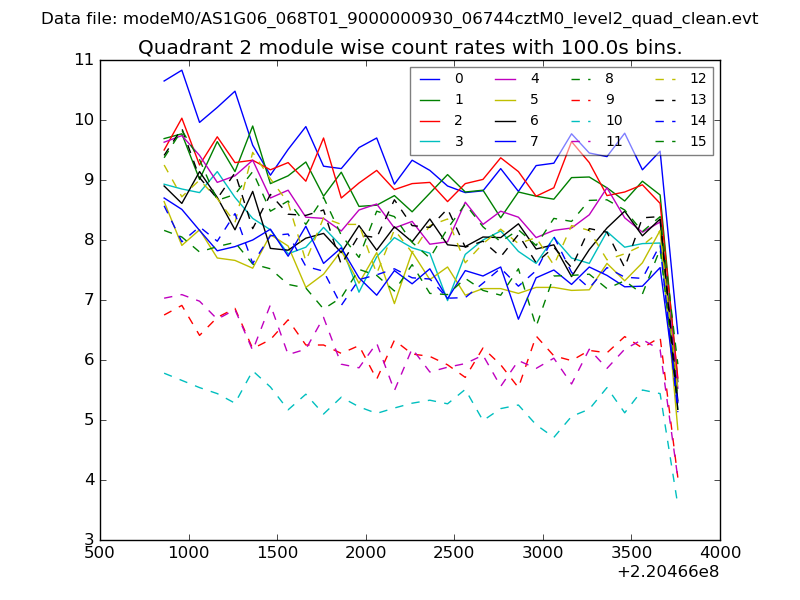
| Module-wise count rates for Quadrant B Data is divided into 100 sec bins |
 |
 |
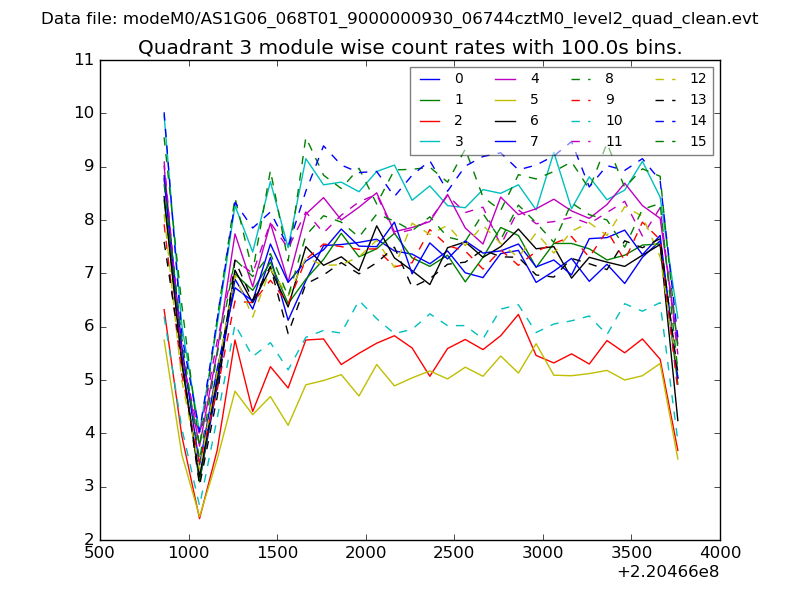
| Module-wise count rates for Quadrant C Data is divided into 100 sec bins |
 |
 |
| Module-wise count rates for Quadrant D Data is divided into 100 sec bins |
 |
 |
| Parameter | Plot |
|---|---|
| CZT HV Monitor | 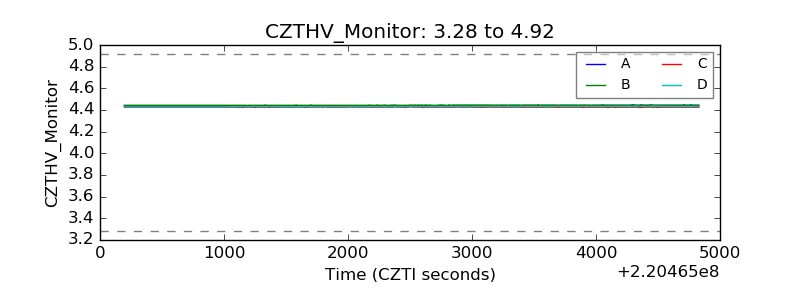 |
| D_VDD | 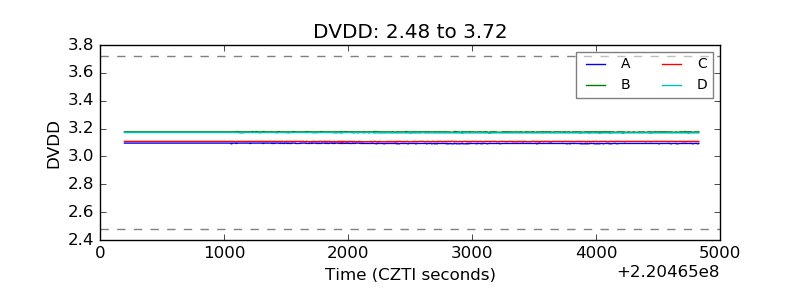 |
| Temperature 1 | 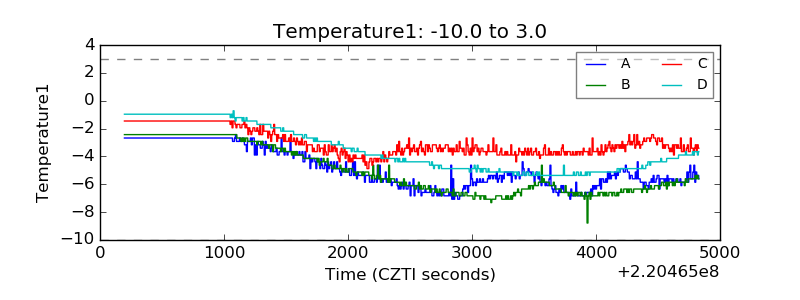 |
| Veto HV Monitor | 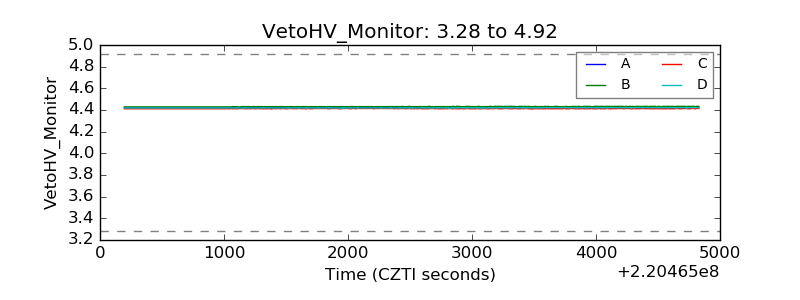 |
| Veto LLD | 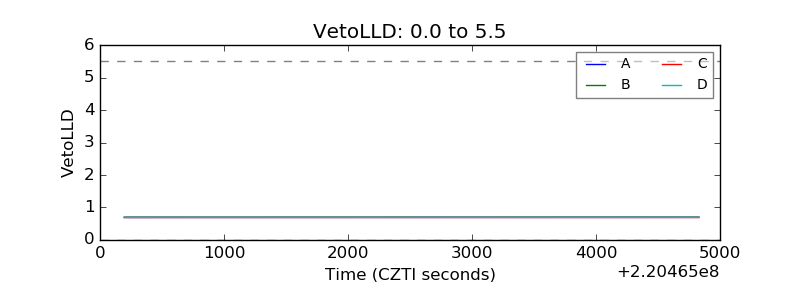 |
| Alpha Counter | 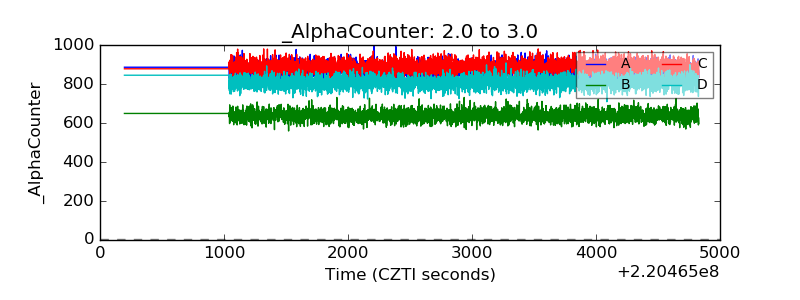 |
| _CPM_Rate | 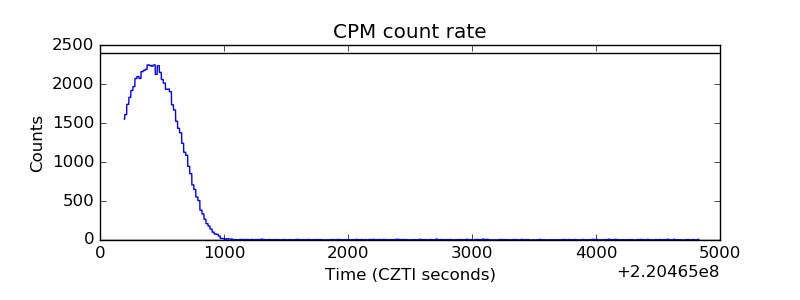 |
| CZT Counter | 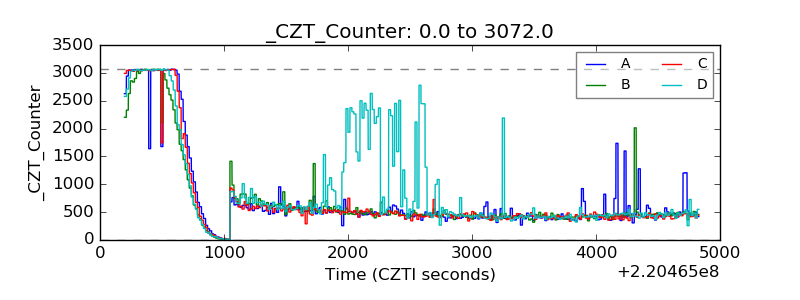 |
| +2.5 Volts monitor | 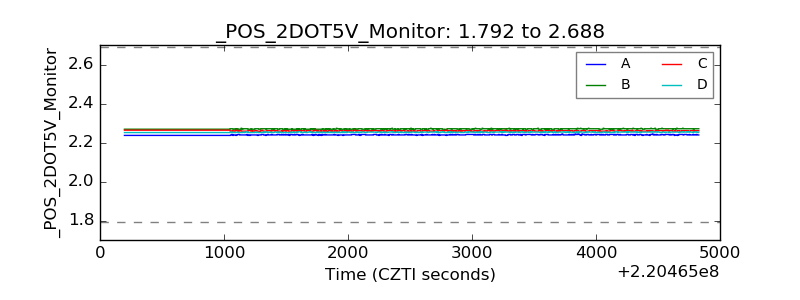 |
| +5 Volts monitor |  |
| _ROLL_ROT | 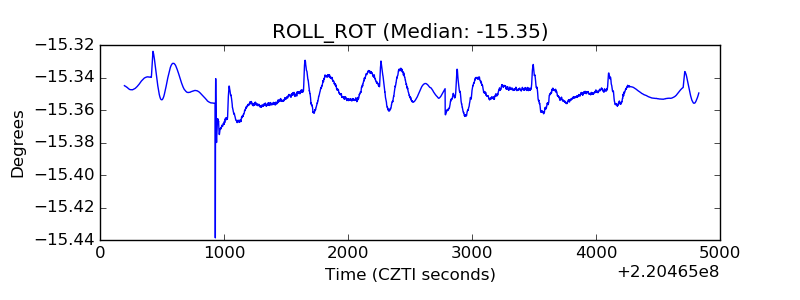 |
| _Roll_DEC | 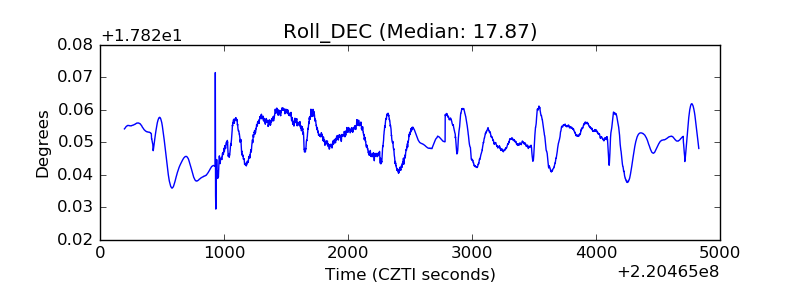 |
| _Roll_RA | 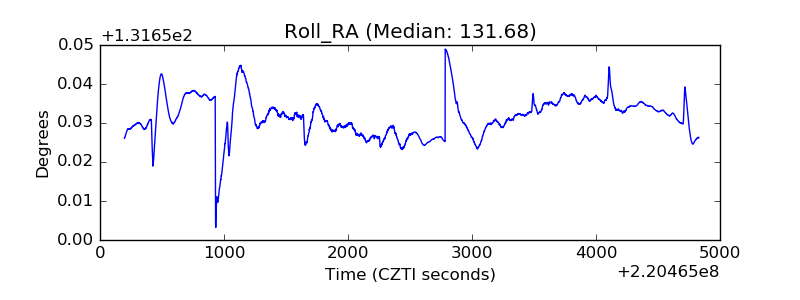 |
| Veto Counter | 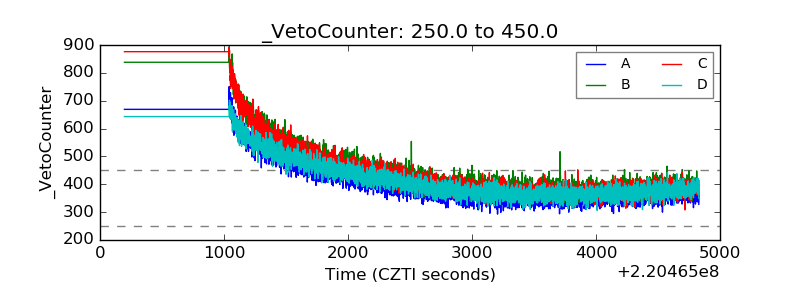 |