| Param | Original file | Final file |
|---|---|---|
| Filename | modeM0/AS1G06_068T01_9000000930_06745cztM0_level2.evt | modeM0/AS1G06_068T01_9000000930_06745cztM0_level2_quad_clean.evt |
| Size (bytes) | 210,530,880 | 54,434,880 |
| Size | 200.8 MB | 51.9 MB |
| Events in quadrant A | 1,408,088 | 370,242 |
| Events in quadrant B | 1,297,762 | 373,488 |
| Events in quadrant C | 1,265,922 | 365,075 |
| Events in quadrant D | 2,203,092 | 330,604 |
| Mode M0 | |||
|---|---|---|---|
| Quadrant | BADHDUFLAG | Total packets | Discarded packets |
| A | 0 | 6233 | 0 |
| B | 0 | 5902 | 0 |
| C | 0 | 5863 | 0 |
| D | 0 | 8615 | 0 |
| Mode SS | |||
|---|---|---|---|
| Quadrant | BADHDUFLAG | Total packets | Discarded packets |
| A | 0 | 58 | 0 |
| B | 0 | 58 | 0 |
| C | 0 | 58 | 0 |
| D | 0 | 58 | 0 |
| Quadrant | Total seconds | Saturated seconds | Saturation percentage |
|---|---|---|---|
| A | 2925 | 11 | 0.376068% |
| B | 2925 | 1 | 0.034188% |
| C | 2925 | 0 | 0.000000% |
| D | 2925 | 347 | 11.863248% |
Noise dominated data is calculated using 1-second bins in cleaned event files. If a bin has >2000 counts, and if more than 50% of those come from <1% of pixels, then it is considered to be noise-dominated and hence unusable.
| Quadrant | # 1 sec bins | Bins with >0 counts | Bins with >2000 counts | High rate bins dominated by noise | Noise dominated (total time) | Noise dominated (detector-on time) | Marked lightcurve |
|---|---|---|---|---|---|---|---|
| A | 2925 | 2925 | 10 | 10 | 0.34% | 0.34% | 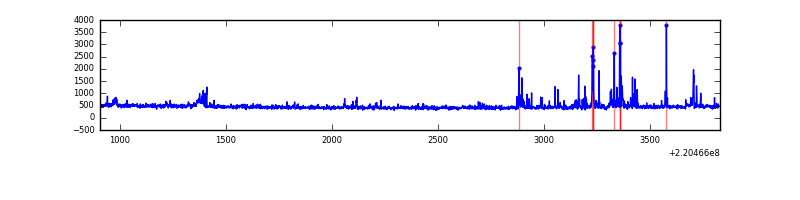 |
| B | 2925 | 2925 | 0 | 0 | 0.00% | 0.00% | 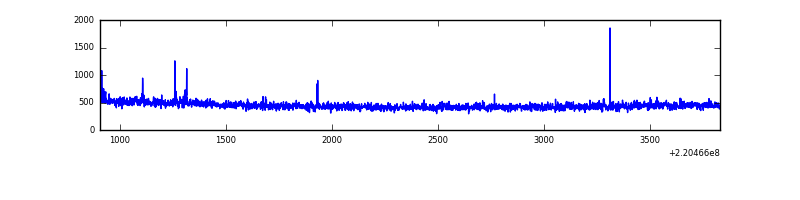 |
| C | 2925 | 2925 | 0 | 0 | 0.00% | 0.00% | 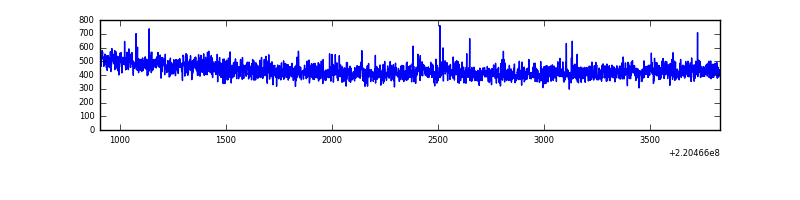 |
| D | 2925 | 2925 | 316 | 316 | 10.80% | 10.80% | 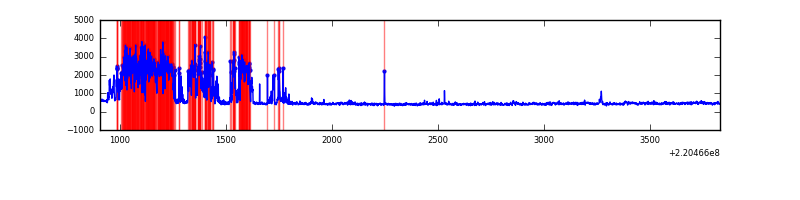 |
Top three noisy pixels from each quadrant. If the there are fewer than three noisy pixels in the level2.evt file, extra rows are filled as -1
| Pixel properties | Quadrant properties | ||||||
|---|---|---|---|---|---|---|---|
| Quadrant | DetID | PixID | Counts | Sigma | Mean | Median | Sigma |
| A | 4 | 2 | 91384 | 1359.66 | 323 | 319 | 67.0 |
| A | 13 | 251 | 48047 | 712.61 | 323 | 319 | 67.0 |
| A | 8 | 15 | 21660 | 318.63 | 323 | 319 | 67.0 |
| B | 12 | 111 | 6207 | 92.14 | 329 | 322 | 63.9 |
| B | 0 | 214 | 5830 | 86.23 | 329 | 322 | 63.9 |
| B | 11 | 111 | 4749 | 69.31 | 329 | 322 | 63.9 |
| C | 9 | 247 | 15682 | 203.85 | 318 | 321 | 75.4 |
| C | 12 | 4 | 5244 | 65.33 | 318 | 321 | 75.4 |
| C | 13 | 61 | 2474 | 28.57 | 318 | 321 | 75.4 |
| D | 2 | 33 | 966057 | 13287.17 | 295 | 287 | 72.7 |
| D | 8 | 195 | 91514 | 1255.11 | 295 | 287 | 72.7 |
| D | 2 | 14 | 18797 | 254.66 | 295 | 287 | 72.7 |
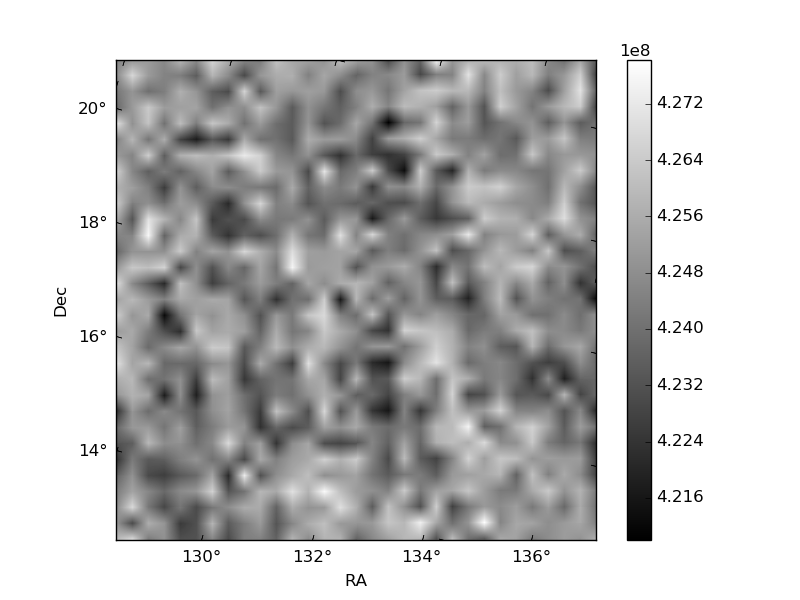
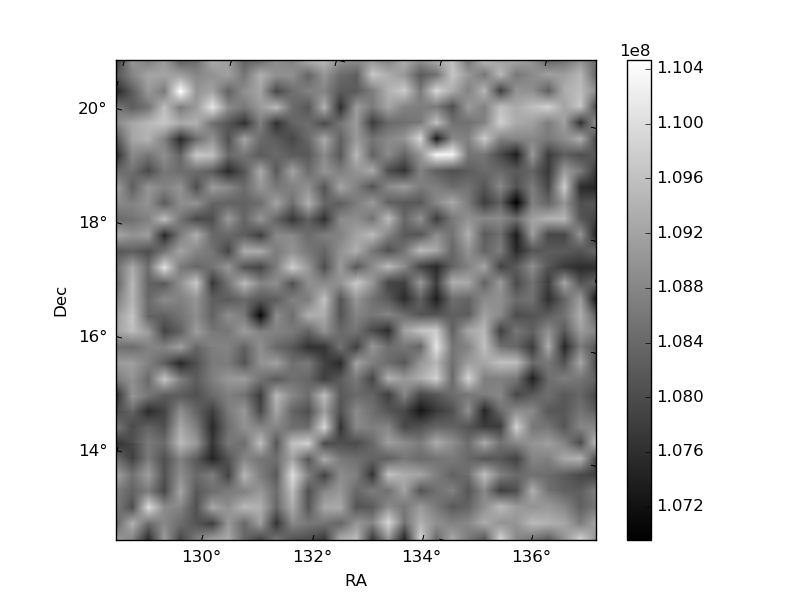
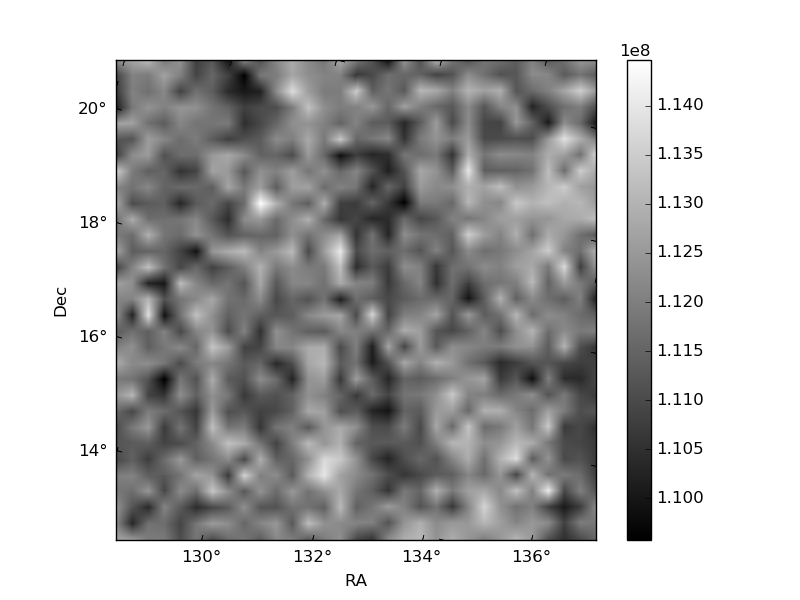
Histogram calculated using DETX and DETY for each event in the final _common_clean file
| Quadrant A | 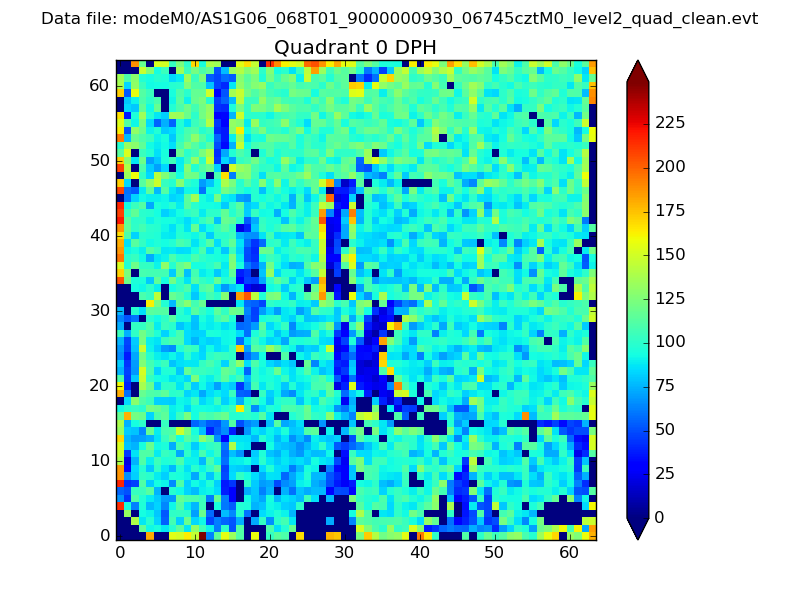 |
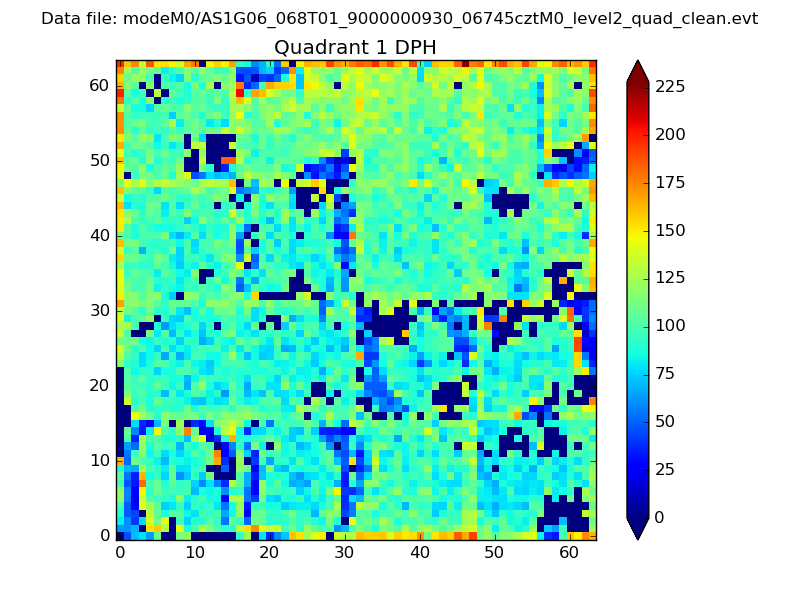 |
Quadrant B |
|---|---|---|---|
| Quadrant D | 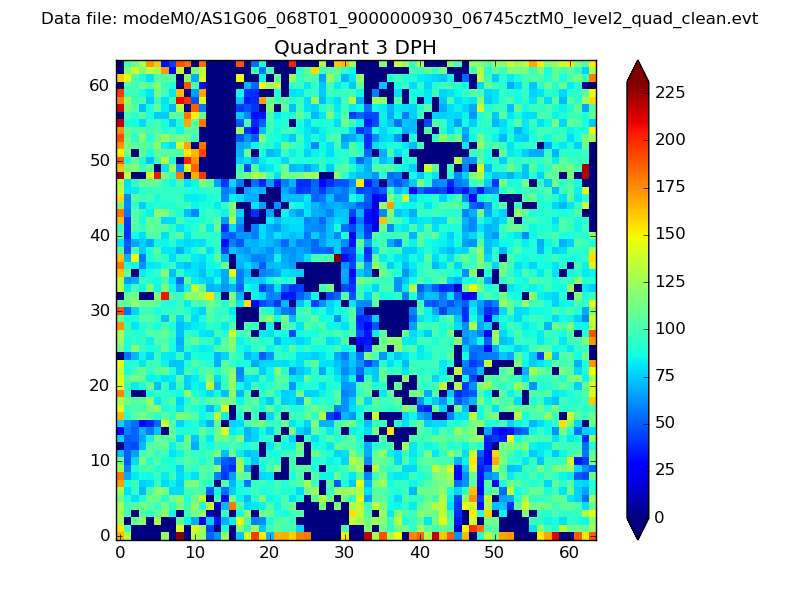 |
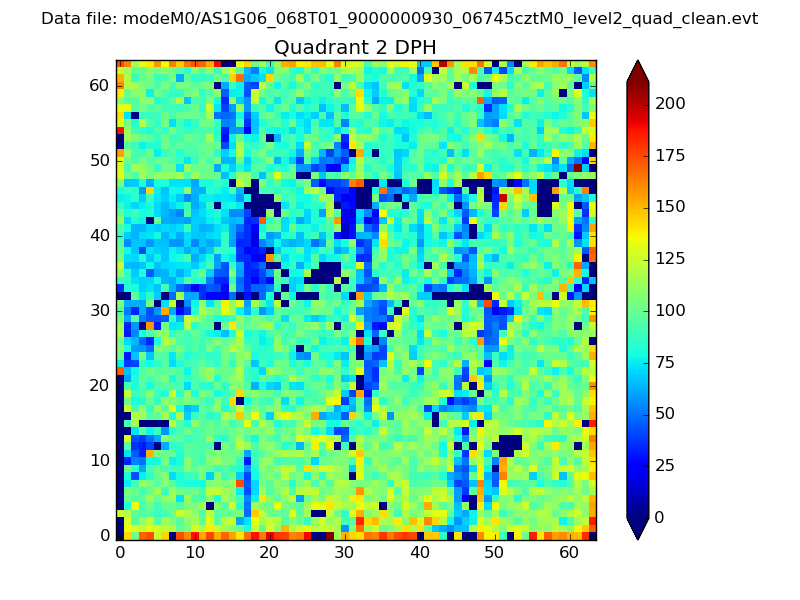 |
Quadrant C |
| Plot type | Count rate plots | Images |
|---|---|---|
| Comparison with Poisson distribution Blue bars denote a histogram of data divided into 1 sec bins. Red curve is a Poisson curve with rate = median count rate of data. |
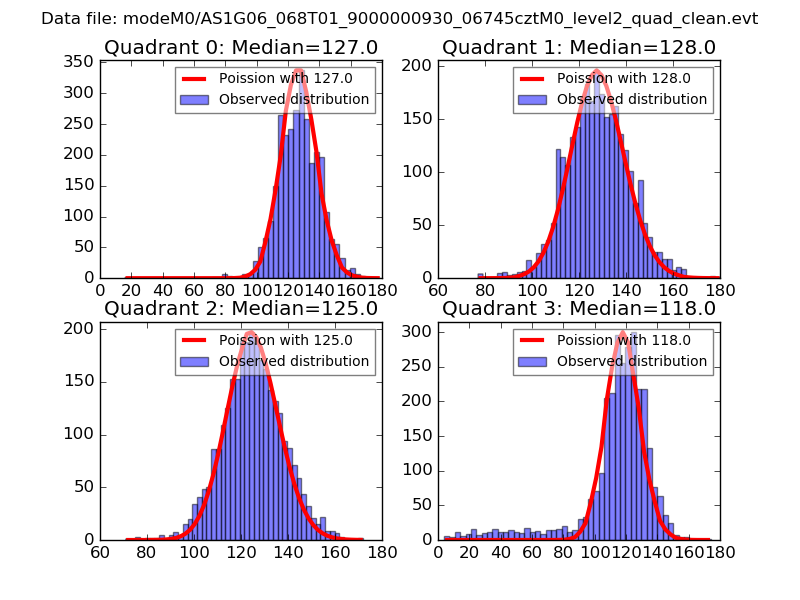 |
 |
| Quadrant-wise count rates Data is divided into 100 sec bins |
 |
|
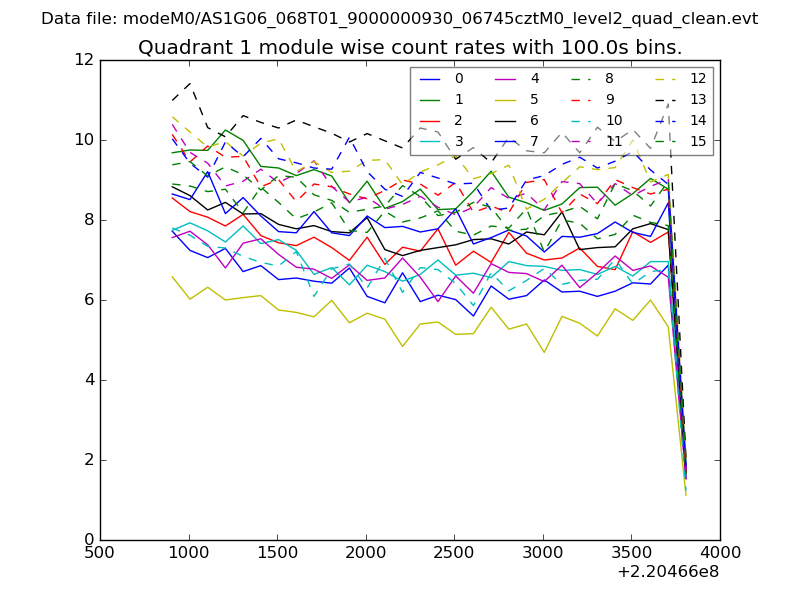
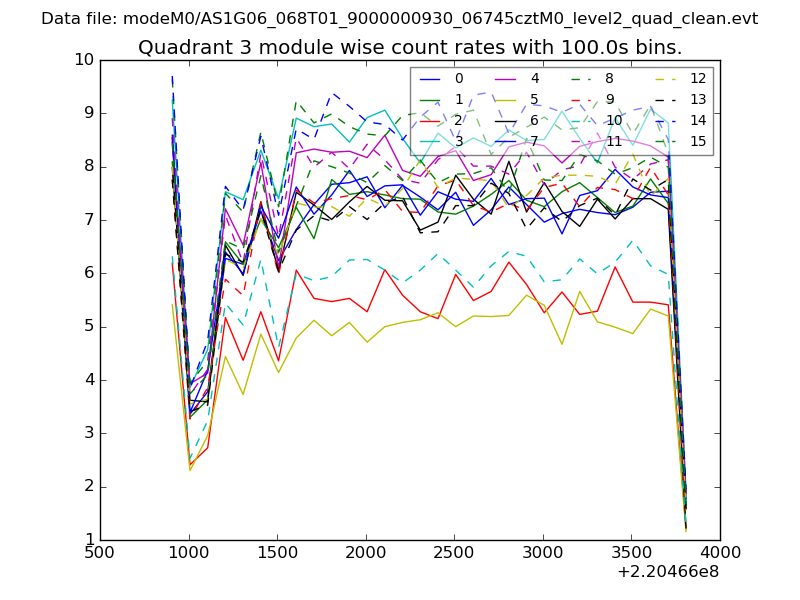
| Module-wise count rates for Quadrant A Data is divided into 100 sec bins |
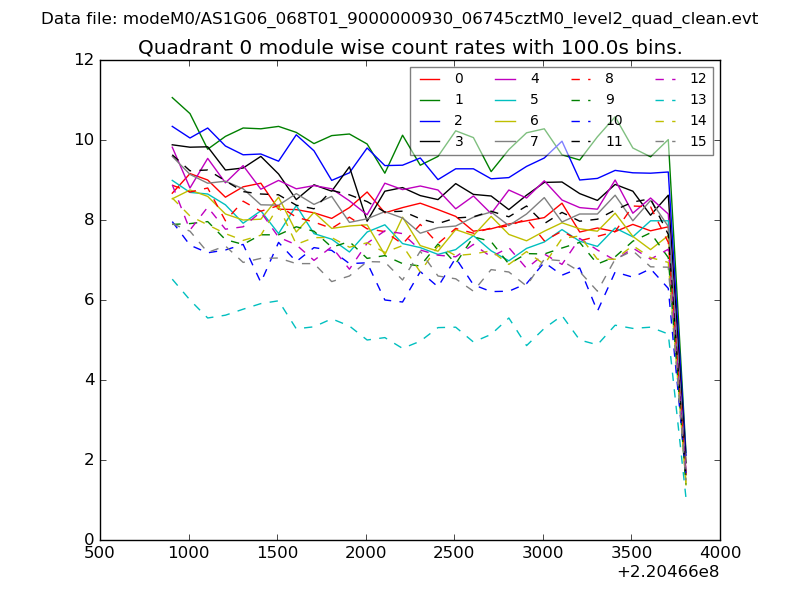 |
 |
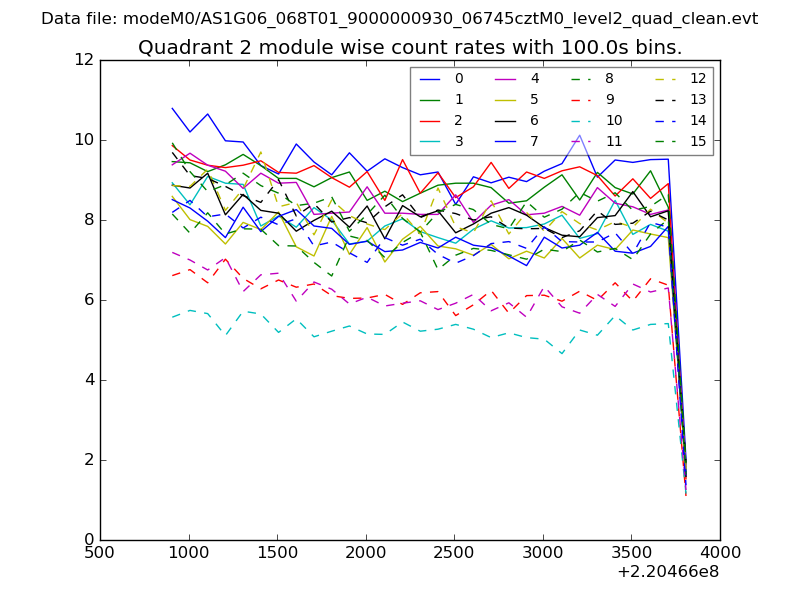
| Module-wise count rates for Quadrant B Data is divided into 100 sec bins |
 |
 |
| Module-wise count rates for Quadrant C Data is divided into 100 sec bins |
 |
 |
| Module-wise count rates for Quadrant D Data is divided into 100 sec bins |
 |
 |
| Parameter | Plot |
|---|---|
| CZT HV Monitor | 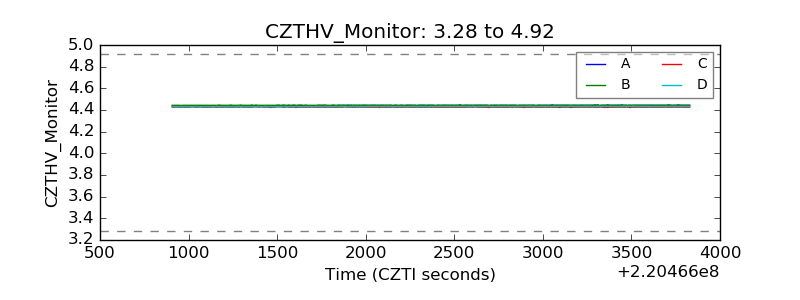 |
| D_VDD |  |
| Temperature 1 | 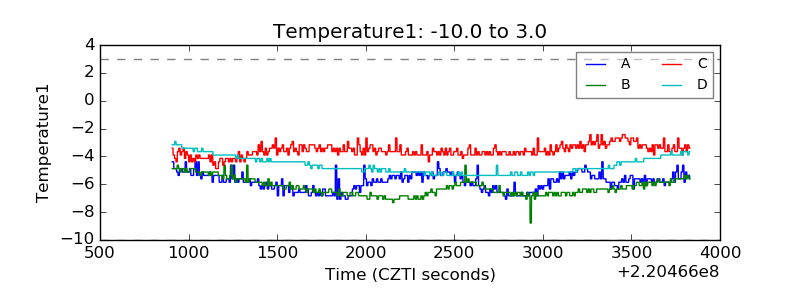 |
| Veto HV Monitor | 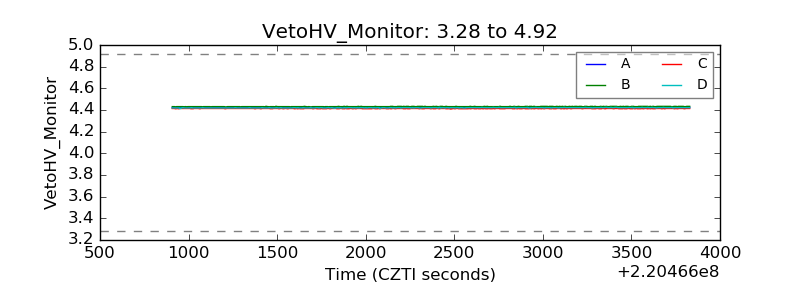 |
| Veto LLD | 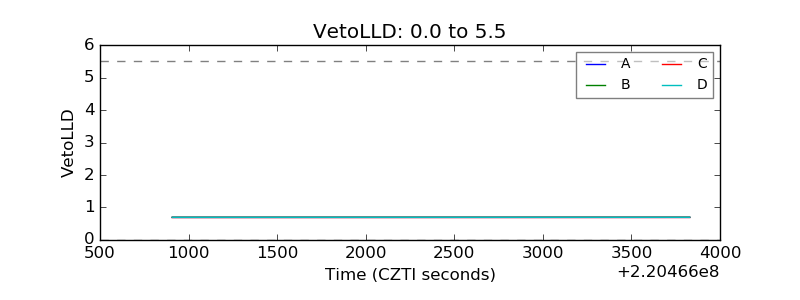 |
| Alpha Counter | 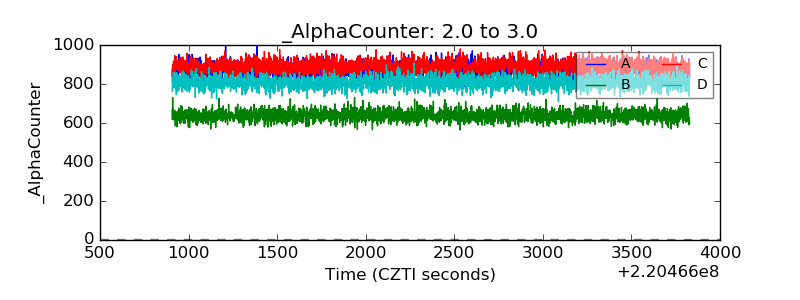 |
| _CPM_Rate | 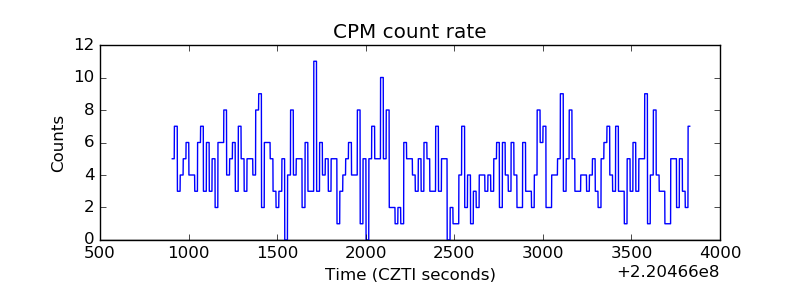 |
| CZT Counter | 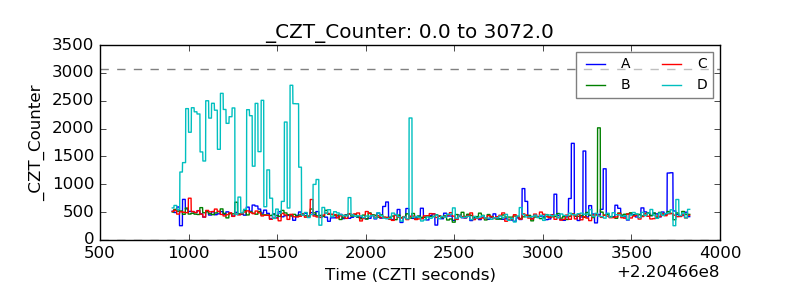 |
| +2.5 Volts monitor | 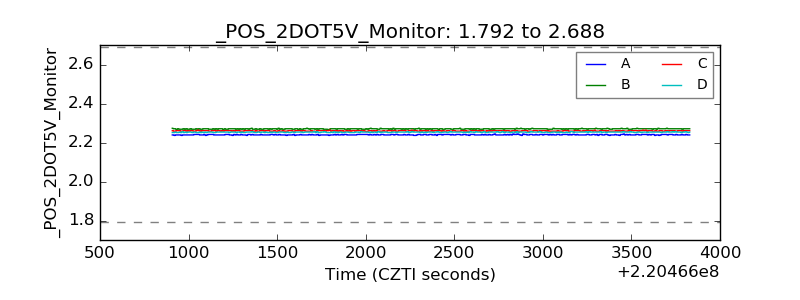 |
| +5 Volts monitor |  |
| _ROLL_ROT | 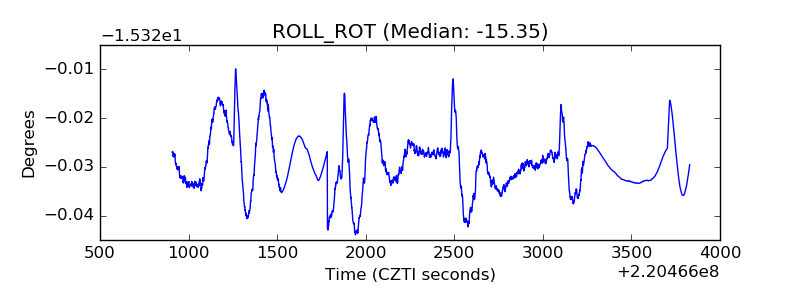 |
| _Roll_DEC | 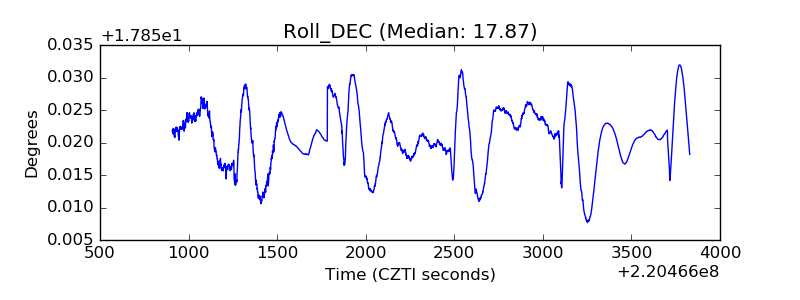 |
| _Roll_RA | 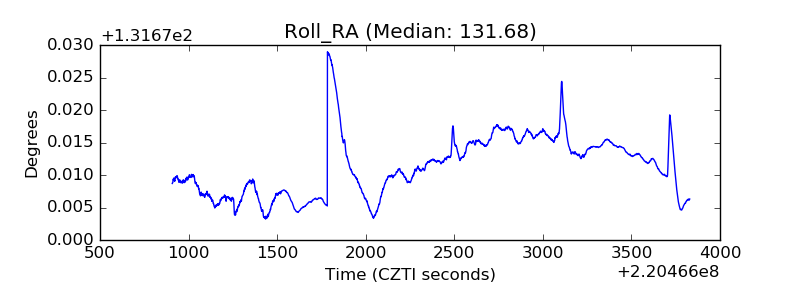 |
| Veto Counter | 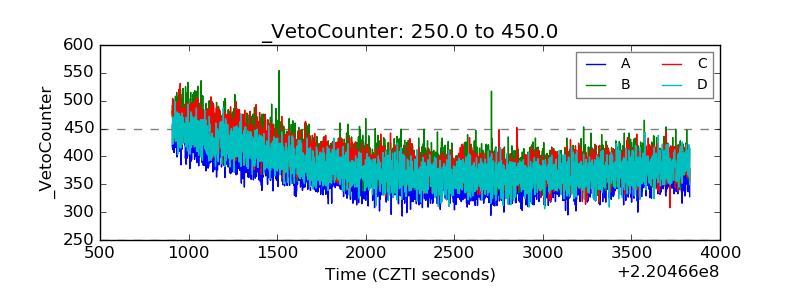 |