| Param | Original file | Final file |
|---|---|---|
| Filename | modeM0/AS1G06_087T01_9000000926_06736cztM0_level2.evt | modeM0/AS1G06_087T01_9000000926_06736cztM0_level2_quad_clean.evt |
| Size (bytes) | 484,588,800 | 72,057,600 |
| Size | 462.1 MB | 68.7 MB |
| Events in quadrant A | 4,817,190 | 391,816 |
| Events in quadrant B | 2,883,406 | 463,810 |
| Events in quadrant C | 2,762,006 | 459,466 |
| Events in quadrant D | 3,795,880 | 437,535 |
| Mode SS | |||
|---|---|---|---|
| Quadrant | BADHDUFLAG | Total packets | Discarded packets |
| A | 0 | 126 | 0 |
| B | 0 | 126 | 0 |
| C | 0 | 126 | 0 |
| D | 0 | 126 | 0 |
| Mode M9 | |||
|---|---|---|---|
| Quadrant | BADHDUFLAG | Total packets | Discarded packets |
| A | 0 | 3 | 0 |
| B | 0 | 3 | 0 |
| C | 0 | 3 | 0 |
| D | 0 | 3 | 0 |
| Mode M0 | |||
|---|---|---|---|
| Quadrant | BADHDUFLAG | Total packets | Discarded packets |
| A | 0 | 18466 | 2 |
| B | 0 | 12762 | 1 |
| C | 0 | 12700 | 1 |
| D | 0 | 15237 | 1 |
| Quadrant | Total seconds | Saturated seconds | Saturation percentage |
|---|---|---|---|
| A | 6133 | 962 | 15.685635% |
| B | 6133 | 178 | 2.902332% |
| C | 6133 | 165 | 2.690364% |
| D | 6133 | 243 | 3.962172% |
Noise dominated data is calculated using 1-second bins in cleaned event files. If a bin has >2000 counts, and if more than 50% of those come from <1% of pixels, then it is considered to be noise-dominated and hence unusable.
| Quadrant | # 1 sec bins | Bins with >0 counts | Bins with >2000 counts | High rate bins dominated by noise | Noise dominated (total time) | Noise dominated (detector-on time) | Marked lightcurve |
|---|---|---|---|---|---|---|---|
| A | 6413 | 6134 | 638 | 638 | 9.95% | 10.40% | 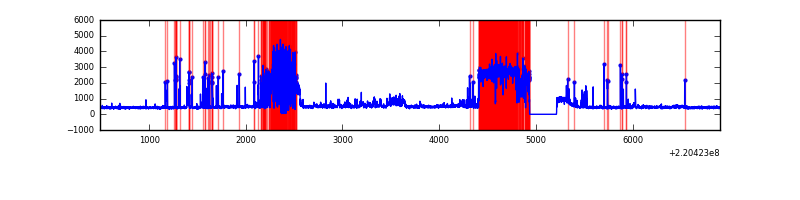 |
| B | 6413 | 6134 | 2 | 2 | 0.03% | 0.03% | 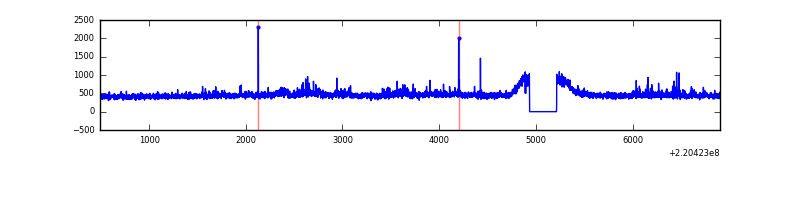 |
| C | 6413 | 6134 | 1 | 1 | 0.02% | 0.02% | 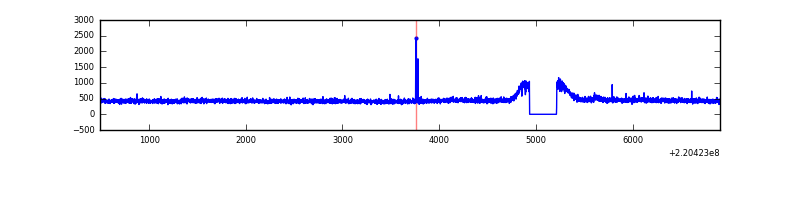 |
| D | 6413 | 6134 | 78 | 78 | 1.22% | 1.27% | 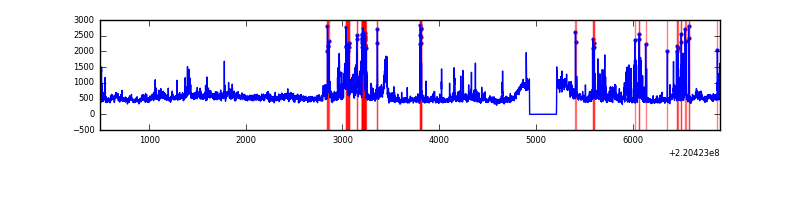 |
Top three noisy pixels from each quadrant. If the there are fewer than three noisy pixels in the level2.evt file, extra rows are filled as -1
| Pixel properties | Quadrant properties | ||||||
|---|---|---|---|---|---|---|---|
| Quadrant | DetID | PixID | Counts | Sigma | Mean | Median | Sigma |
| A | 14 | 111 | 2235057 | 16992.56 | 638 | 623 | 131.5 |
| A | 8 | 15 | 126053 | 953.88 | 638 | 623 | 131.5 |
| A | 0 | 226 | 5961 | 40.59 | 638 | 623 | 131.5 |
| B | 4 | 81 | 67498 | 484.49 | 709 | 690 | 137.9 |
| B | 15 | 204 | 39209 | 279.34 | 709 | 690 | 137.9 |
| B | 0 | 214 | 20718 | 145.24 | 709 | 690 | 137.9 |
| C | 9 | 16 | 28044 | 169.74 | 689 | 689 | 161.2 |
| C | 10 | 22 | 12002 | 70.2 | 689 | 689 | 161.2 |
| C | 8 | 128 | 11613 | 67.78 | 689 | 689 | 161.2 |
| D | 8 | 195 | 446323 | 2663.65 | 684 | 661 | 167.3 |
| D | 2 | 33 | 306150 | 1825.86 | 684 | 661 | 167.3 |
| D | 14 | 34 | 258747 | 1542.54 | 684 | 661 | 167.3 |
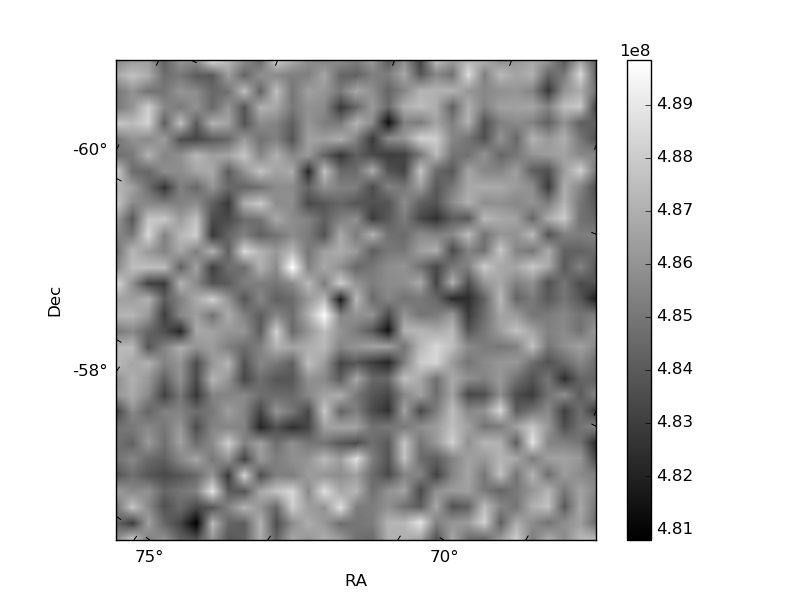
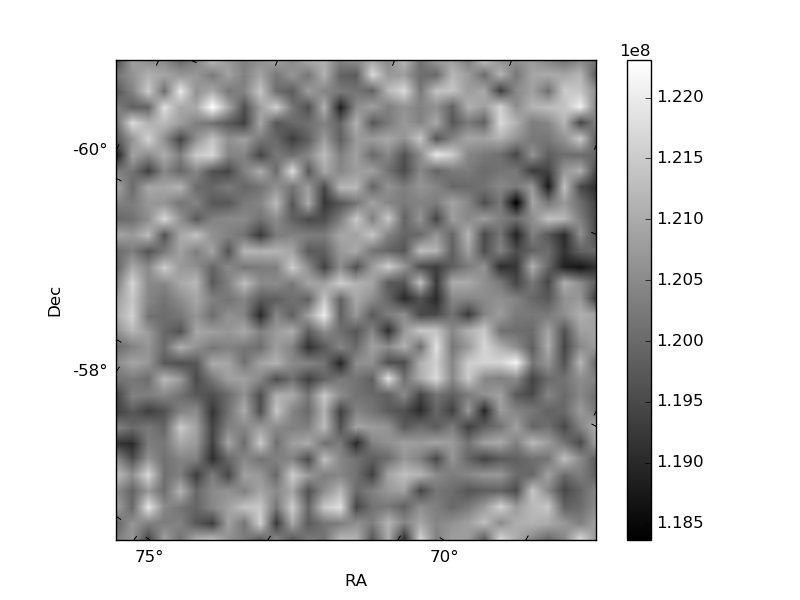
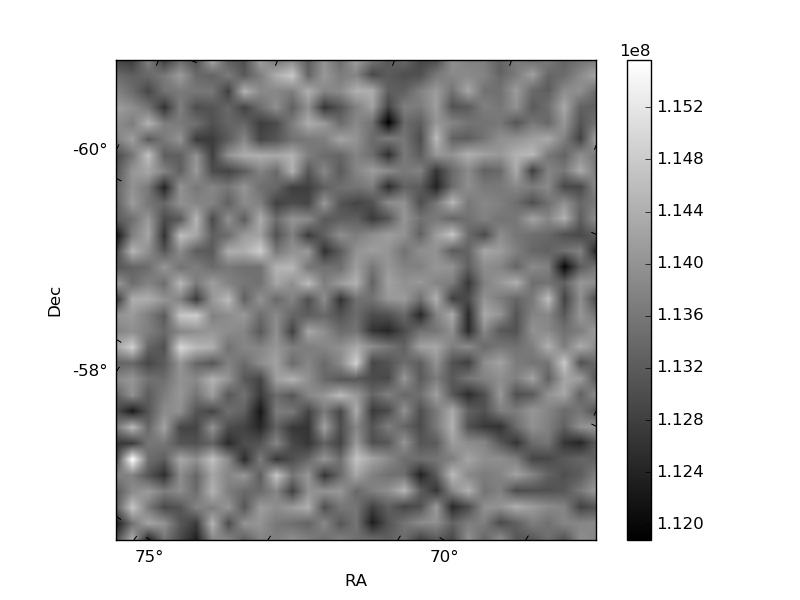
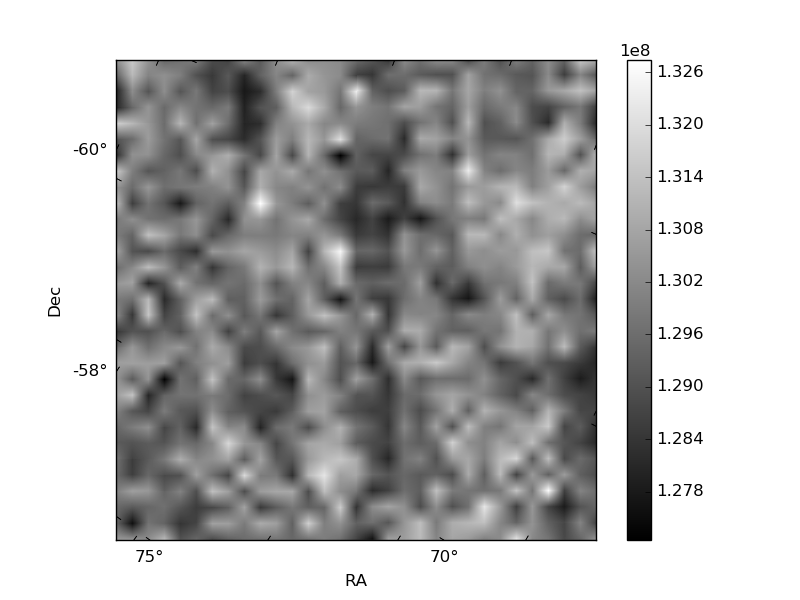
Histogram calculated using DETX and DETY for each event in the final _common_clean file
| Quadrant A | 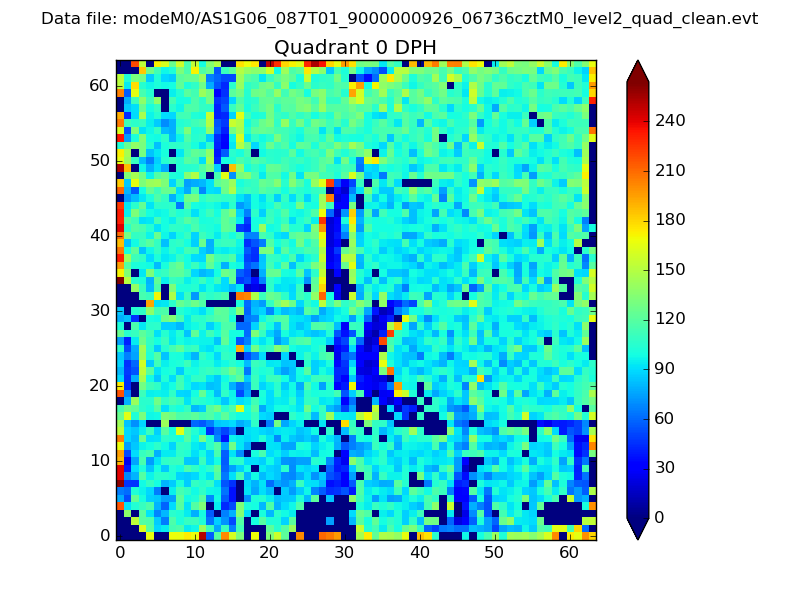 |
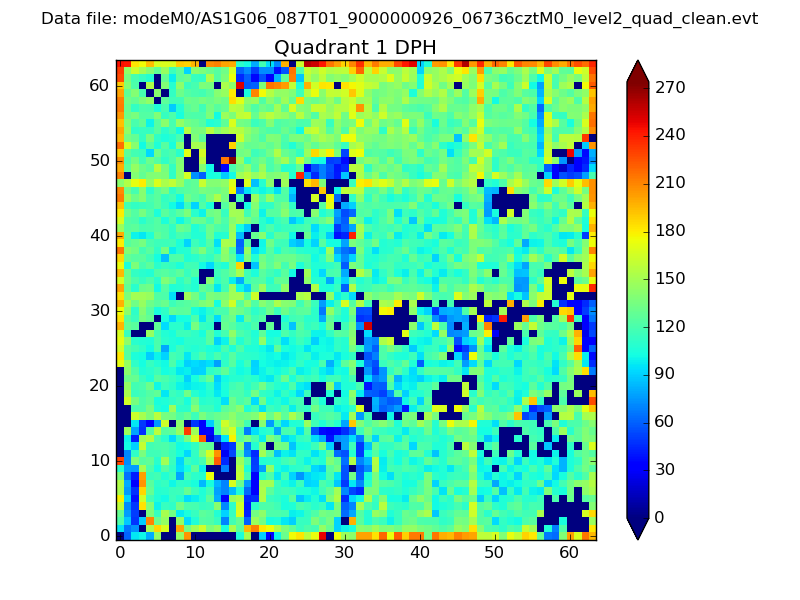 |
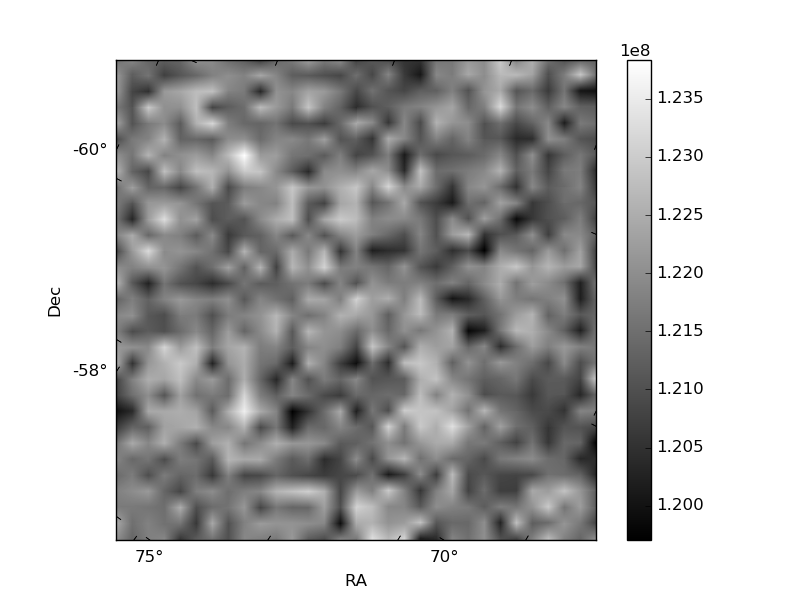
Quadrant B |
|---|---|---|---|
| Quadrant D | 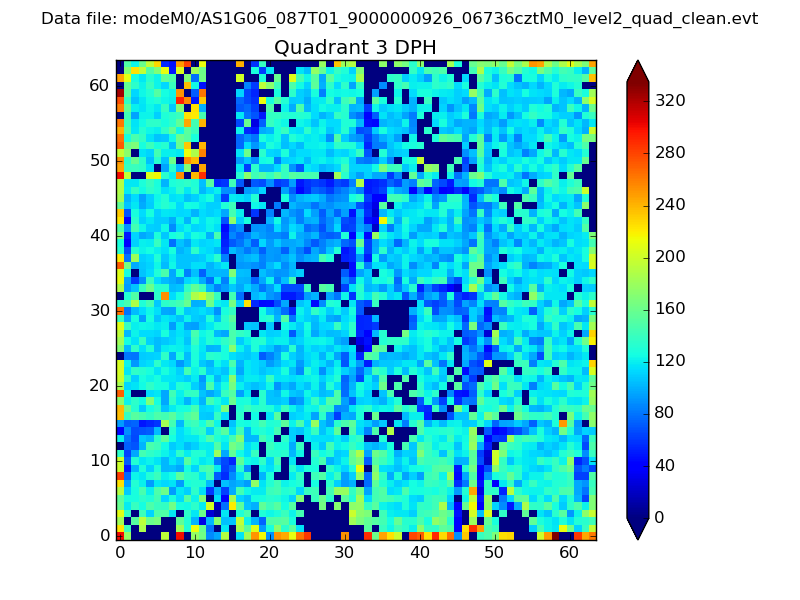 |
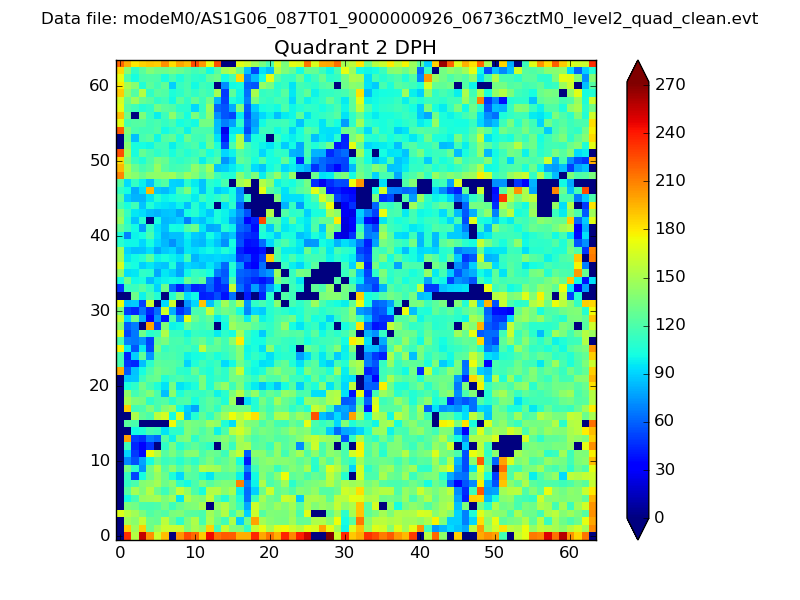 |
Quadrant C |
| Plot type | Count rate plots | Images |
|---|---|---|
| Comparison with Poisson distribution Blue bars denote a histogram of data divided into 1 sec bins. Red curve is a Poisson curve with rate = median count rate of data. |
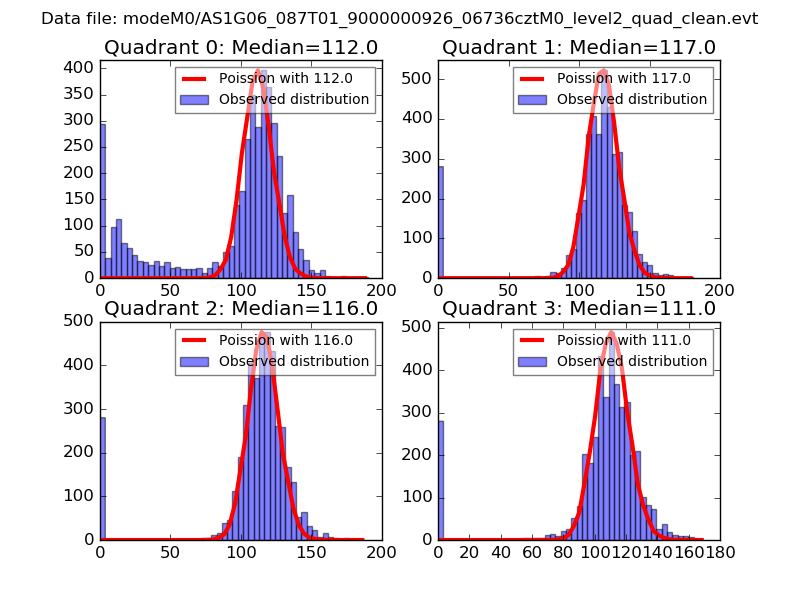 |
 |
| Quadrant-wise count rates Data is divided into 100 sec bins |
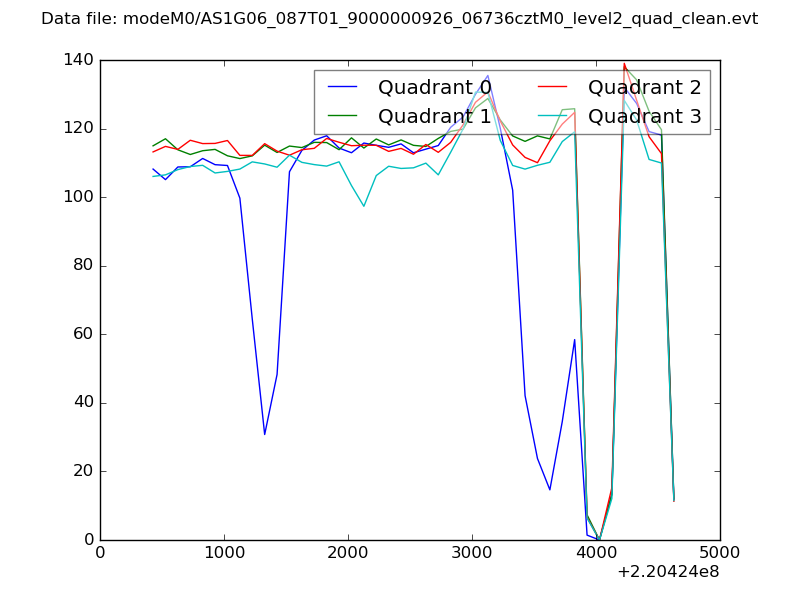 |
|
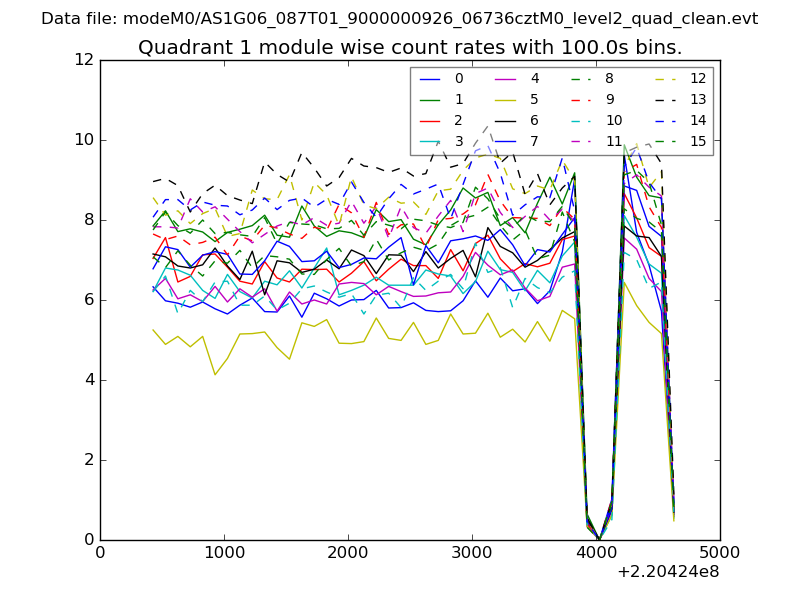
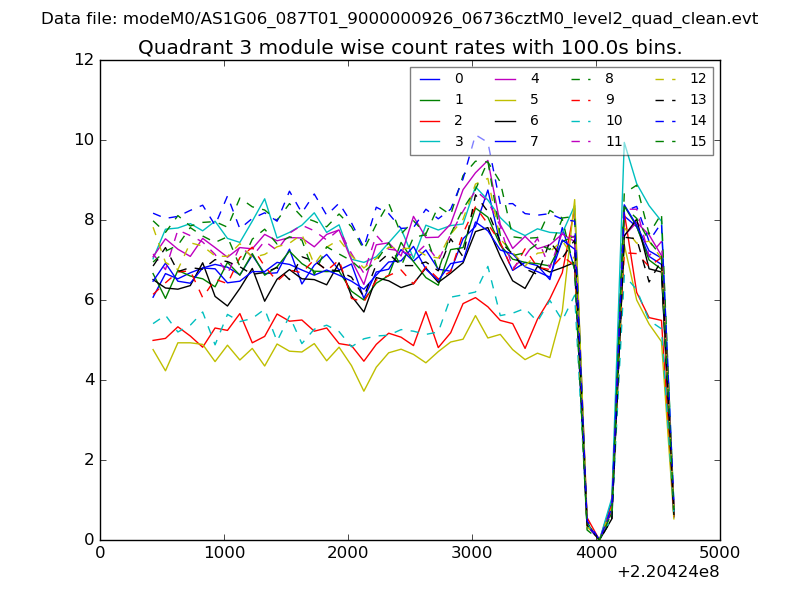
| Module-wise count rates for Quadrant A Data is divided into 100 sec bins |
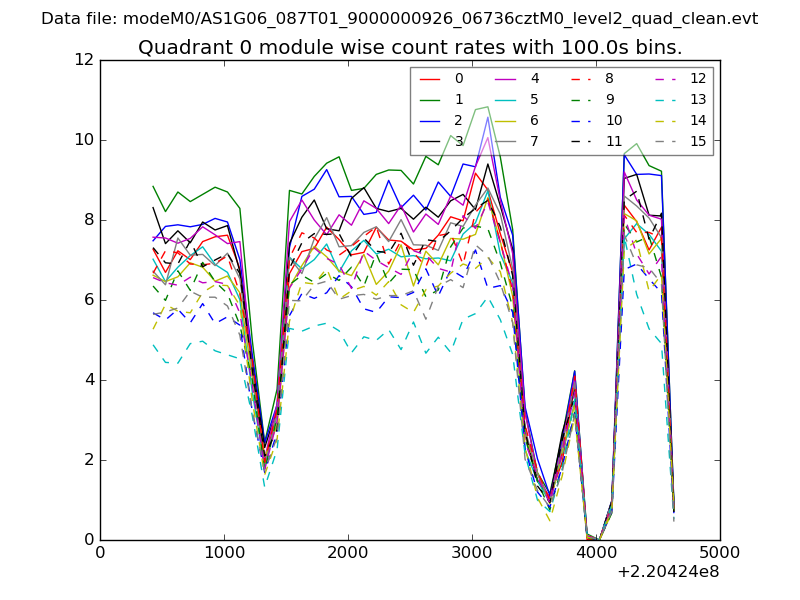 |
 |
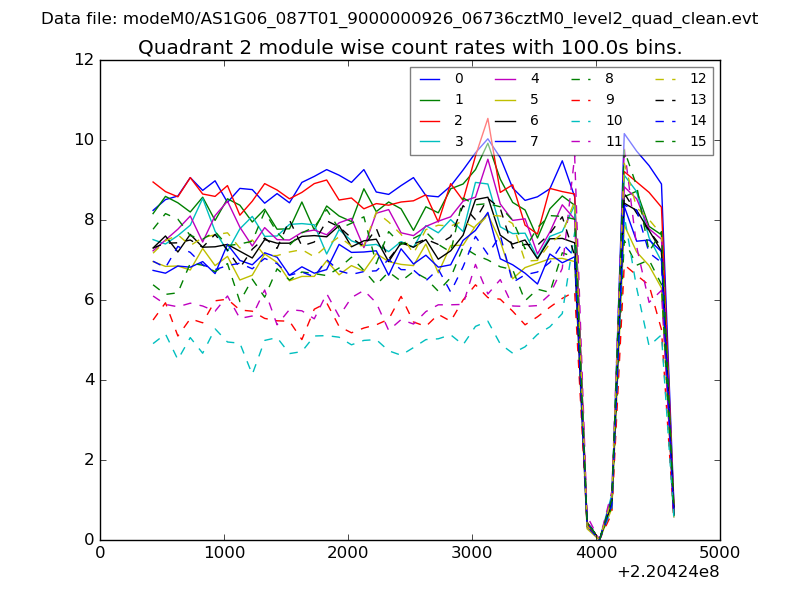
| Module-wise count rates for Quadrant B Data is divided into 100 sec bins |
 |
 |
| Module-wise count rates for Quadrant C Data is divided into 100 sec bins |
 |
 |
| Module-wise count rates for Quadrant D Data is divided into 100 sec bins |
 |
 |
| Parameter | Plot |
|---|---|
| CZT HV Monitor | 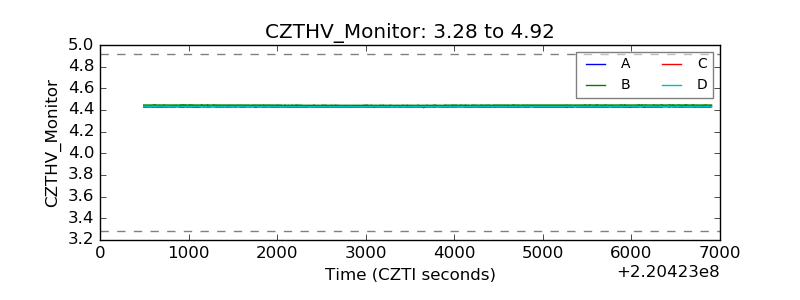 |
| D_VDD | 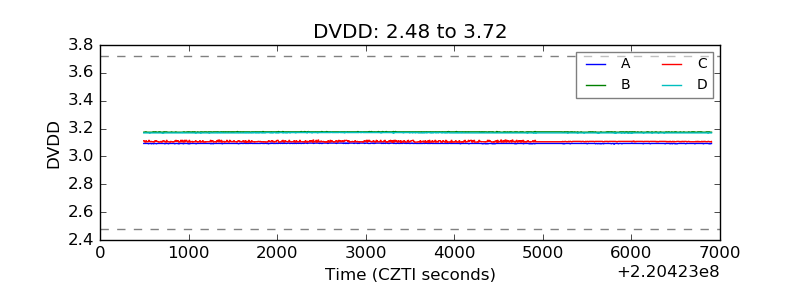 |
| Temperature 1 | 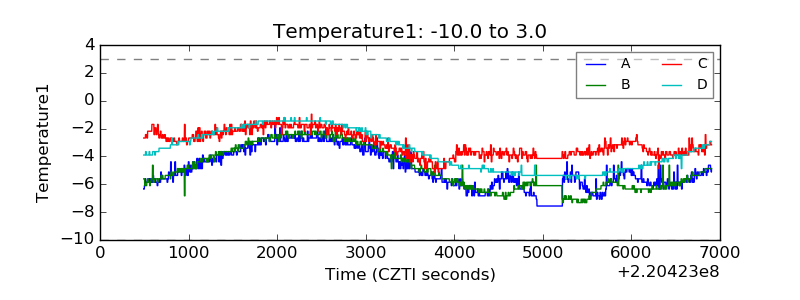 |
| Veto HV Monitor | 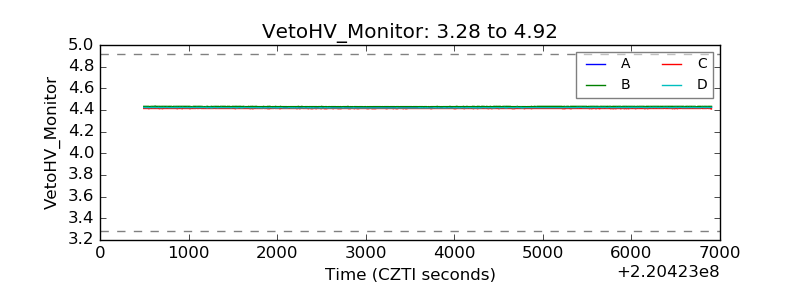 |
| Veto LLD | 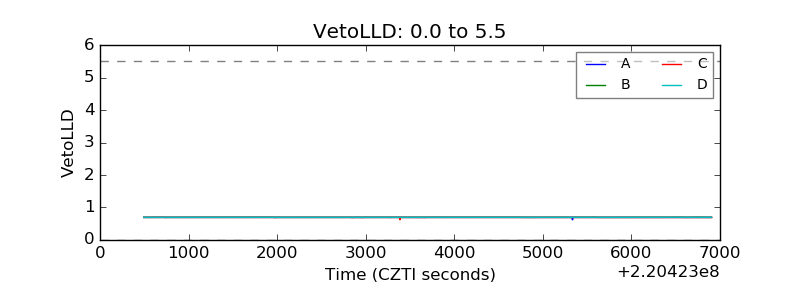 |
| Alpha Counter | 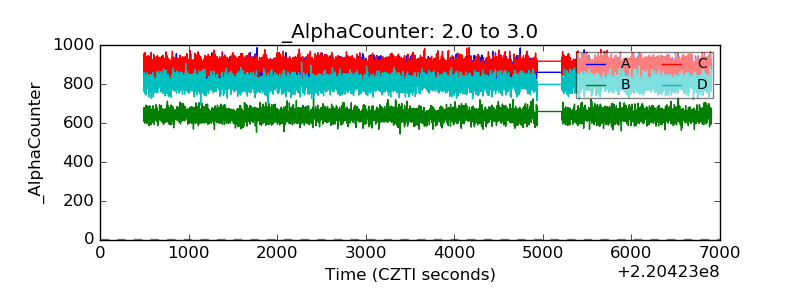 |
| _CPM_Rate | 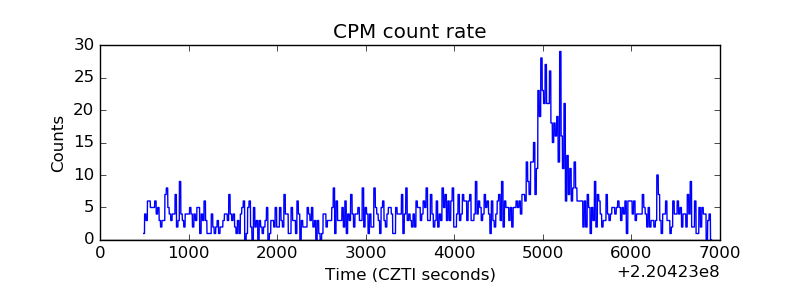 |
| CZT Counter | 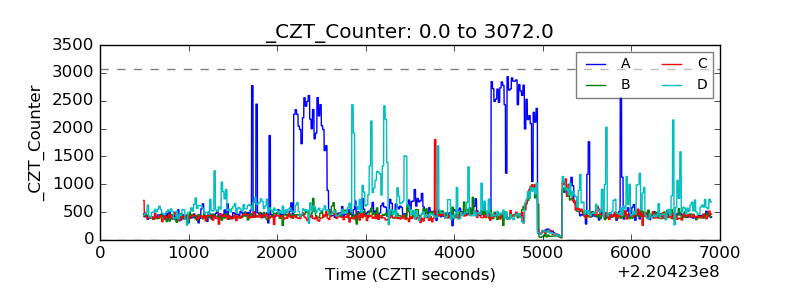 |
| +2.5 Volts monitor |  |
| +5 Volts monitor |  |
| _ROLL_ROT | 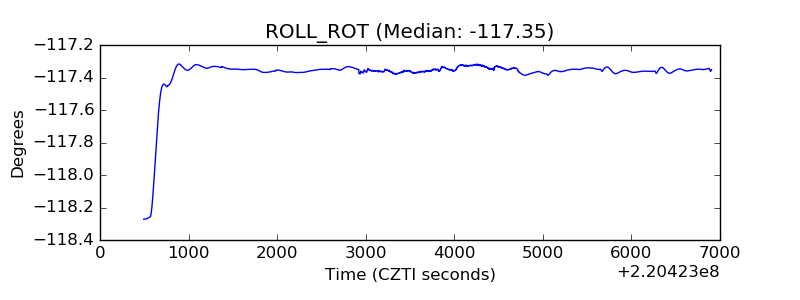 |
| _Roll_DEC | 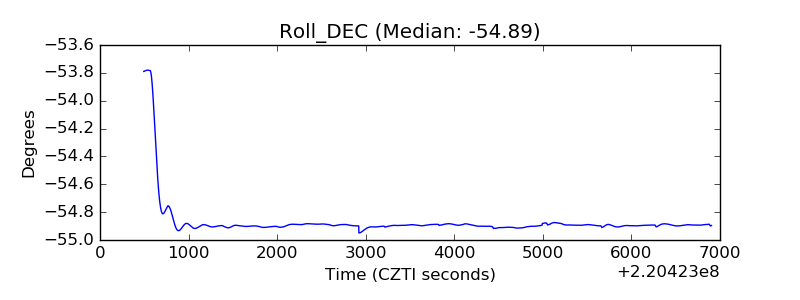 |
| _Roll_RA | 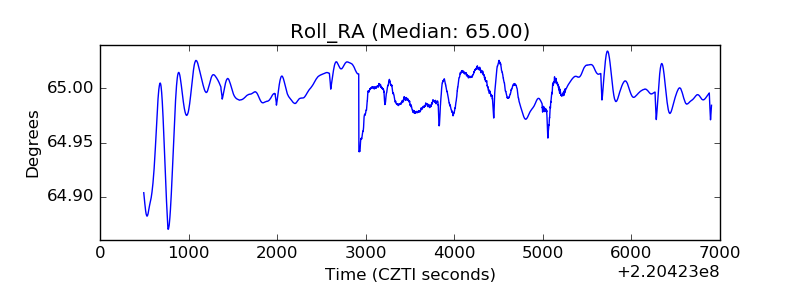 |
| Veto Counter | 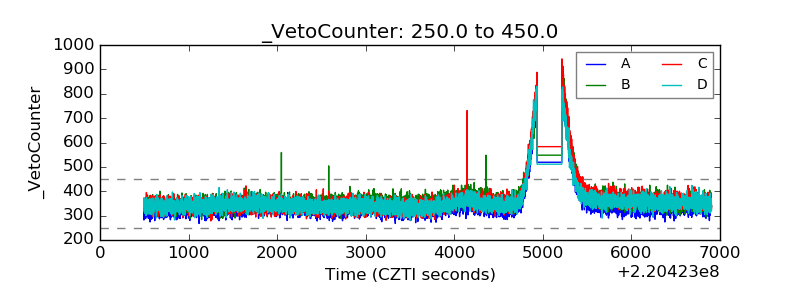 |