| Param | Original file | Final file |
|---|---|---|
| Filename | modeM0/AS1G06_087T01_9000000926_06739cztM0_level2.evt | modeM0/AS1G06_087T01_9000000926_06739cztM0_level2_quad_clean.evt |
| Size (bytes) | 1,342,123,200 | 231,442,560 |
| Size | 1.2 GB | 220.7 MB |
| Events in quadrant A | 9,596,363 | 1,451,306 |
| Events in quadrant B | 8,071,681 | 1,509,188 |
| Events in quadrant C | 8,099,381 | 1,493,208 |
| Events in quadrant D | 13,700,305 | 1,353,449 |
| Mode SS | |||
|---|---|---|---|
| Quadrant | BADHDUFLAG | Total packets | Discarded packets |
| A | 0 | 358 | 0 |
| B | 0 | 358 | 0 |
| C | 0 | 358 | 0 |
| D | 0 | 358 | 0 |
| Mode M9 | |||
|---|---|---|---|
| Quadrant | BADHDUFLAG | Total packets | Discarded packets |
| A | 0 | 16 | 0 |
| B | 0 | 16 | 0 |
| C | 0 | 16 | 0 |
| D | 0 | 16 | 0 |
| Mode M0 | |||
|---|---|---|---|
| Quadrant | BADHDUFLAG | Total packets | Discarded packets |
| A | 0 | 41086 | 3 |
| B | 0 | 36170 | 3 |
| C | 0 | 36500 | 3 |
| D | 0 | 51993 | 3 |
| Quadrant | Total seconds | Saturated seconds | Saturation percentage |
|---|---|---|---|
| A | 17425 | 1114 | 6.393113% |
| B | 17425 | 398 | 2.284075% |
| C | 17425 | 393 | 2.255380% |
| D | 17425 | 1734 | 9.951220% |
Noise dominated data is calculated using 1-second bins in cleaned event files. If a bin has >2000 counts, and if more than 50% of those come from <1% of pixels, then it is considered to be noise-dominated and hence unusable.
| Quadrant | # 1 sec bins | Bins with >0 counts | Bins with >2000 counts | High rate bins dominated by noise | Noise dominated (total time) | Noise dominated (detector-on time) | Marked lightcurve |
|---|---|---|---|---|---|---|---|
| A | 18915 | 17428 | 538 | 538 | 2.84% | 3.09% | 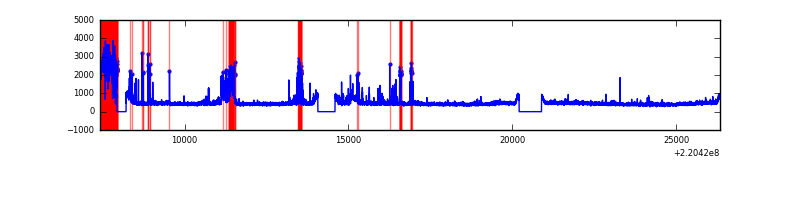 |
| B | 18915 | 17428 | 17 | 17 | 0.09% | 0.10% | 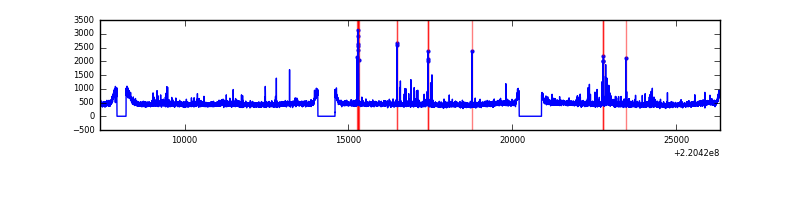 |
| C | 18915 | 17428 | 2 | 2 | 0.01% | 0.01% | 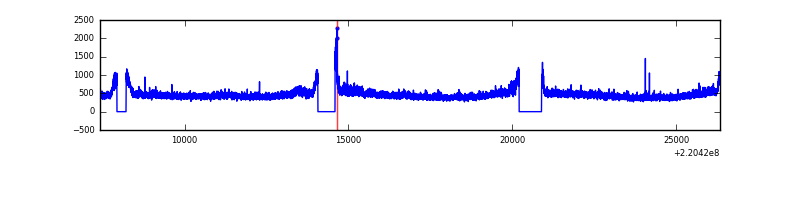 |
| D | 18915 | 17428 | 1424 | 1424 | 7.53% | 8.17% | 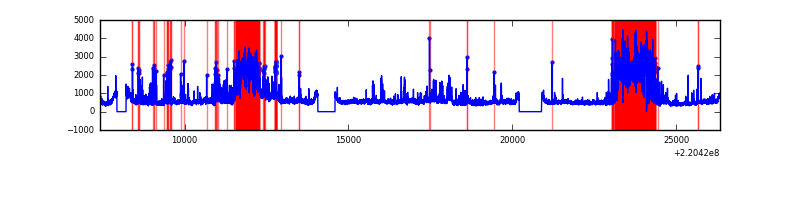 |
Top three noisy pixels from each quadrant. If the there are fewer than three noisy pixels in the level2.evt file, extra rows are filled as -1
| Pixel properties | Quadrant properties | ||||||
|---|---|---|---|---|---|---|---|
| Quadrant | DetID | PixID | Counts | Sigma | Mean | Median | Sigma |
| A | 14 | 111 | 2013604 | 5077.58 | 1933 | 1889 | 396.2 |
| A | 8 | 15 | 111668 | 277.08 | 1933 | 1889 | 396.2 |
| A | 15 | 234 | 25518 | 59.64 | 1933 | 1889 | 396.2 |
| B | 0 | 214 | 97014 | 248.1 | 1999 | 1947 | 383.2 |
| B | 4 | 81 | 92776 | 237.04 | 1999 | 1947 | 383.2 |
| B | 10 | 252 | 66450 | 168.33 | 1999 | 1947 | 383.2 |
| C | 9 | 16 | 505697 | 1120.78 | 1932 | 1938 | 449.5 |
| C | 9 | 247 | 41269 | 87.51 | 1932 | 1938 | 449.5 |
| C | 13 | 61 | 15098 | 29.28 | 1932 | 1938 | 449.5 |
| D | 2 | 33 | 3304320 | 7240.84 | 1869 | 1809 | 456.1 |
| D | 8 | 195 | 1367440 | 2994.18 | 1869 | 1809 | 456.1 |
| D | 2 | 152 | 873944 | 1912.18 | 1869 | 1809 | 456.1 |
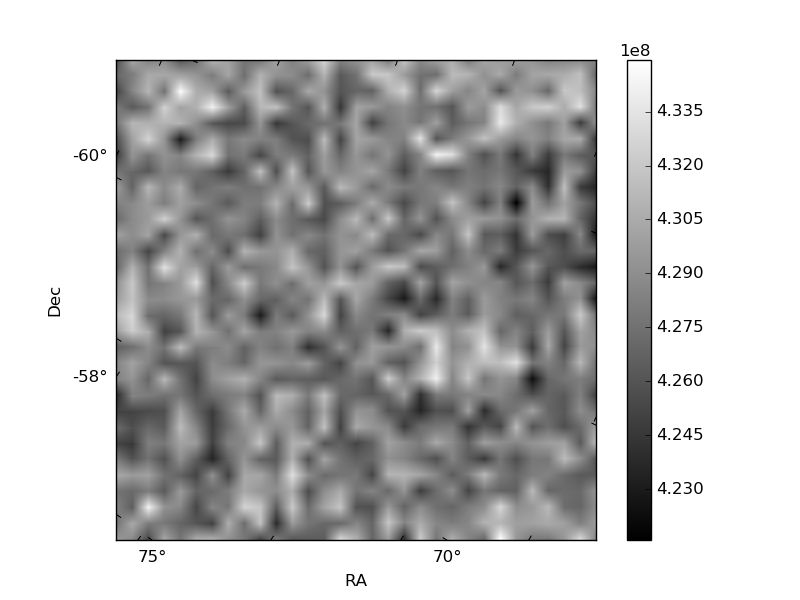
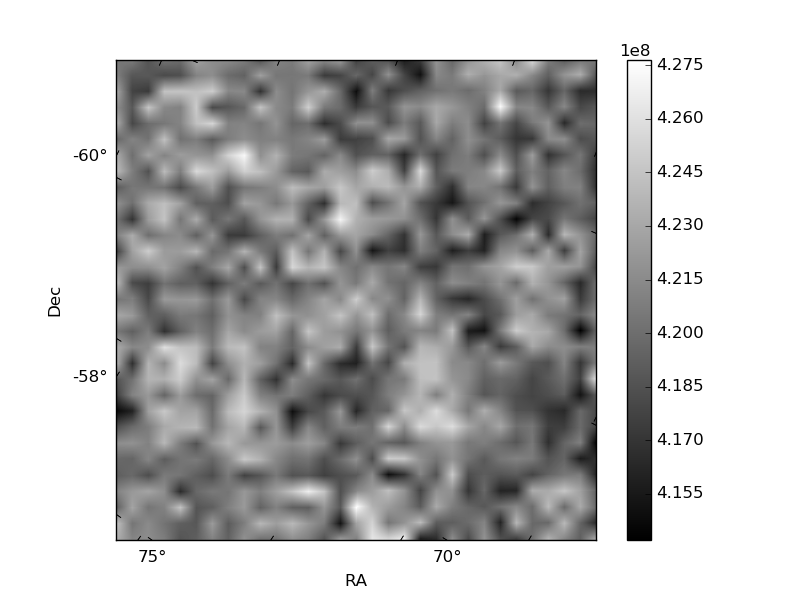
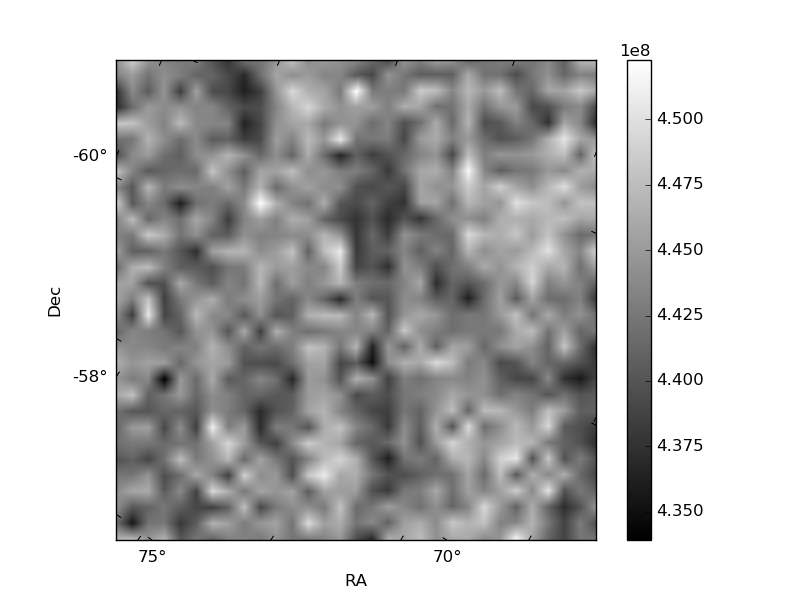
Histogram calculated using DETX and DETY for each event in the final _common_clean file
| Quadrant A | 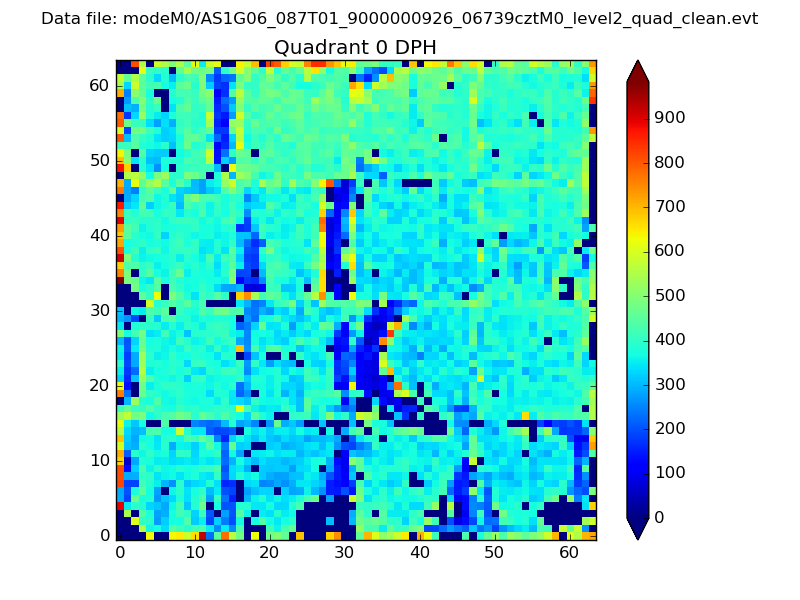 |
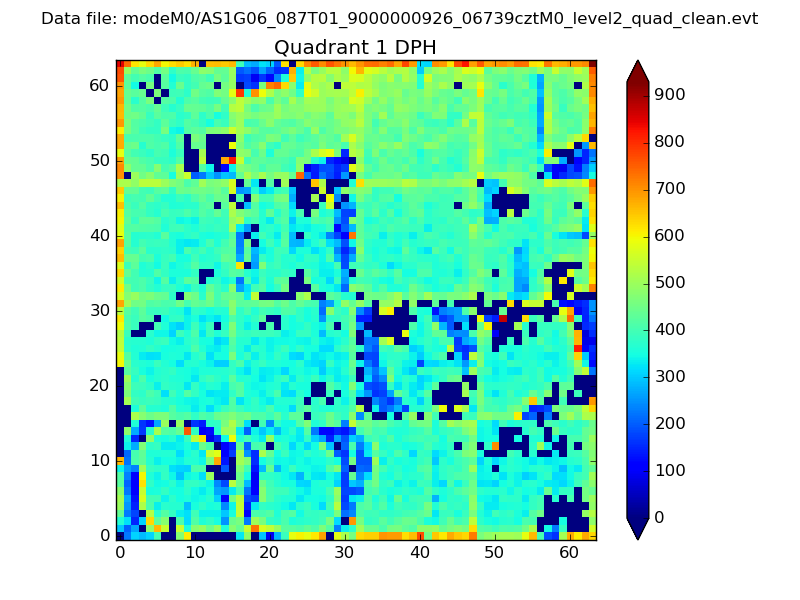 |
Quadrant B |
|---|---|---|---|
| Quadrant D | 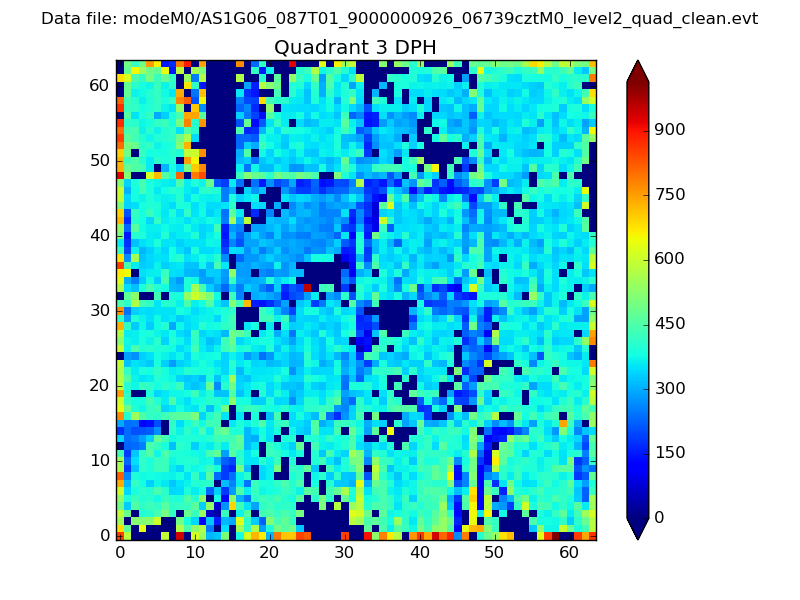 |
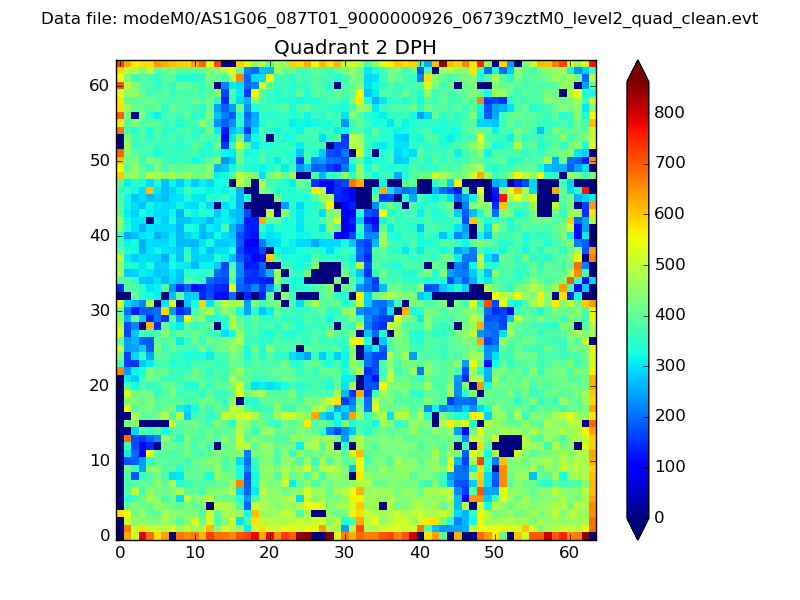 |
Quadrant C |
| Plot type | Count rate plots | Images |
|---|---|---|
| Comparison with Poisson distribution Blue bars denote a histogram of data divided into 1 sec bins. Red curve is a Poisson curve with rate = median count rate of data. |
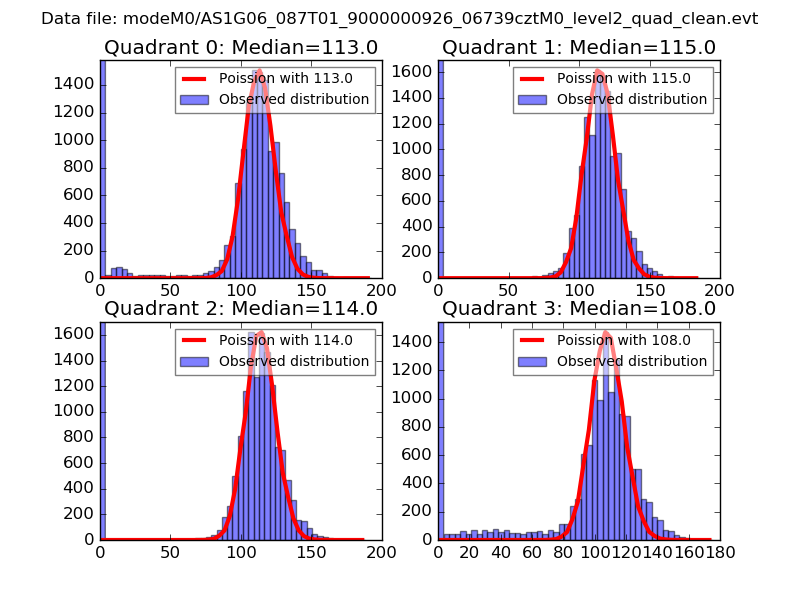 |
 |
| Quadrant-wise count rates Data is divided into 100 sec bins |
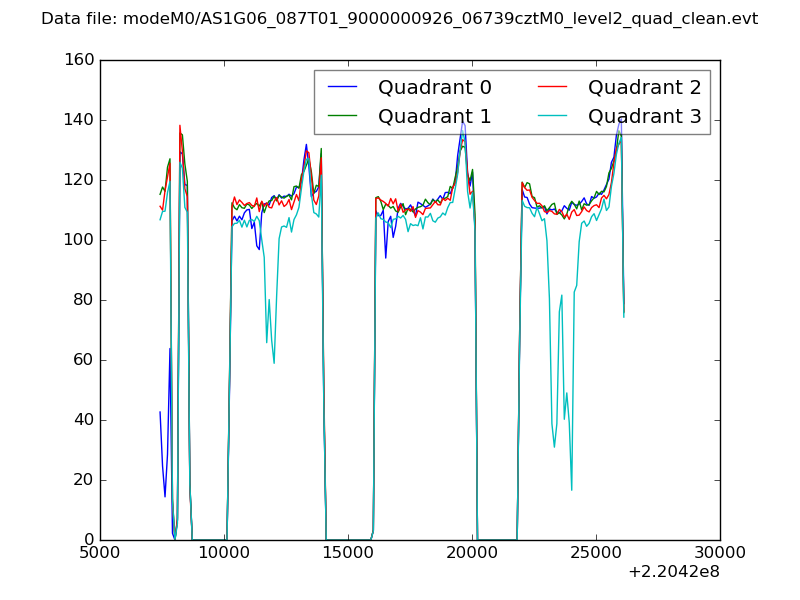 |
|
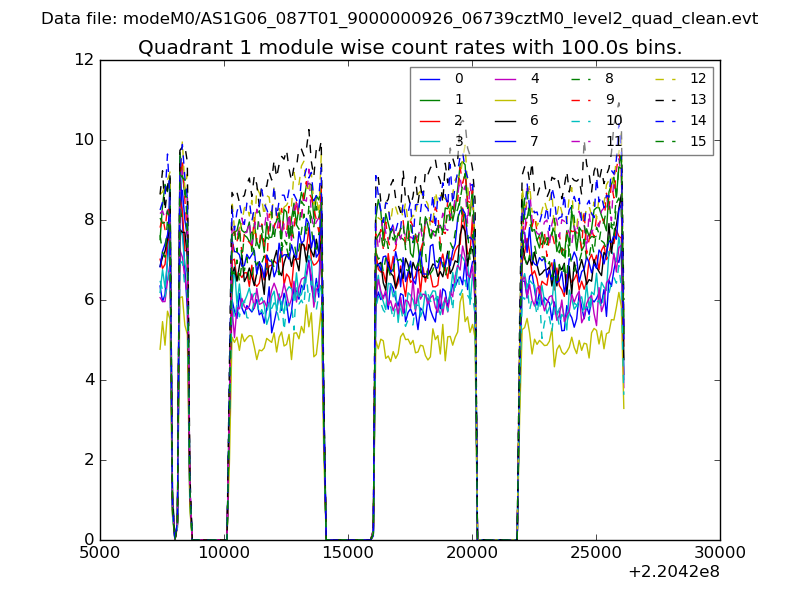
| Module-wise count rates for Quadrant A Data is divided into 100 sec bins |
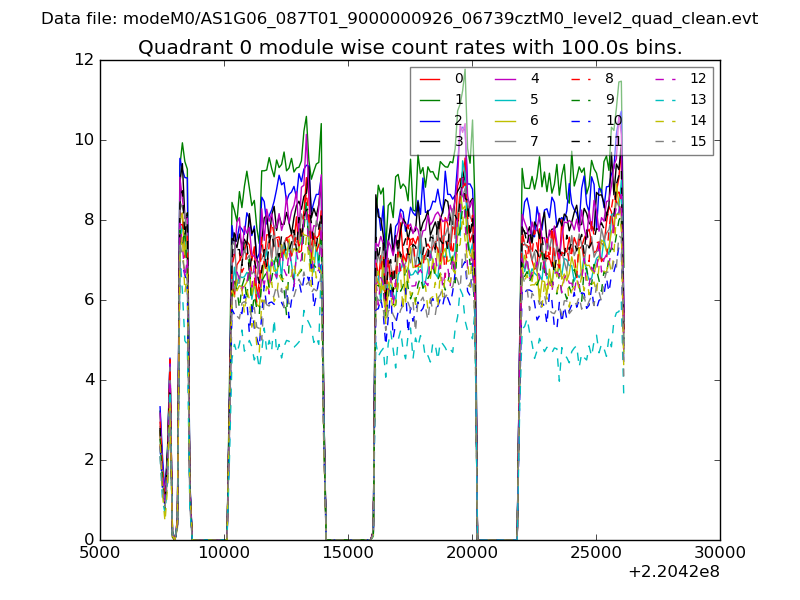 |
 |
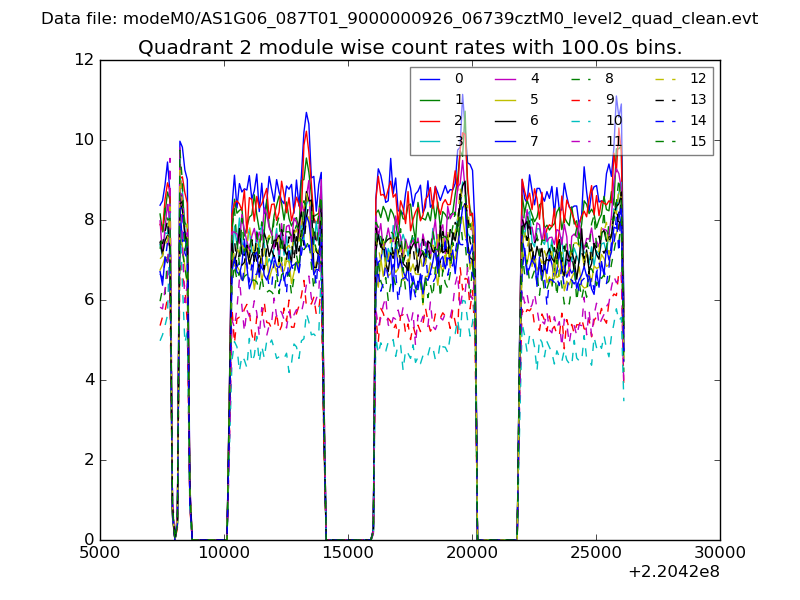
| Module-wise count rates for Quadrant B Data is divided into 100 sec bins |
 |
 |
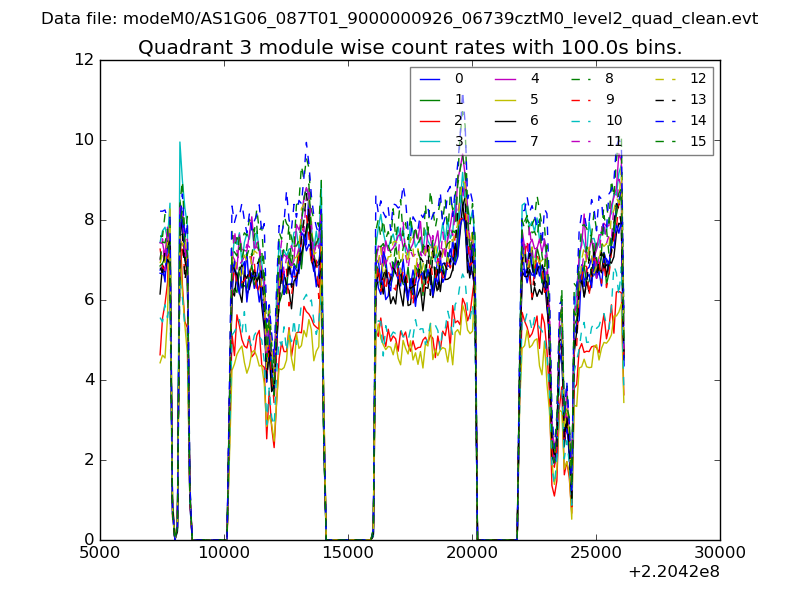
| Module-wise count rates for Quadrant C Data is divided into 100 sec bins |
 |
 |
| Module-wise count rates for Quadrant D Data is divided into 100 sec bins |
 |
 |
| Parameter | Plot |
|---|---|
| CZT HV Monitor | 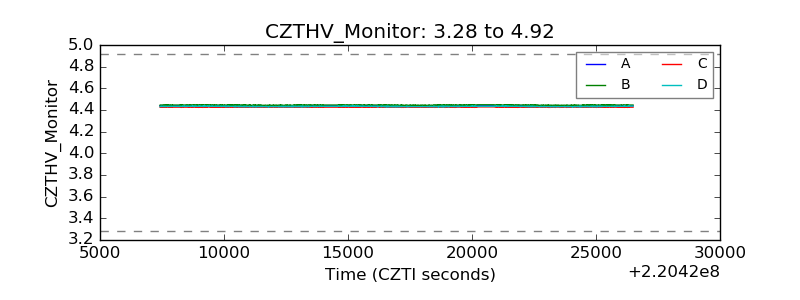 |
| D_VDD | 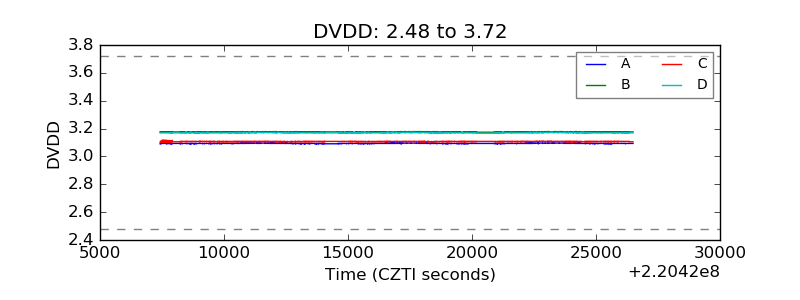 |
| Temperature 1 | 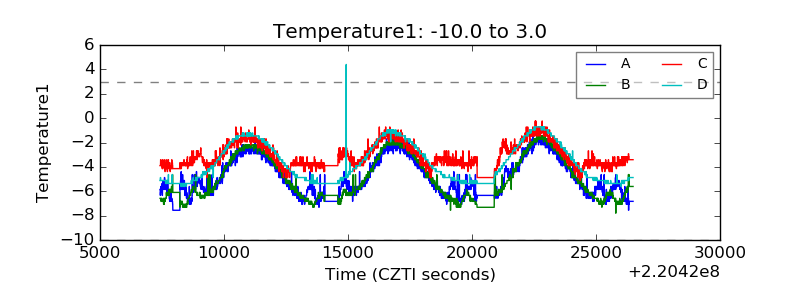 |
| Veto HV Monitor | 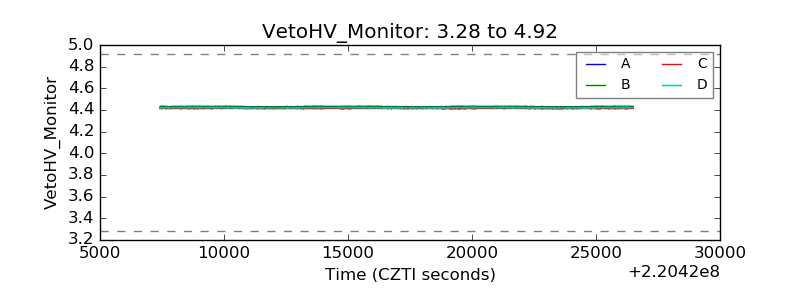 |
| Veto LLD | 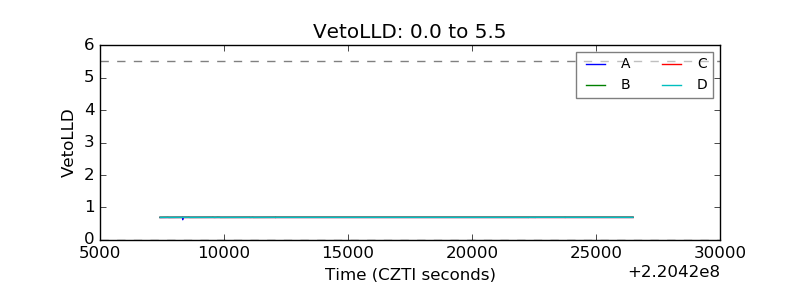 |
| Alpha Counter | 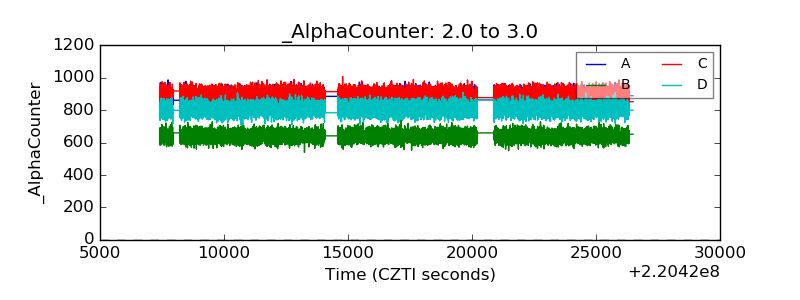 |
| _CPM_Rate | 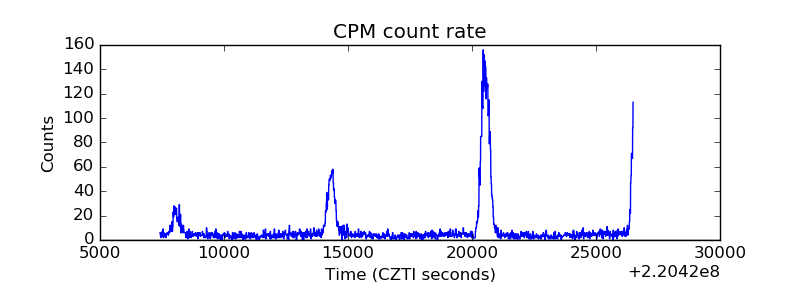 |
| CZT Counter | 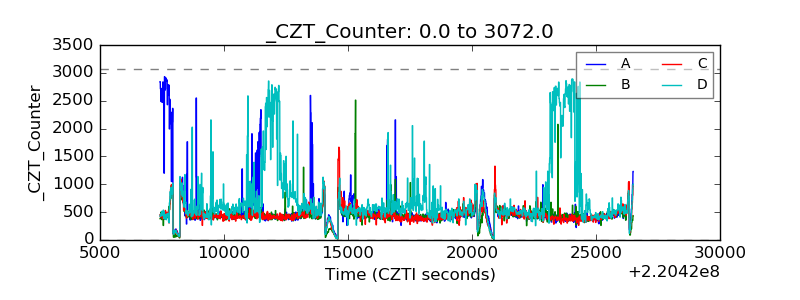 |
| +2.5 Volts monitor |  |
| +5 Volts monitor |  |
| _ROLL_ROT | 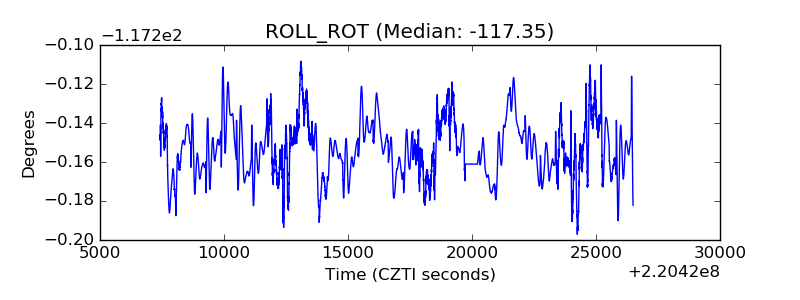 |
| _Roll_DEC | 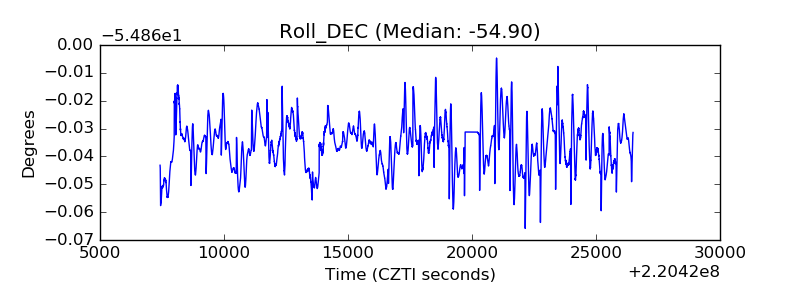 |
| _Roll_RA |  |
| Veto Counter | 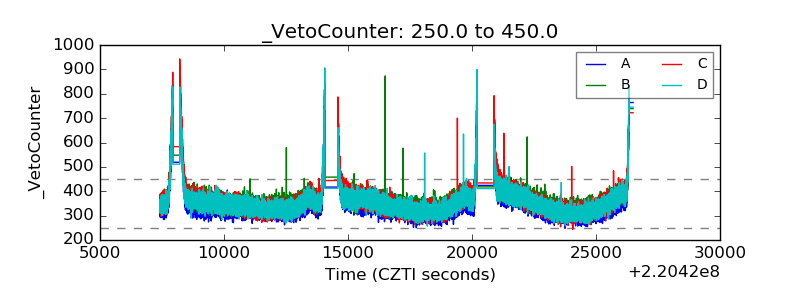 |