| Param | Original file | Final file |
|---|---|---|
| Filename | modeM0/AS1G06_087T01_9000000926_06742cztM0_level2.evt | modeM0/AS1G06_087T01_9000000926_06742cztM0_level2_quad_clean.evt |
| Size (bytes) | 288,031,680 | 53,475,840 |
| Size | 274.7 MB | 51.0 MB |
| Events in quadrant A | 2,649,944 | 320,857 |
| Events in quadrant B | 1,767,735 | 345,839 |
| Events in quadrant C | 1,644,253 | 345,485 |
| Events in quadrant D | 2,393,119 | 330,015 |
| Mode SS | |||
|---|---|---|---|
| Quadrant | BADHDUFLAG | Total packets | Discarded packets |
| A | 0 | 80 | 0 |
| B | 0 | 80 | 0 |
| C | 0 | 80 | 0 |
| D | 0 | 80 | 0 |
| Mode M0 | |||
|---|---|---|---|
| Quadrant | BADHDUFLAG | Total packets | Discarded packets |
| A | 0 | 10504 | 1 |
| B | 0 | 7941 | 0 |
| C | 0 | 7866 | 0 |
| D | 0 | 9599 | 0 |
| Quadrant | Total seconds | Saturated seconds | Saturation percentage |
|---|---|---|---|
| A | 3915 | 347 | 8.863346% |
| B | 3915 | 7 | 0.178799% |
| C | 3915 | 2 | 0.051086% |
| D | 3915 | 60 | 1.532567% |
Noise dominated data is calculated using 1-second bins in cleaned event files. If a bin has >2000 counts, and if more than 50% of those come from <1% of pixels, then it is considered to be noise-dominated and hence unusable.
| Quadrant | # 1 sec bins | Bins with >0 counts | Bins with >2000 counts | High rate bins dominated by noise | Noise dominated (total time) | Noise dominated (detector-on time) | Marked lightcurve |
|---|---|---|---|---|---|---|---|
| A | 3915 | 3915 | 198 | 198 | 5.06% | 5.06% | 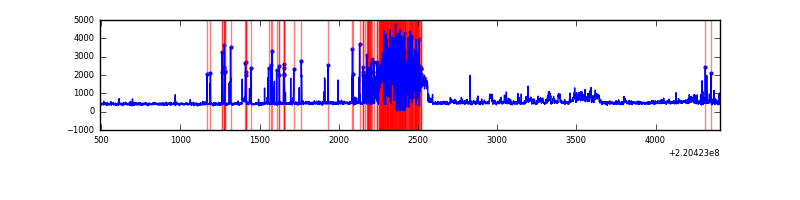 |
| B | 3915 | 3915 | 2 | 2 | 0.05% | 0.05% | 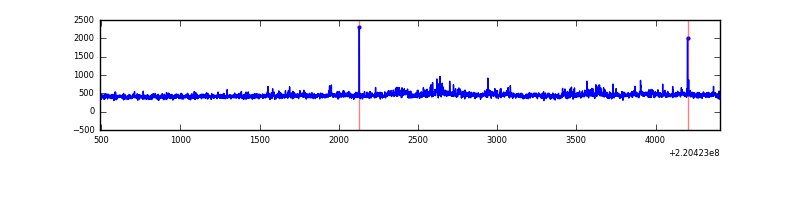 |
| C | 3915 | 3915 | 1 | 1 | 0.03% | 0.03% | 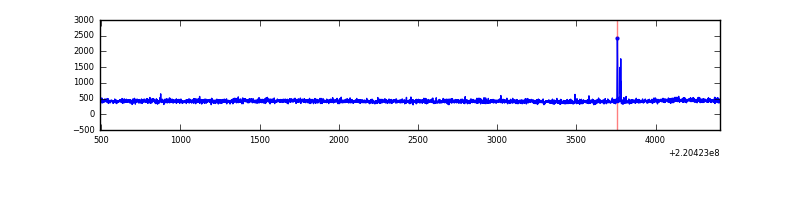 |
| D | 3915 | 3915 | 57 | 57 | 1.46% | 1.46% | 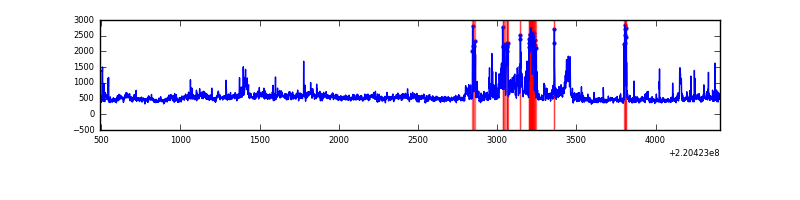 |
Top three noisy pixels from each quadrant. If the there are fewer than three noisy pixels in the level2.evt file, extra rows are filled as -1
| Pixel properties | Quadrant properties | ||||||
|---|---|---|---|---|---|---|---|
| Quadrant | DetID | PixID | Counts | Sigma | Mean | Median | Sigma |
| A | 14 | 111 | 1009138 | 11973.89 | 407 | 398 | 84.2 |
| A | 8 | 15 | 74729 | 882.32 | 407 | 398 | 84.2 |
| A | 0 | 226 | 3855 | 41.04 | 407 | 398 | 84.2 |
| B | 4 | 81 | 37930 | 449.59 | 429 | 418 | 83.4 |
| B | 15 | 204 | 36062 | 427.2 | 429 | 418 | 83.4 |
| B | 0 | 214 | 20553 | 241.32 | 429 | 418 | 83.4 |
| C | 10 | 22 | 11842 | 118.78 | 409 | 410 | 96.2 |
| C | 8 | 128 | 10058 | 100.24 | 409 | 410 | 96.2 |
| C | 9 | 16 | 8864 | 87.84 | 409 | 410 | 96.2 |
| D | 8 | 195 | 348689 | 3438.28 | 410 | 397 | 101.3 |
| D | 2 | 33 | 305904 | 3015.92 | 410 | 397 | 101.3 |
| D | 2 | 136 | 51613 | 505.6 | 410 | 397 | 101.3 |
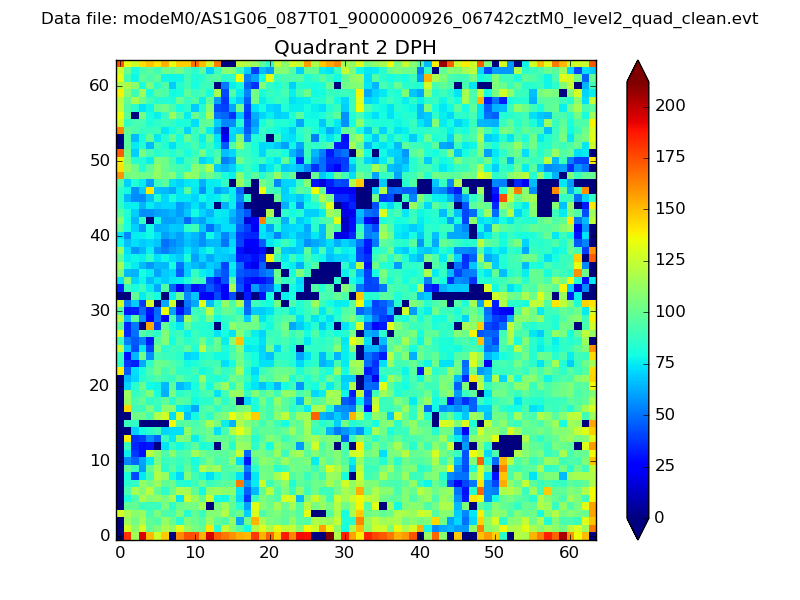
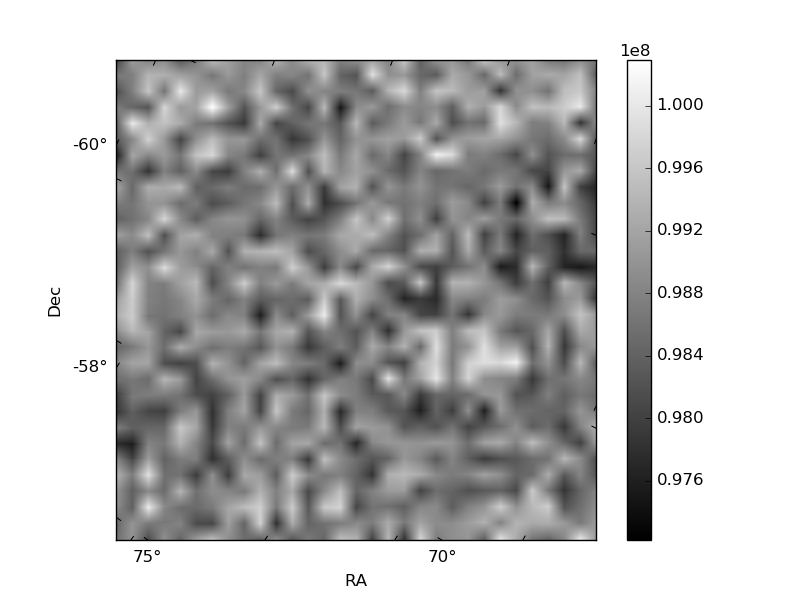
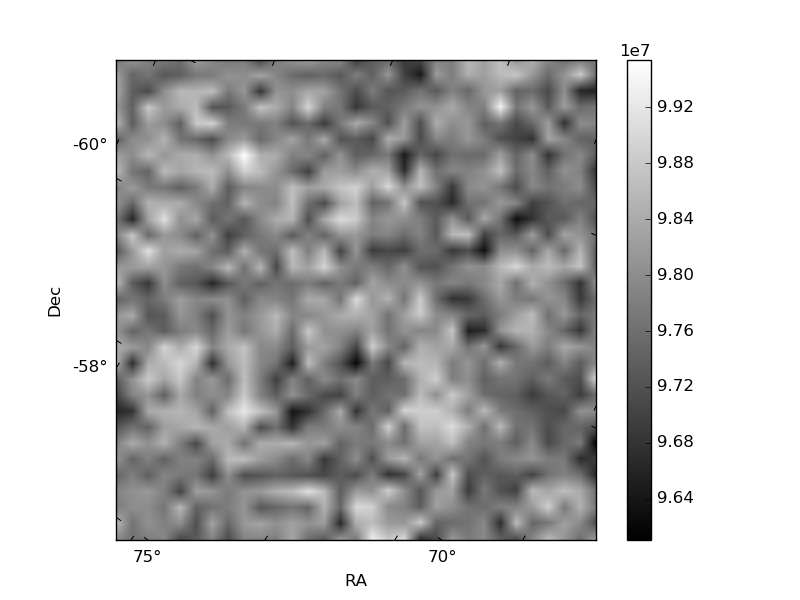
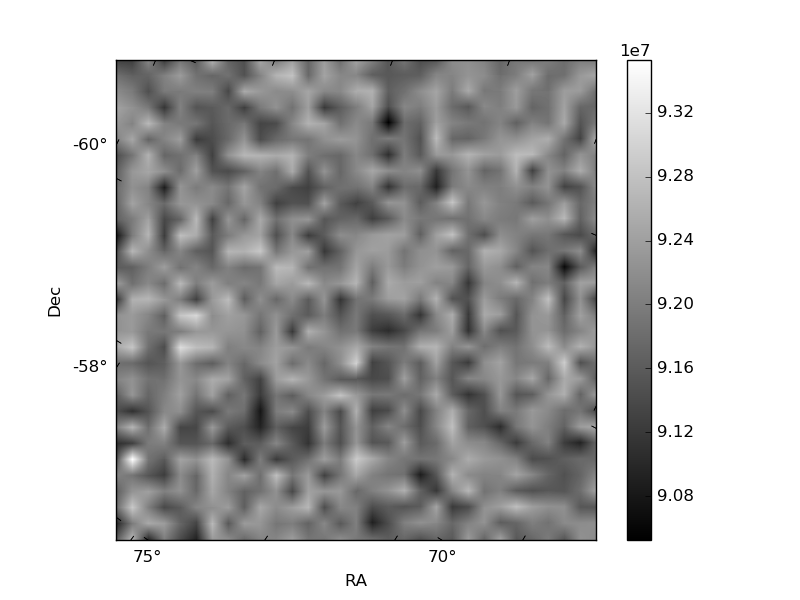
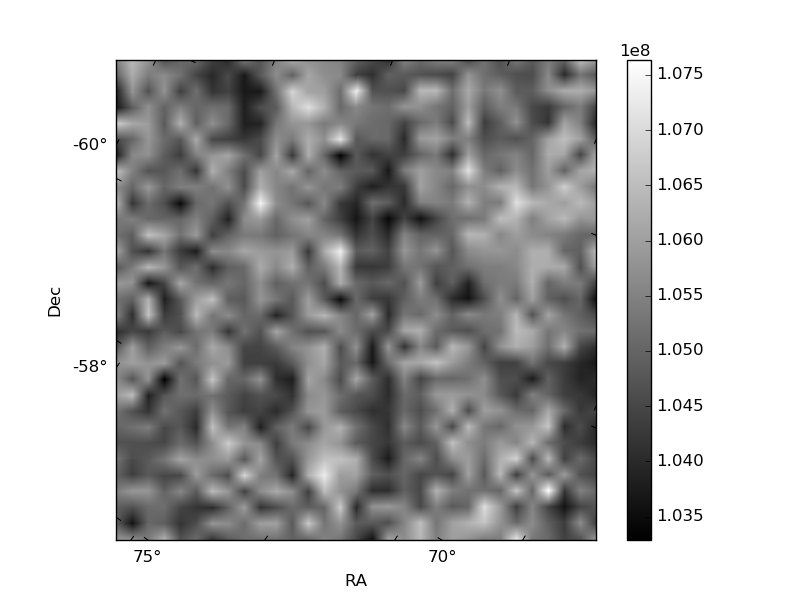
Histogram calculated using DETX and DETY for each event in the final _common_clean file
| Quadrant A | 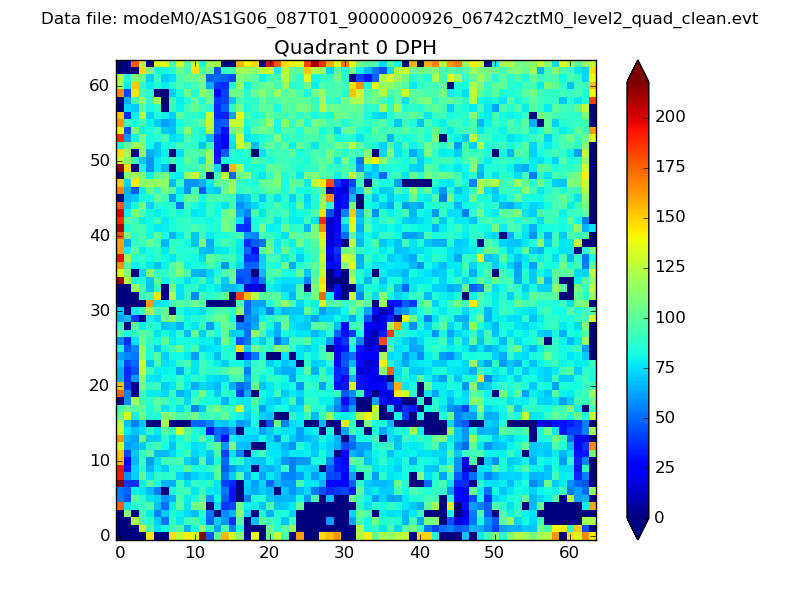 |
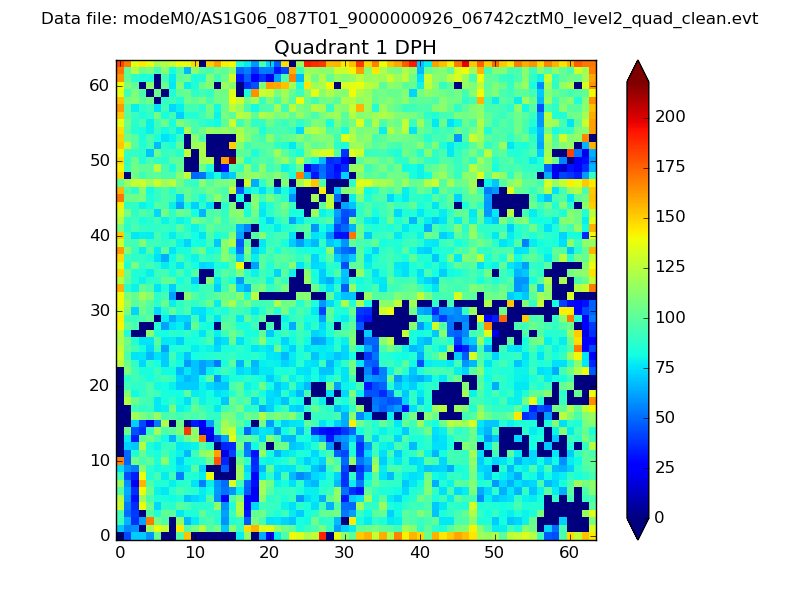 |
Quadrant B |
|---|---|---|---|
| Quadrant D | 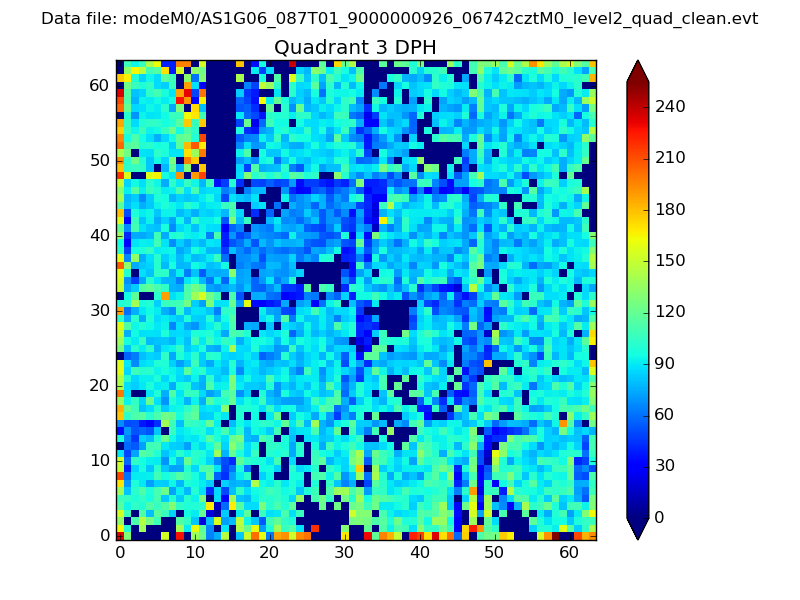 |
 |
Quadrant C |
| Plot type | Count rate plots | Images |
|---|---|---|
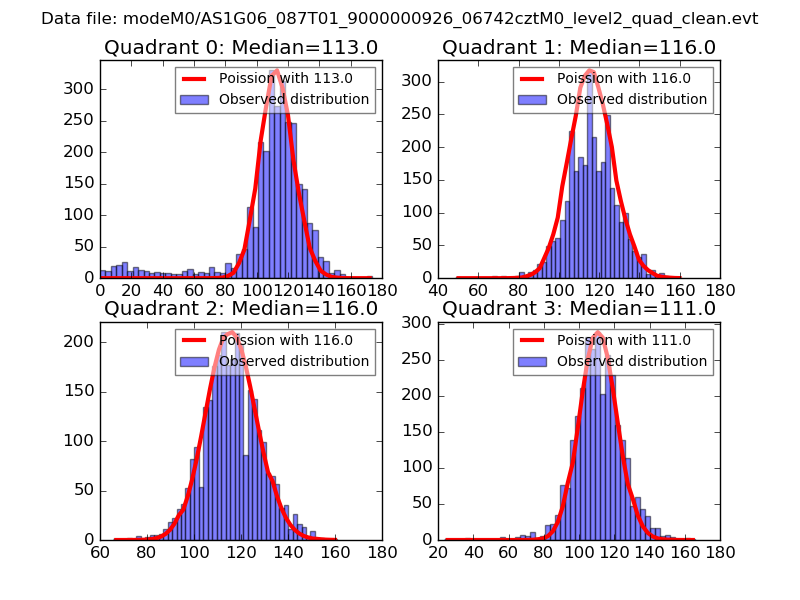
| Comparison with Poisson distribution Blue bars denote a histogram of data divided into 1 sec bins. Red curve is a Poisson curve with rate = median count rate of data. |
 |
 |
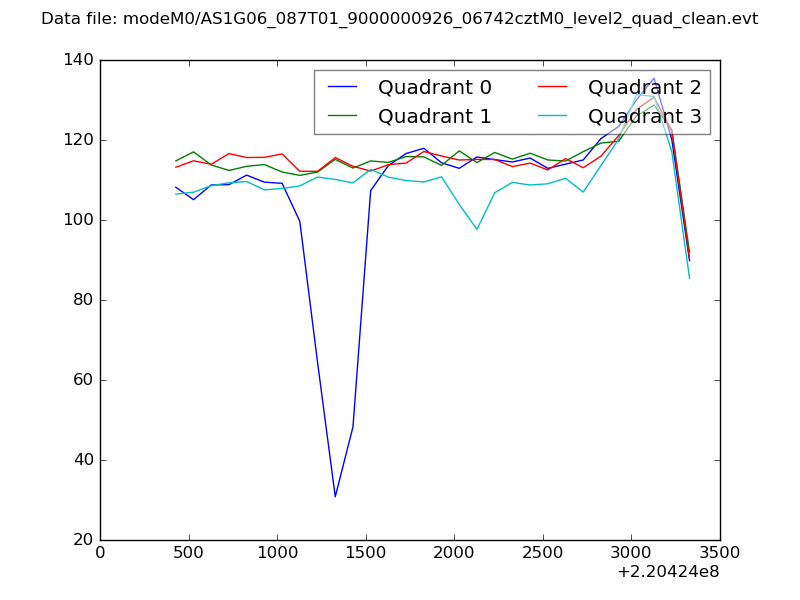
| Quadrant-wise count rates Data is divided into 100 sec bins |
 |
|
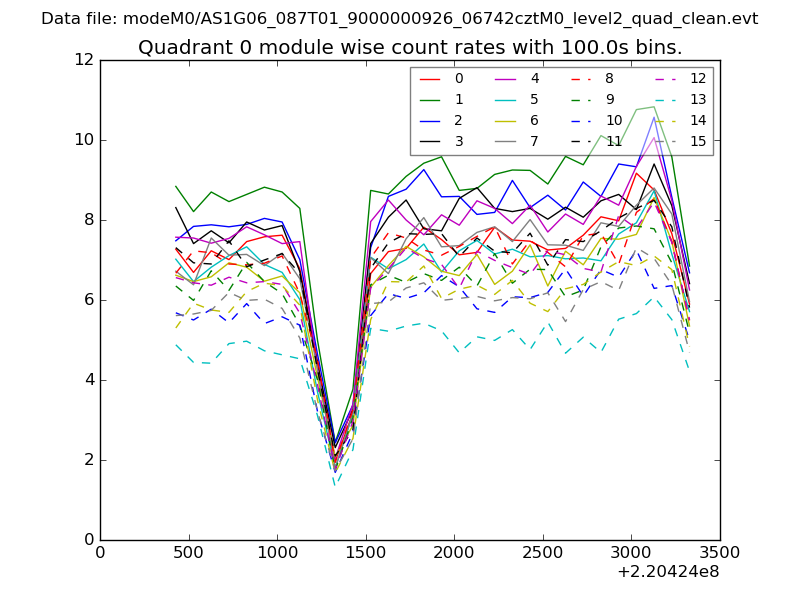
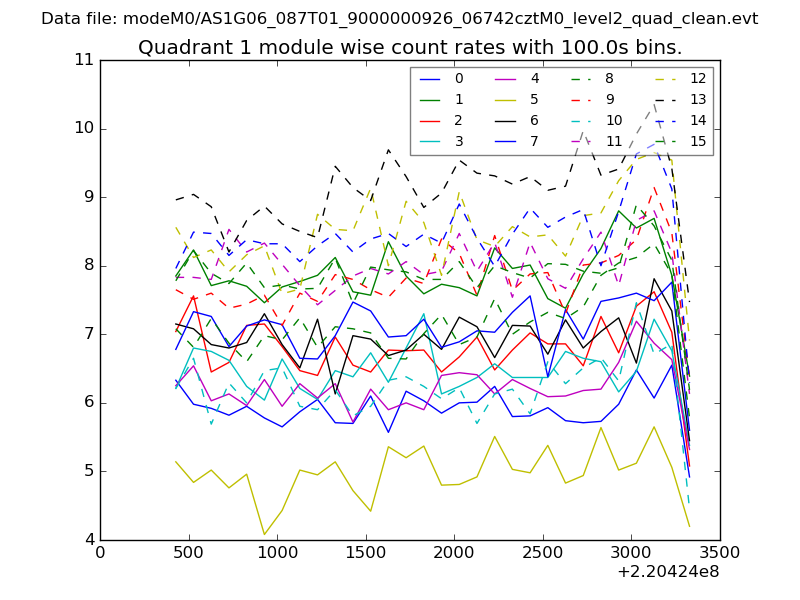
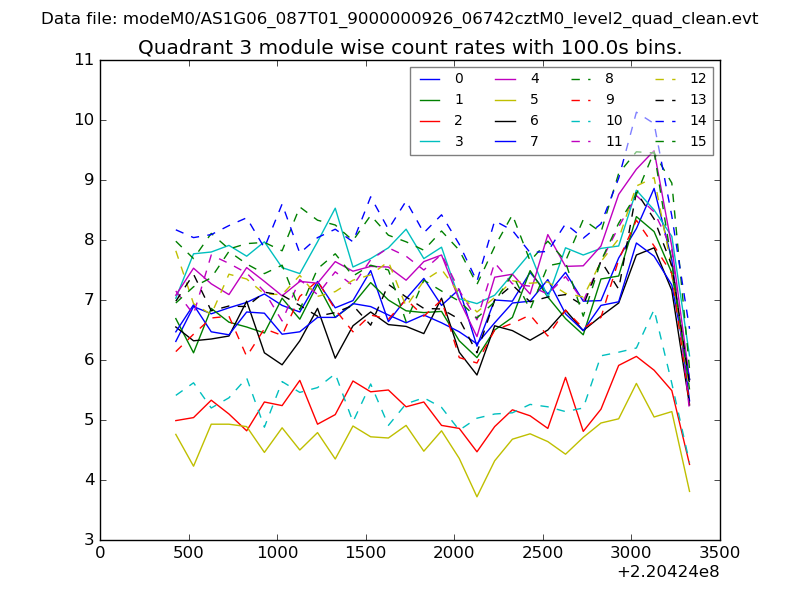
| Module-wise count rates for Quadrant A Data is divided into 100 sec bins |
 |
 |
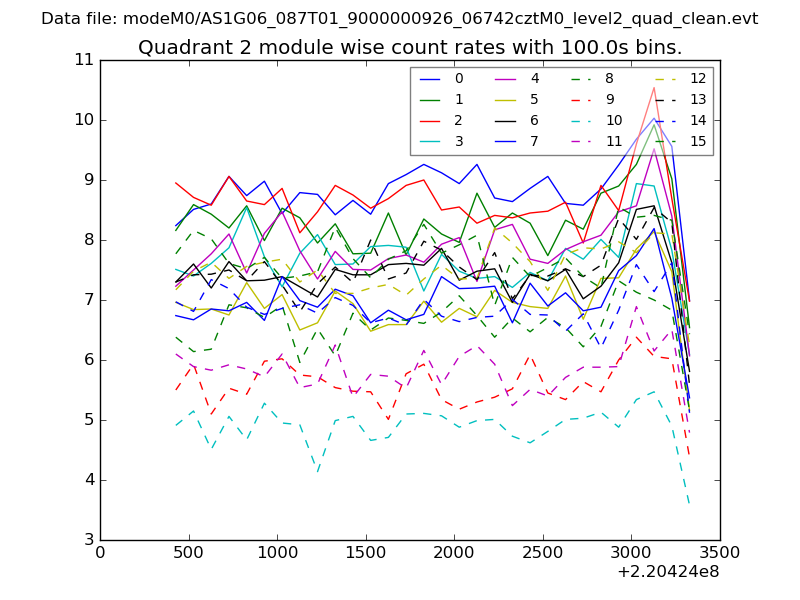
| Module-wise count rates for Quadrant B Data is divided into 100 sec bins |
 |
 |
| Module-wise count rates for Quadrant C Data is divided into 100 sec bins |
 |
 |
| Module-wise count rates for Quadrant D Data is divided into 100 sec bins |
 |
 |
| Parameter | Plot |
|---|---|
| CZT HV Monitor | 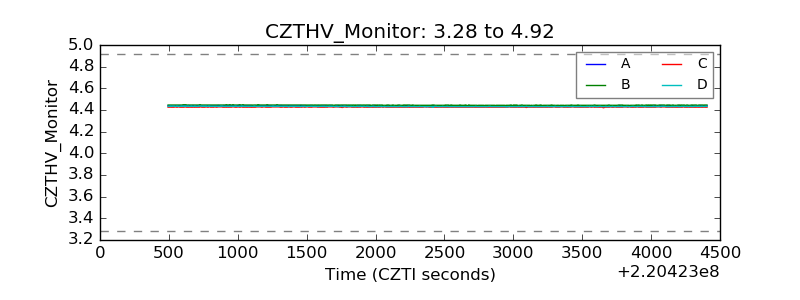 |
| D_VDD | 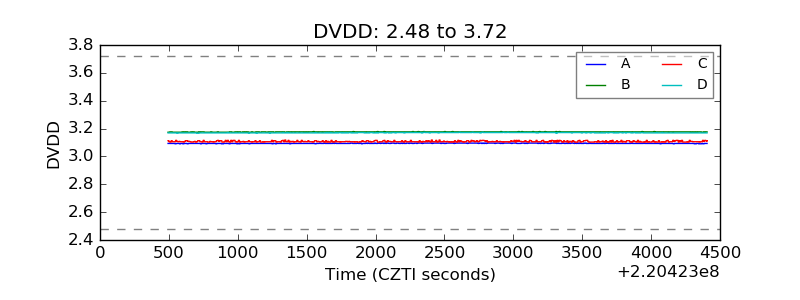 |
| Temperature 1 | 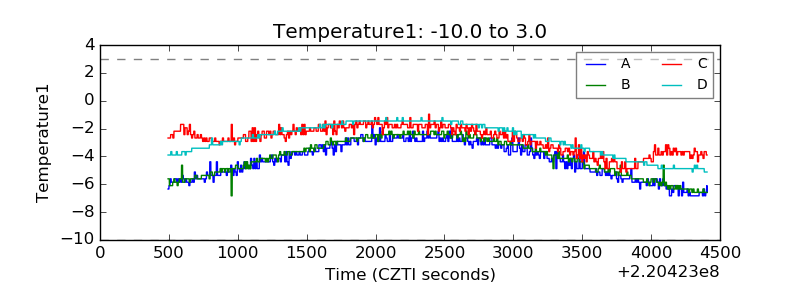 |
| Veto HV Monitor | 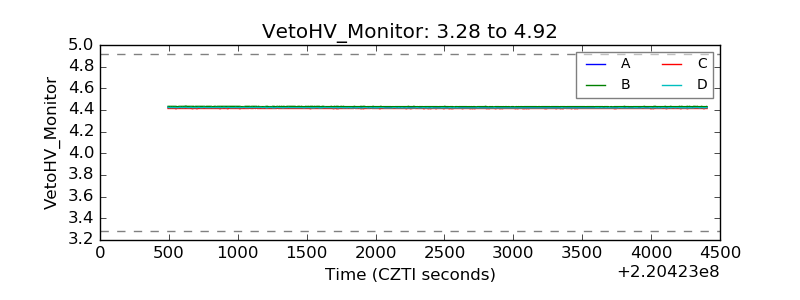 |
| Veto LLD | 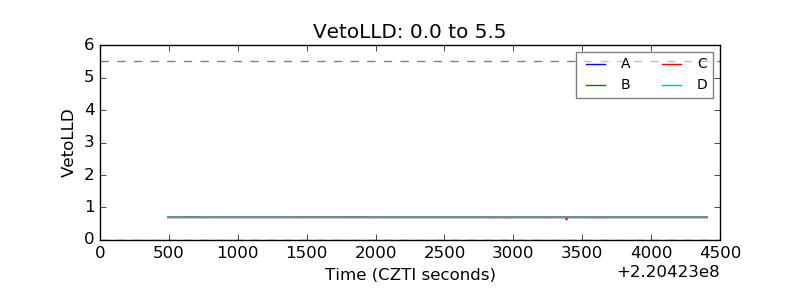 |
| Alpha Counter | 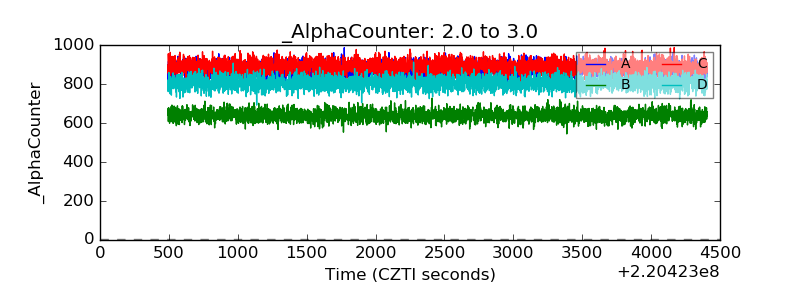 |
| _CPM_Rate | 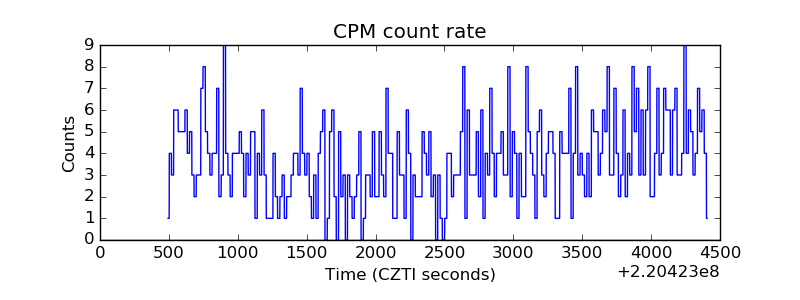 |
| CZT Counter | 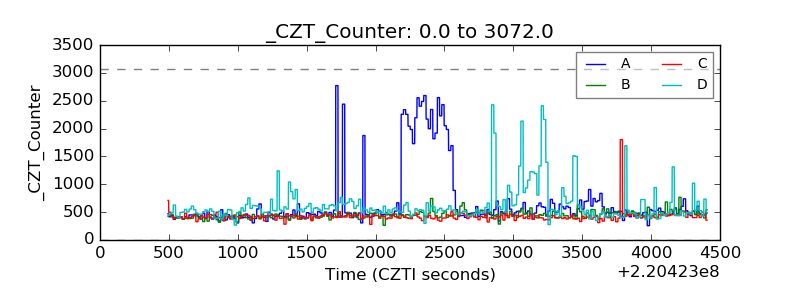 |
| +2.5 Volts monitor |  |
| +5 Volts monitor |  |
| _ROLL_ROT | 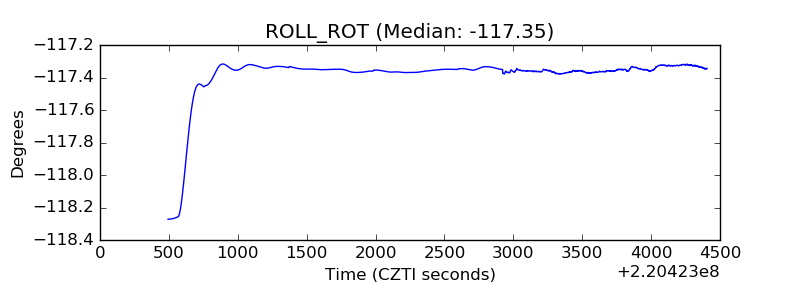 |
| _Roll_DEC | 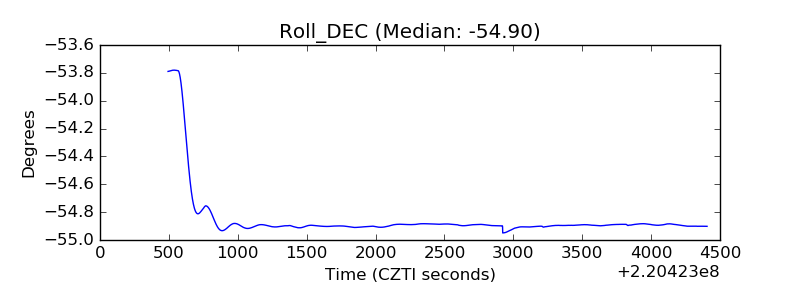 |
| _Roll_RA | 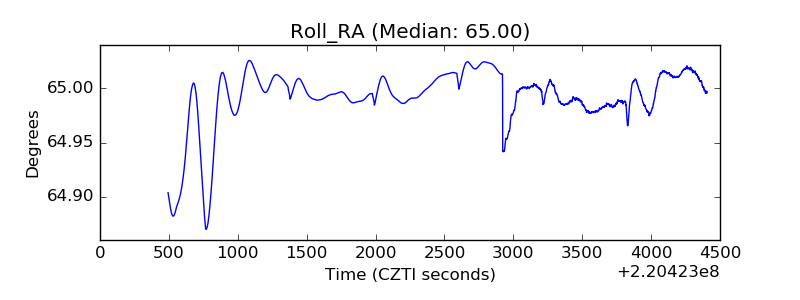 |
| Veto Counter | 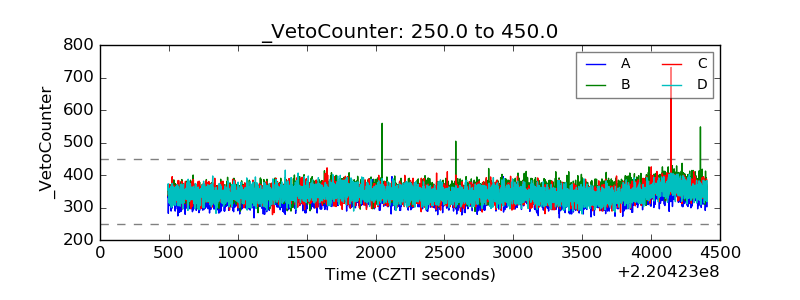 |