| Param | Original file | Final file |
|---|---|---|
| Filename | modeM0/AS1G06_168T10_9000000932cztM0_level2.fits | modeM0/AS1G06_168T10_9000000932cztM0_level2_quad_clean.evt |
| Size (bytes) | 410,814,720 | 428,742,720 |
| Size | 391.8 MB | 408.9 MB |
| Events in quadrant A | 2,465,612 | 2,586,031 |
| Events in quadrant B | 2,403,302 | 2,621,048 |
| Events in quadrant C | 2,462,596 | 2,499,149 |
| Events in quadrant D | 2,009,798 | 2,179,813 |
| Mode M9 | |||
|---|---|---|---|
| Quadrant | BADHDUFLAG | Total packets | Discarded packets |
| A | 0 | 57 | 0 |
| B | 0 | 57 | 0 |
| C | 0 | 57 | 0 |
| D | 0 | 57 | 0 |
| Mode SS | |||
|---|---|---|---|
| Quadrant | BADHDUFLAG | Total packets | Discarded packets |
| A | 0 | 918 | 0 |
| B | 0 | 918 | 0 |
| C | 0 | 918 | 0 |
| D | 0 | 918 | 0 |
| Mode M0 | |||
|---|---|---|---|
| Quadrant | BADHDUFLAG | Total packets | Discarded packets |
| A | 0 | 99205 | 0 |
| B | 0 | 96351 | 0 |
| C | 0 | 92997 | 0 |
| D | 0 | 125162 | 0 |
| Quadrant | Total seconds | Saturated seconds | Saturation percentage |
|---|---|---|---|
| A | 45136 | 1010 | 2.237682% |
| B | 45136 | 755 | 1.672722% |
| C | 45136 | 317 | 0.702322% |
| D | 45136 | 3650 | 8.086671% |
Noise dominated data is calculated using 1-second bins in cleaned event files. If a bin has >2000 counts, and if more than 50% of those come from <1% of pixels, then it is considered to be noise-dominated and hence unusable.
| Quadrant | # 1 sec bins | Bins with >0 counts | Bins with >2000 counts | High rate bins dominated by noise | Noise dominated (total time) | Noise dominated (detector-on time) | Marked lightcurve |
|---|---|---|---|---|---|---|---|
| A | 50906 | 45132 | 0 | 0 | 0.00% | 0.00% | 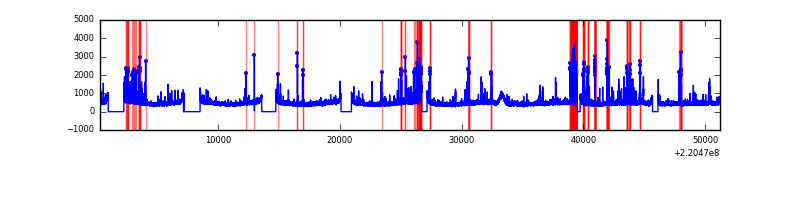 |
| B | 50906 | 45136 | 0 | 0 | 0.00% | 0.00% | 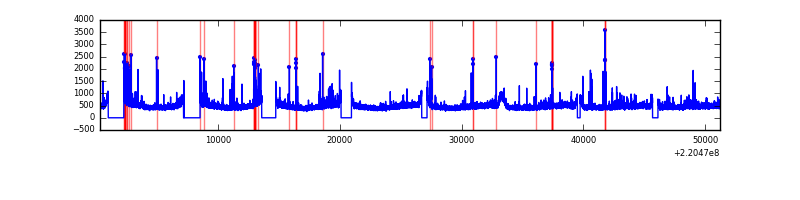 |
| C | 50906 | 45137 | 0 | 0 | 0.00% | 0.00% | 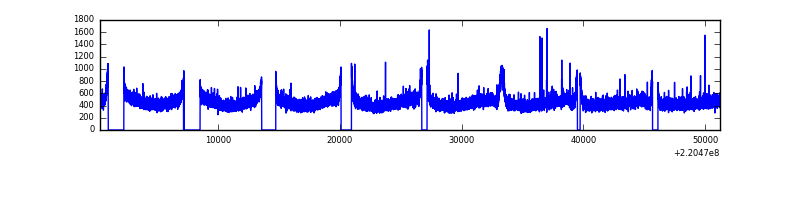 |
| D | 50906 | 45087 | 0 | 0 | 0.00% | 0.00% | 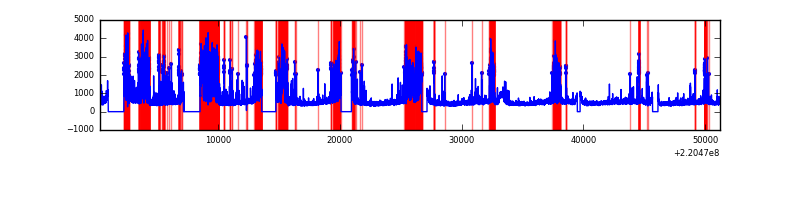 |
Top three noisy pixels from each quadrant. If the there are fewer than three noisy pixels in the level2.evt file, extra rows are filled as -1
| Pixel properties | Quadrant properties | ||||||
|---|---|---|---|---|---|---|---|
| Quadrant | DetID | PixID | Counts | Sigma | Mean | Median | Sigma |
| A | 0 | 29 | 2355 | 10.59 | 640 | 594 | 166.3 |
| A | 7 | 110 | 2124 | 9.2 | 640 | 594 | 166.3 |
| A | 0 | 30 | 1840 | 7.49 | 640 | 594 | 166.3 |
| B | 2 | 9 | 2094 | 11.48 | 633 | 599 | 130.2 |
| B | 12 | 226 | 1706 | 8.5 | 633 | 599 | 130.2 |
| B | 3 | 17 | 1668 | 8.21 | 633 | 599 | 130.2 |
| C | 12 | 241 | 1800 | 6.92 | 649 | 598 | 173.7 |
| C | 1 | 80 | 1755 | 6.66 | 649 | 598 | 173.7 |
| C | 1 | 81 | 1739 | 6.57 | 649 | 598 | 173.7 |
| D | 3 | 14 | 1514 | 6.41 | 573 | 519 | 155.1 |
| D | 7 | 5 | 1447 | 5.98 | 573 | 519 | 155.1 |
| D | 11 | 82 | 1430 | 5.87 | 573 | 519 | 155.1 |
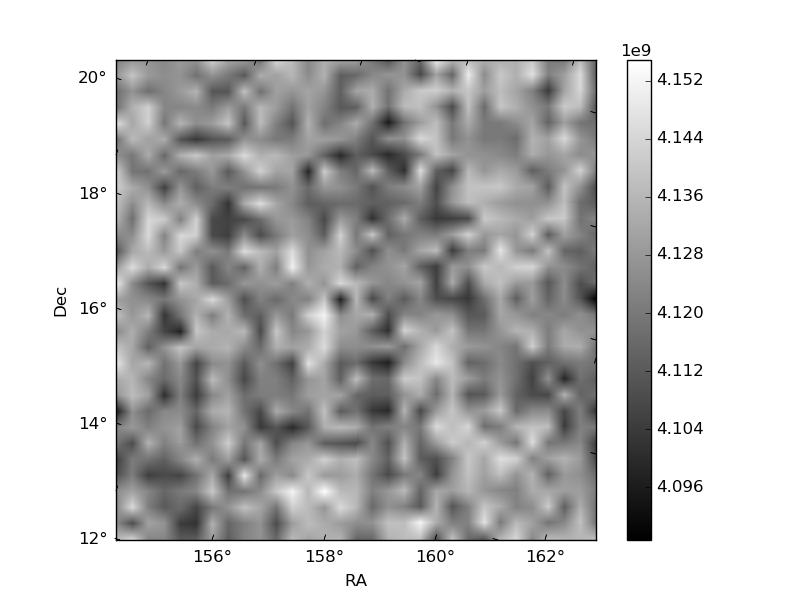
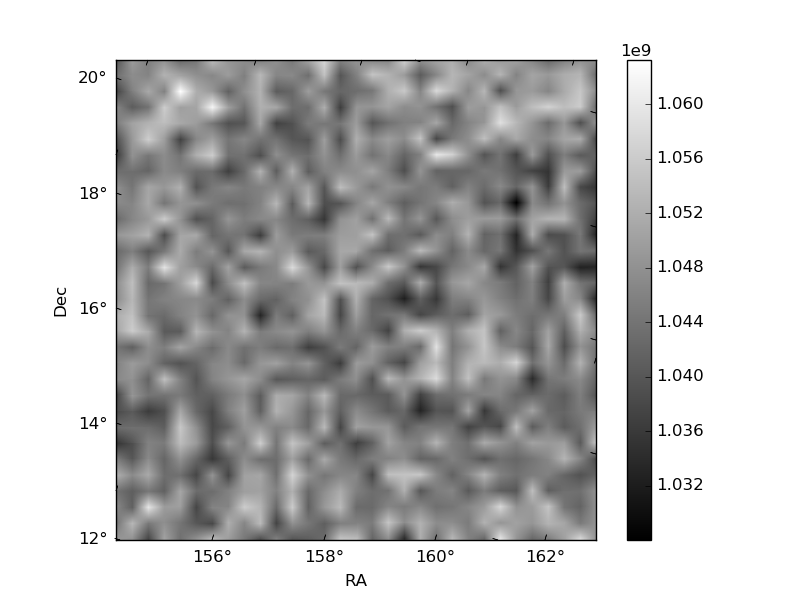
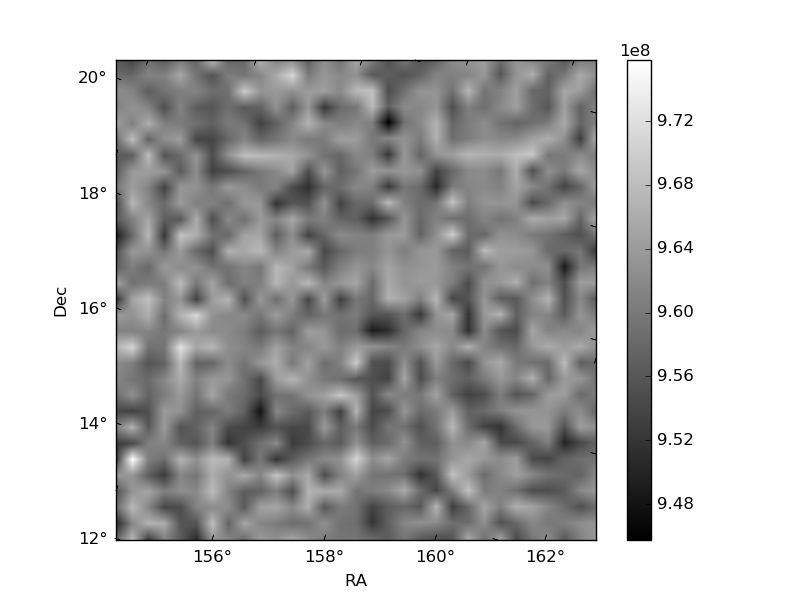
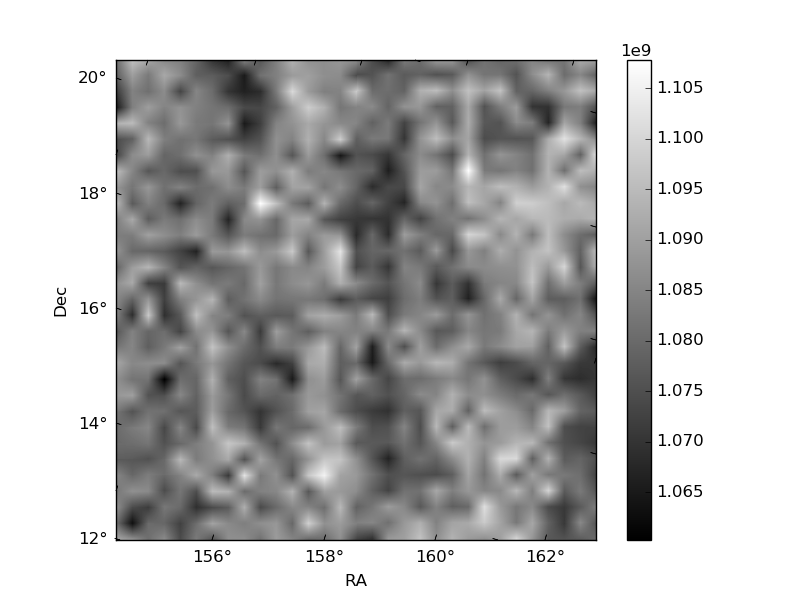
Histogram calculated using DETX and DETY for each event in the final _common_clean file
| Quadrant A | 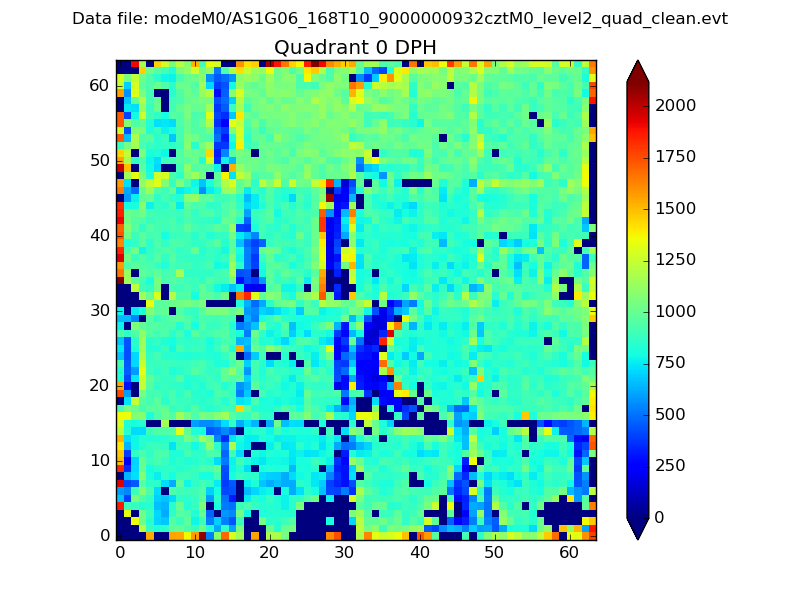 |
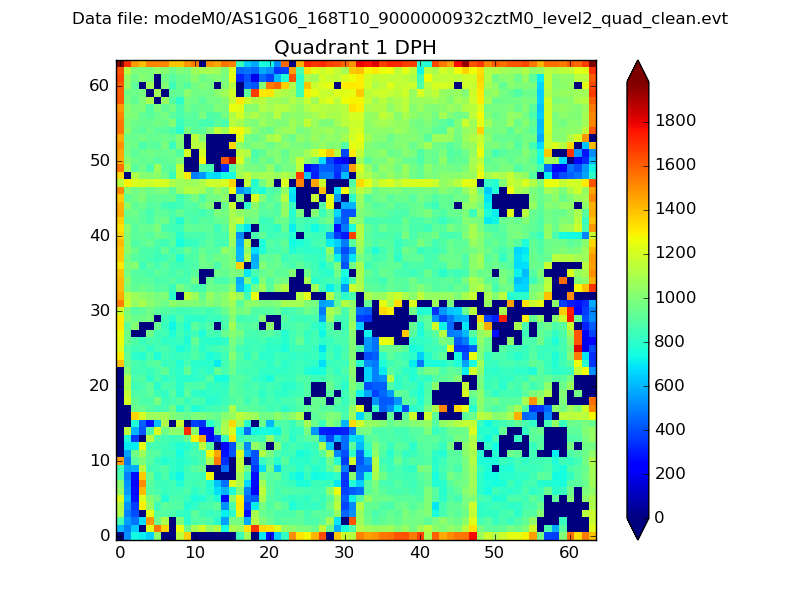 |
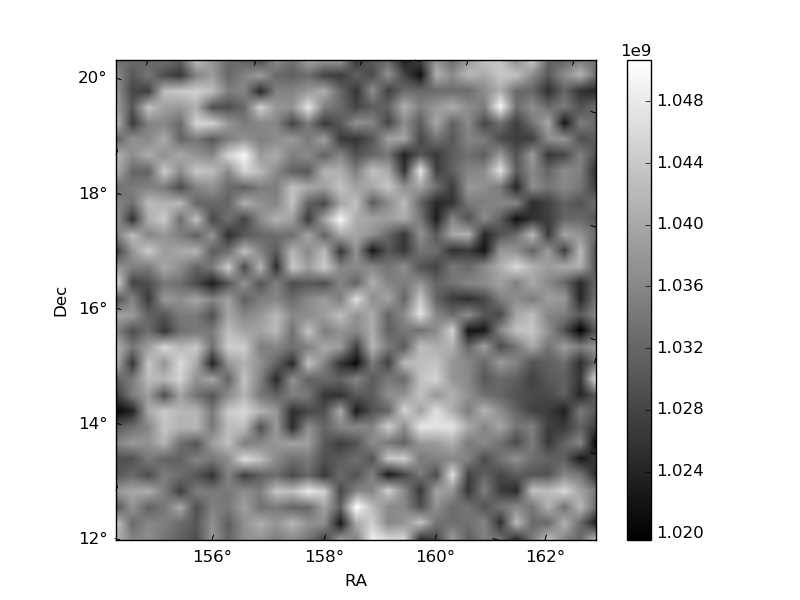
Quadrant B |
|---|---|---|---|
| Quadrant D | 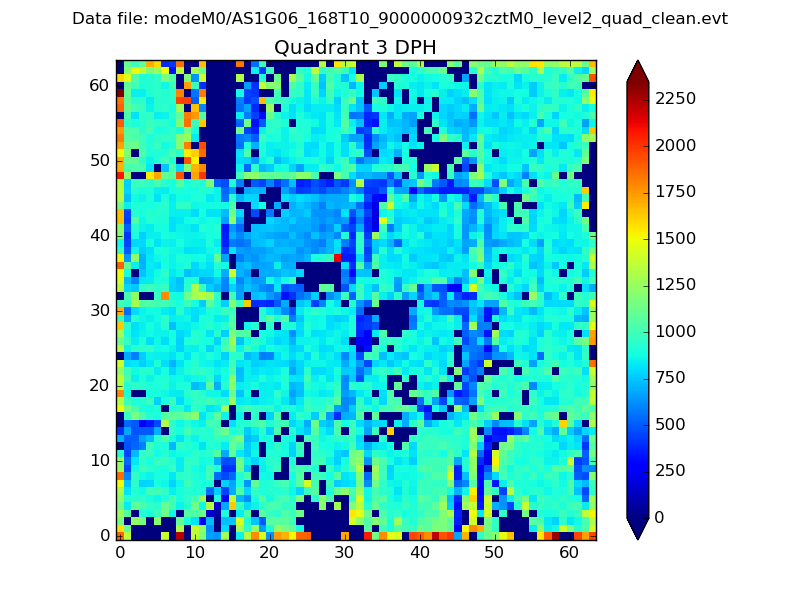 |
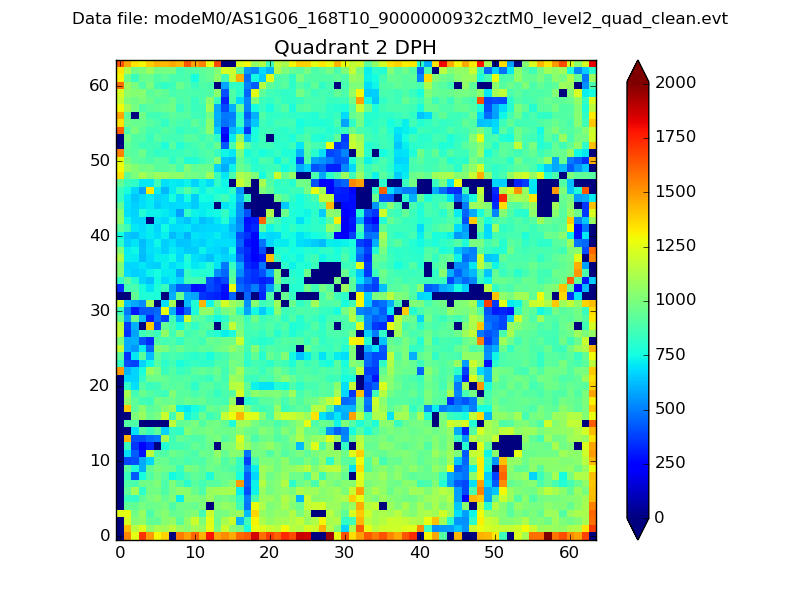 |
Quadrant C |
| Plot type | Count rate plots | Images |
|---|---|---|
| Comparison with Poisson distribution Blue bars denote a histogram of data divided into 1 sec bins. Red curve is a Poisson curve with rate = median count rate of data. |
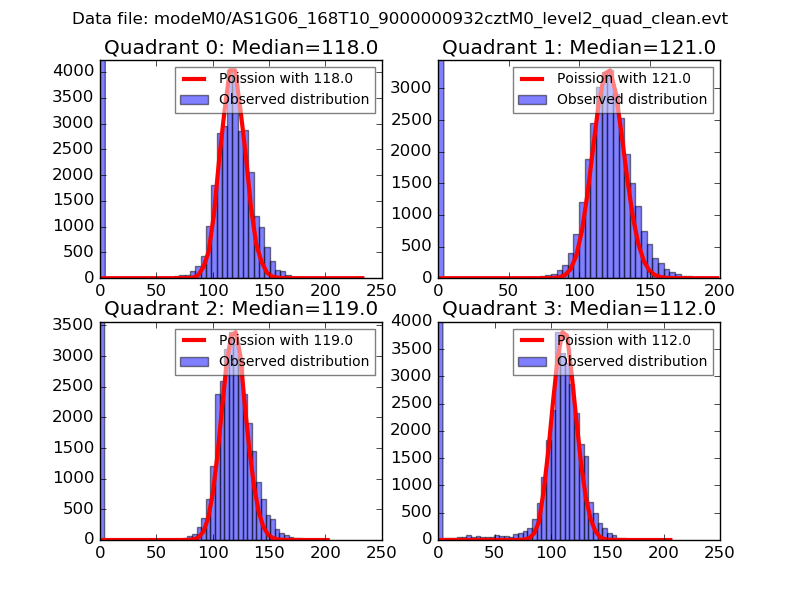 |
 |
| Quadrant-wise count rates Data is divided into 100 sec bins |
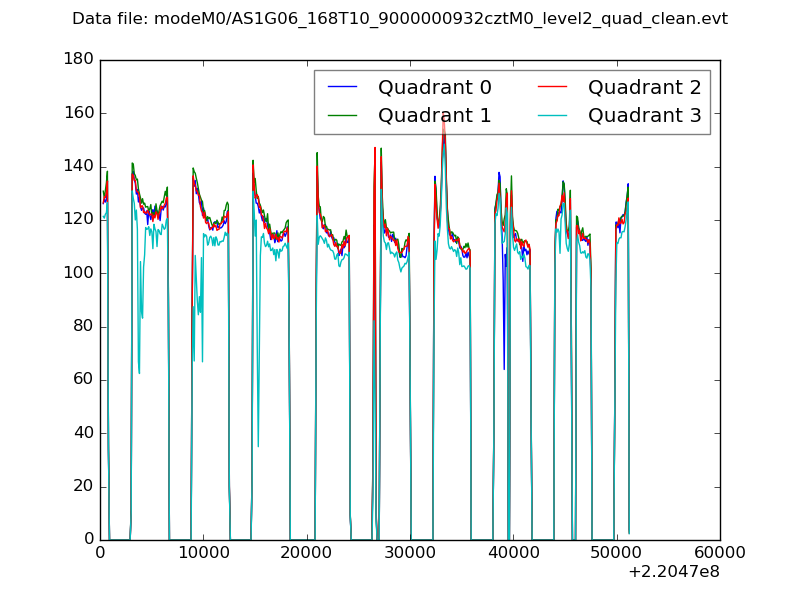 |
|
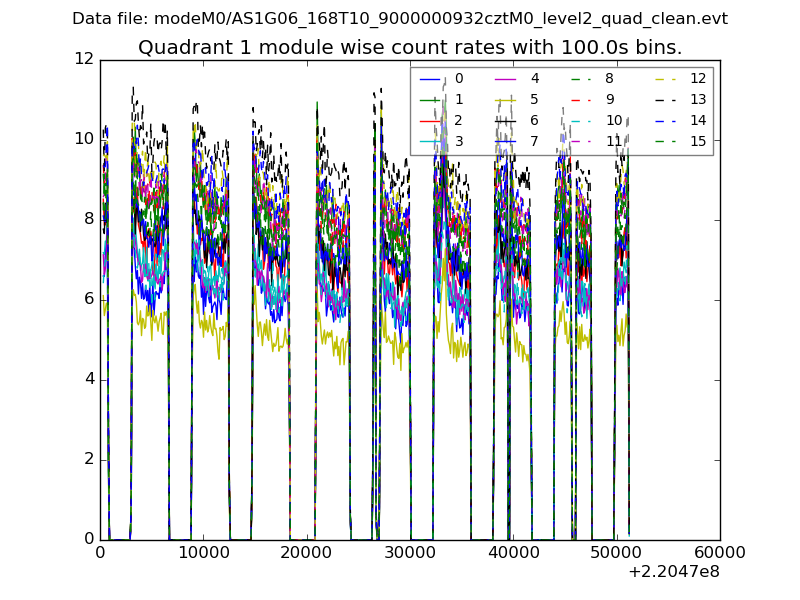
| Module-wise count rates for Quadrant A Data is divided into 100 sec bins |
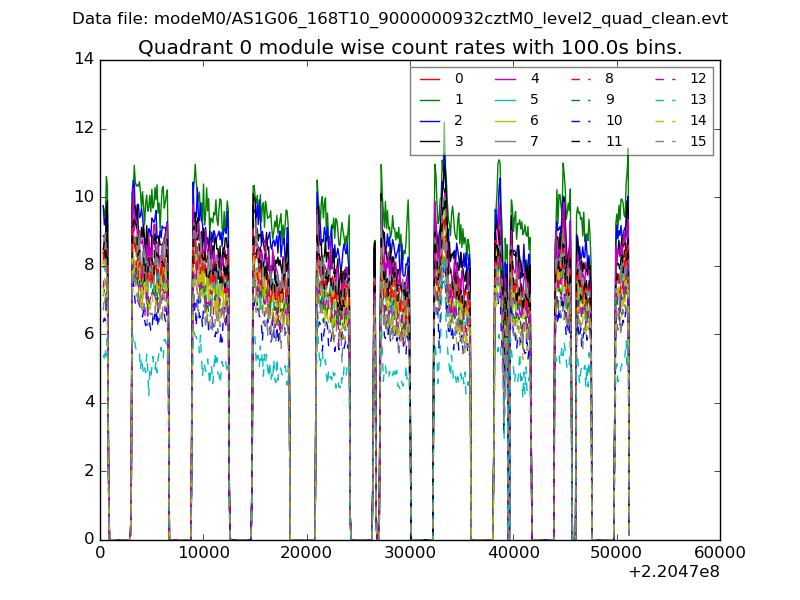 |
 |
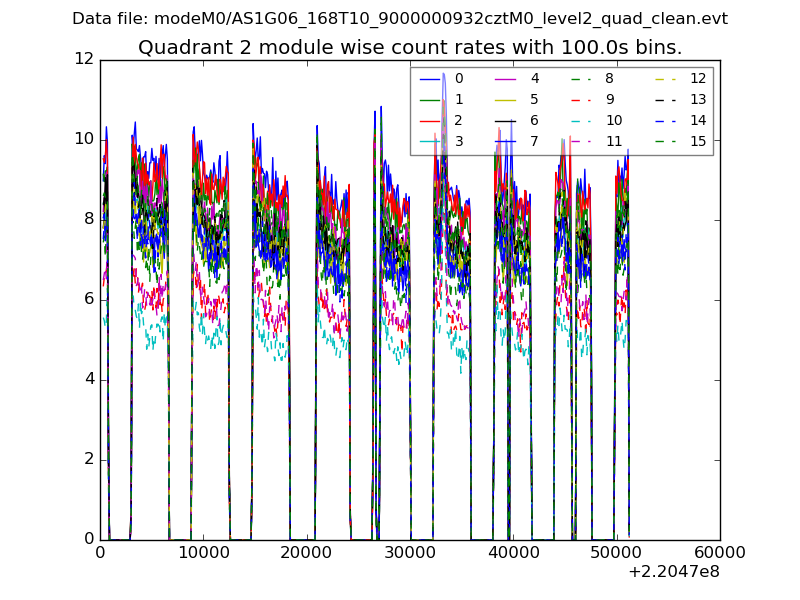
| Module-wise count rates for Quadrant B Data is divided into 100 sec bins |
 |
 |
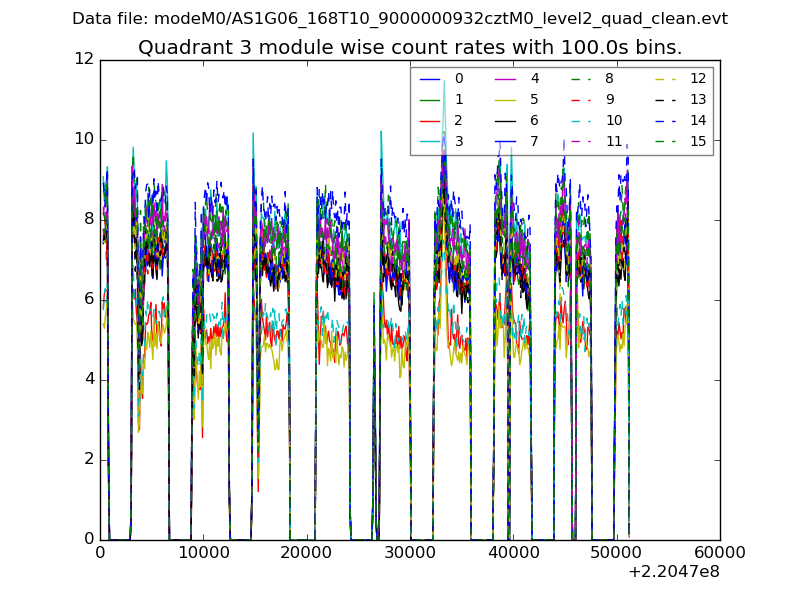
| Module-wise count rates for Quadrant C Data is divided into 100 sec bins |
 |
 |
| Module-wise count rates for Quadrant D Data is divided into 100 sec bins |
 |
 |
| Parameter | Plot |
|---|---|
| CZT HV Monitor | 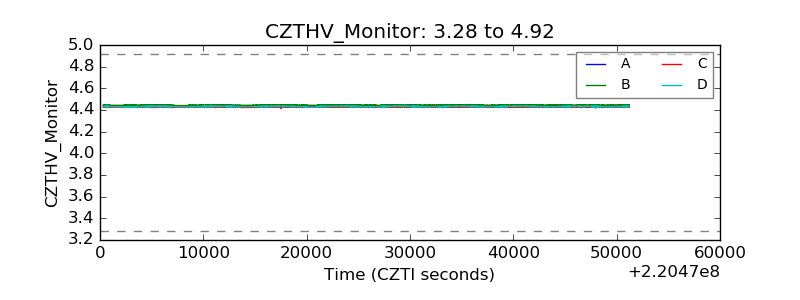 |
| D_VDD | 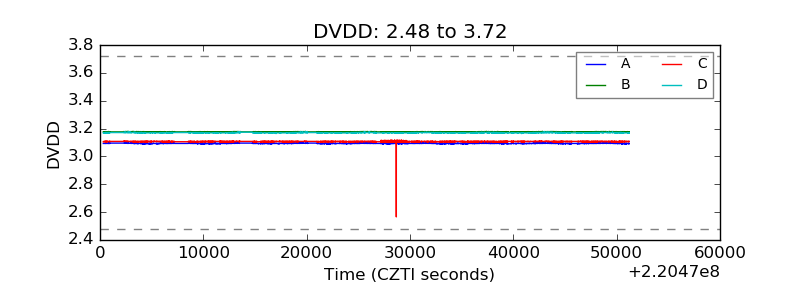 |
| Temperature 1 | 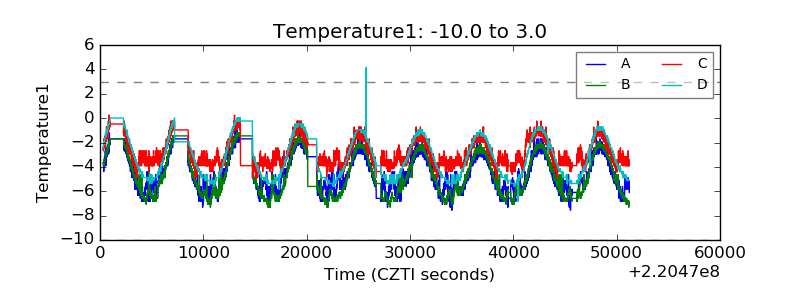 |
| Veto HV Monitor | 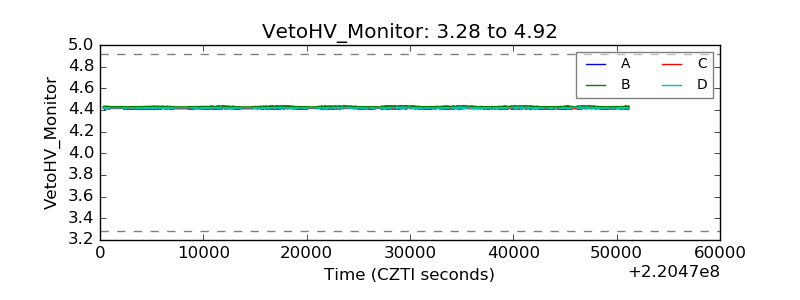 |
| Veto LLD | 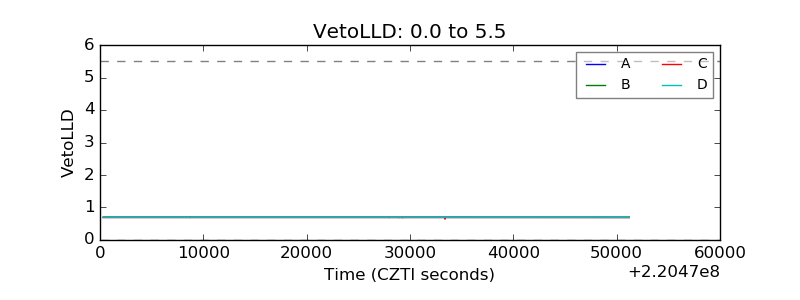 |
| Alpha Counter | 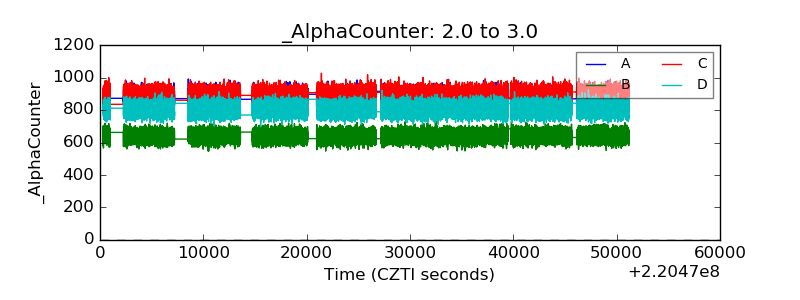 |
| _CPM_Rate | 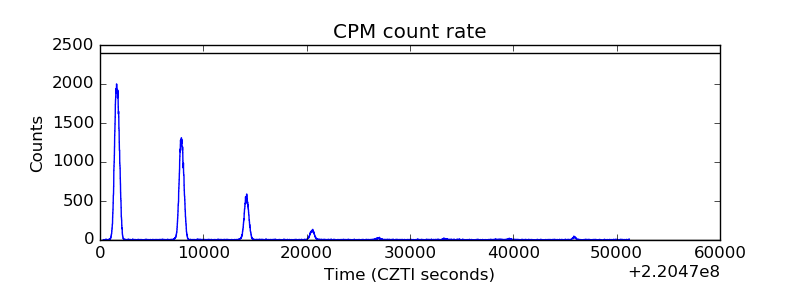 |
| CZT Counter | 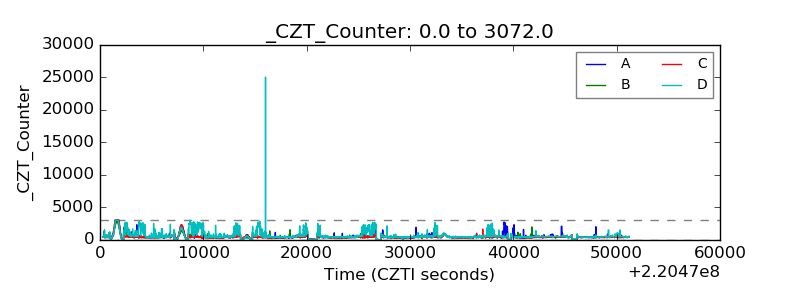 |
| +2.5 Volts monitor | 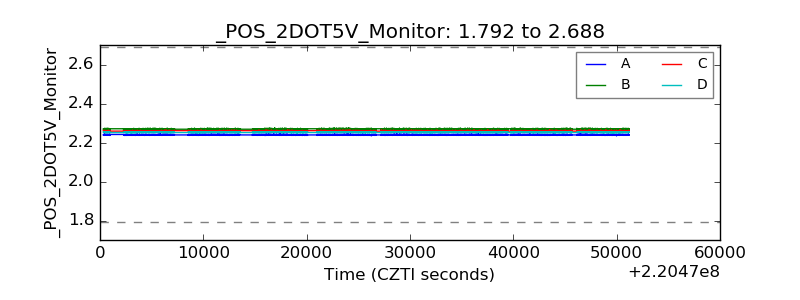 |
| +5 Volts monitor | 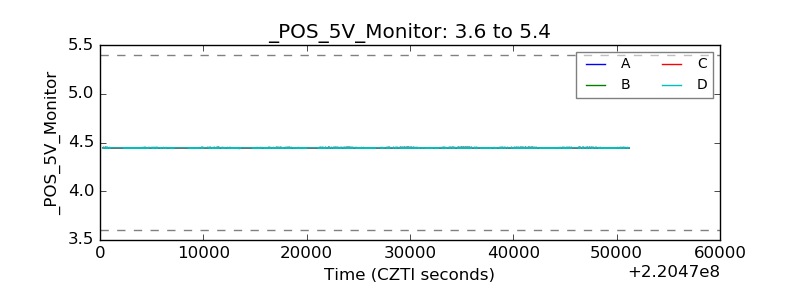 |
| _ROLL_ROT | 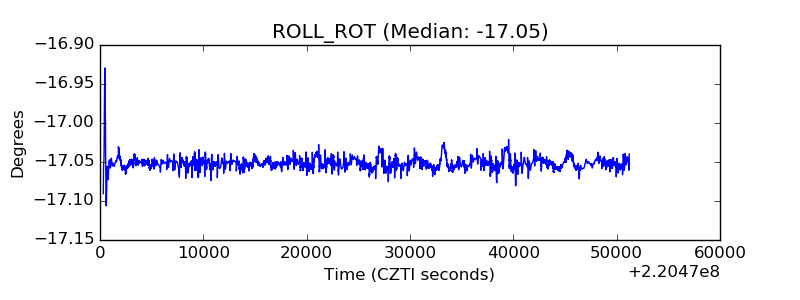 |
| _Roll_DEC | 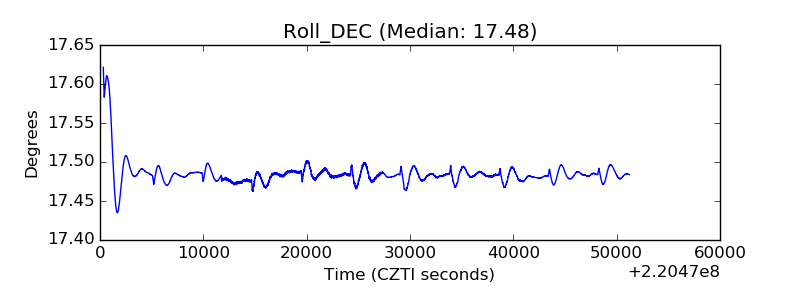 |
| _Roll_RA | 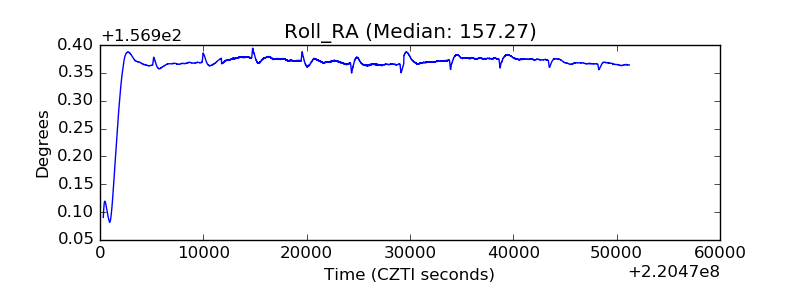 |
| Veto Counter | 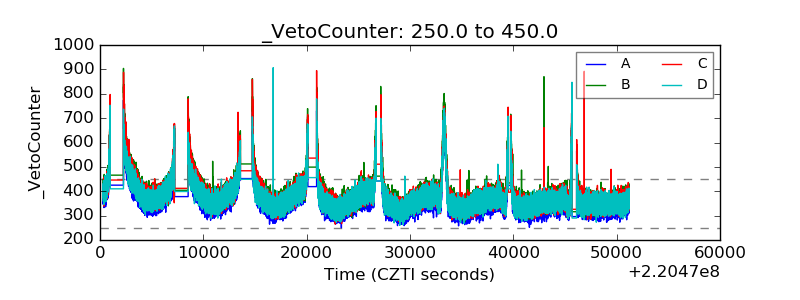 |