| Param | Original file | Final file |
|---|---|---|
| Filename | modeM0/AS1G06_168T10_9000000932_06744cztM0_level2.evt | modeM0/AS1G06_168T10_9000000932_06744cztM0_level2_quad_clean.evt |
| Size (bytes) | 196,096,320 | 23,641,920 |
| Size | 187.0 MB | 22.5 MB |
| Events in quadrant A | 1,330,455 | 141,795 |
| Events in quadrant B | 1,324,496 | 146,773 |
| Events in quadrant C | 1,116,023 | 143,006 |
| Events in quadrant D | 2,026,092 | 134,475 |
| Mode M9 | |||
|---|---|---|---|
| Quadrant | BADHDUFLAG | Total packets | Discarded packets |
| A | 0 | 13 | 0 |
| B | 0 | 13 | 0 |
| C | 0 | 13 | 0 |
| D | 0 | 13 | 0 |
| Mode SS | |||
|---|---|---|---|
| Quadrant | BADHDUFLAG | Total packets | Discarded packets |
| A | 0 | 42 | 0 |
| B | 0 | 42 | 0 |
| C | 0 | 42 | 0 |
| D | 0 | 42 | 0 |
| Mode M0 | |||
|---|---|---|---|
| Quadrant | BADHDUFLAG | Total packets | Discarded packets |
| A | 0 | 5271 | 2 |
| B | 0 | 5220 | 1 |
| C | 0 | 4530 | 1 |
| D | 0 | 7418 | 1 |
| Quadrant | Total seconds | Saturated seconds | Saturation percentage |
|---|---|---|---|
| A | 2061 | 97 | 4.706453% |
| B | 2061 | 114 | 5.531295% |
| C | 2061 | 42 | 2.037846% |
| D | 2061 | 331 | 16.060165% |
Noise dominated data is calculated using 1-second bins in cleaned event files. If a bin has >2000 counts, and if more than 50% of those come from <1% of pixels, then it is considered to be noise-dominated and hence unusable.
| Quadrant | # 1 sec bins | Bins with >0 counts | Bins with >2000 counts | High rate bins dominated by noise | Noise dominated (total time) | Noise dominated (detector-on time) | Marked lightcurve |
|---|---|---|---|---|---|---|---|
| A | 3346 | 2062 | 19 | 19 | 0.57% | 0.92% | 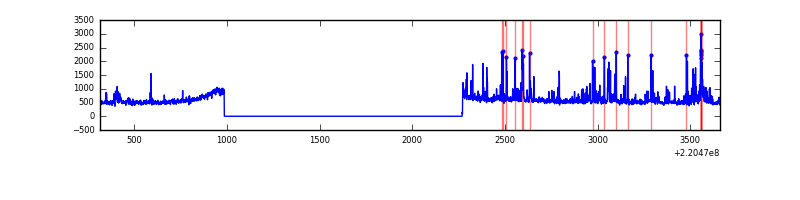 |
| B | 3346 | 2062 | 13 | 13 | 0.39% | 0.63% | 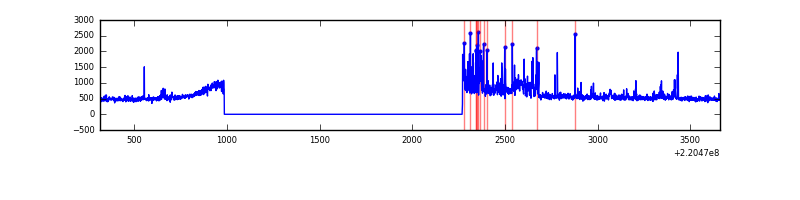 |
| C | 3346 | 2062 | 0 | 0 | 0.00% | 0.00% | 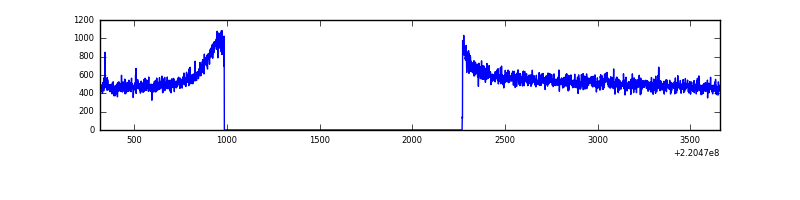 |
| D | 3346 | 2062 | 201 | 201 | 6.01% | 9.75% | 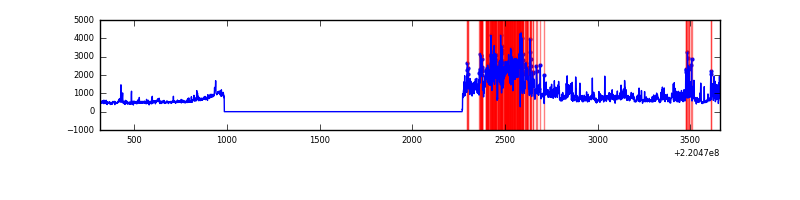 |
Top three noisy pixels from each quadrant. If the there are fewer than three noisy pixels in the level2.evt file, extra rows are filled as -1
| Pixel properties | Quadrant properties | ||||||
|---|---|---|---|---|---|---|---|
| Quadrant | DetID | PixID | Counts | Sigma | Mean | Median | Sigma |
| A | 13 | 248 | 71041 | 1164.32 | 286 | 280 | 60.8 |
| A | 4 | 2 | 65195 | 1068.13 | 286 | 280 | 60.8 |
| A | 13 | 251 | 55549 | 909.41 | 286 | 280 | 60.8 |
| B | 4 | 48 | 79982 | 1393.95 | 287 | 281 | 57.2 |
| B | 4 | 80 | 46549 | 809.22 | 287 | 281 | 57.2 |
| B | 4 | 170 | 30606 | 530.38 | 287 | 281 | 57.2 |
| C | 9 | 247 | 14569 | 210.59 | 281 | 282 | 67.8 |
| C | 13 | 61 | 2232 | 28.74 | 281 | 282 | 67.8 |
| C | 12 | 4 | 2101 | 26.81 | 281 | 282 | 67.8 |
| D | 2 | 33 | 667130 | 9915.73 | 264 | 255 | 67.3 |
| D | 2 | 152 | 150907 | 2240.04 | 264 | 255 | 67.3 |
| D | 8 | 195 | 78870 | 1168.92 | 264 | 255 | 67.3 |
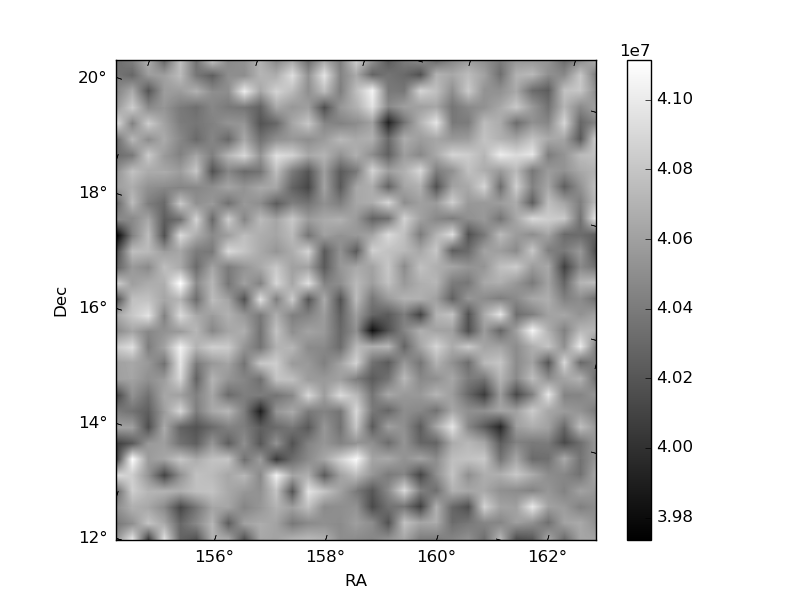
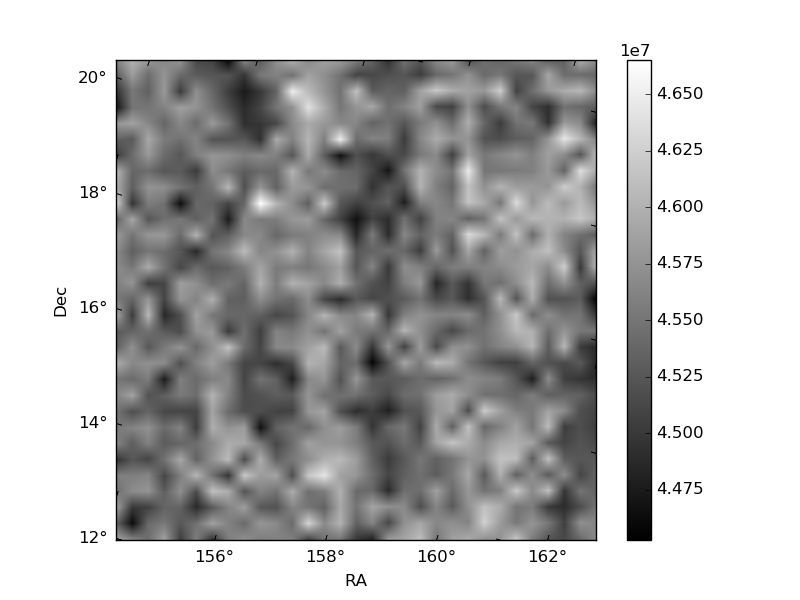
Histogram calculated using DETX and DETY for each event in the final _common_clean file
| Quadrant A | 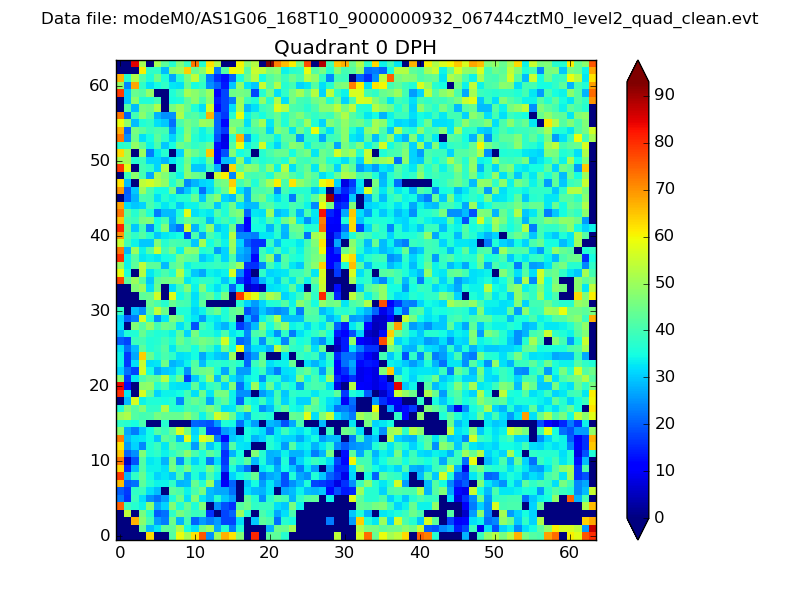 |
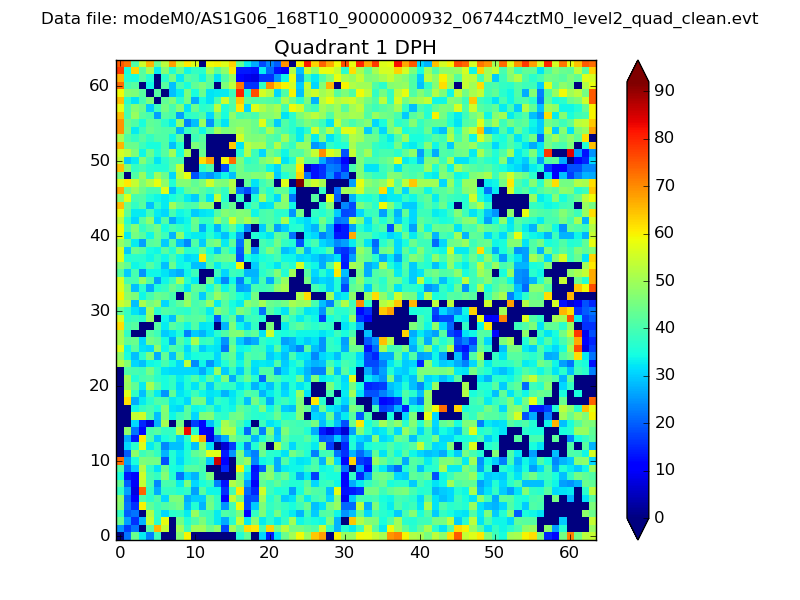 |
Quadrant B |
|---|---|---|---|
| Quadrant D | 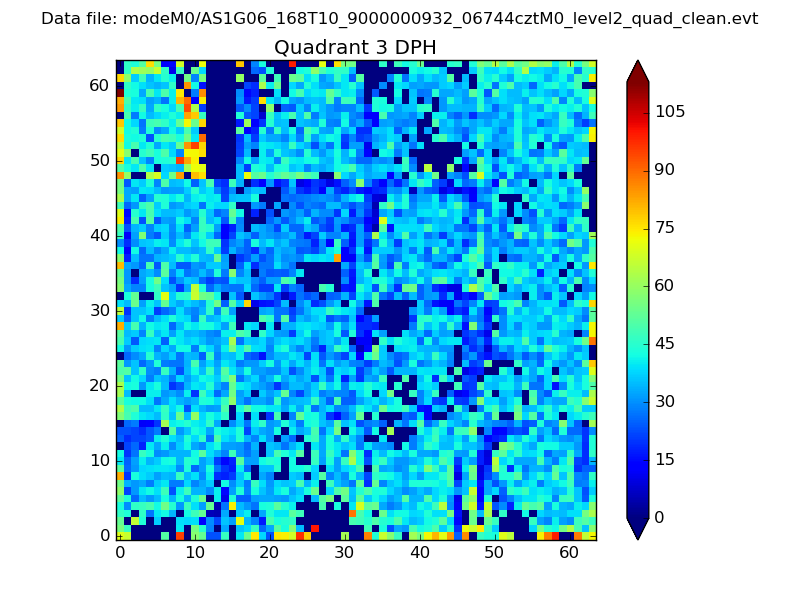 |
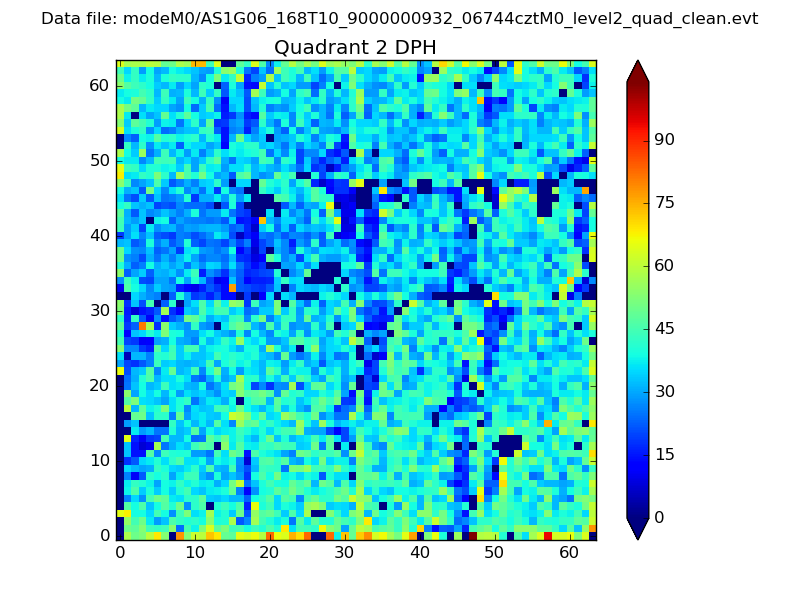 |
Quadrant C |
| Plot type | Count rate plots | Images |
|---|---|---|
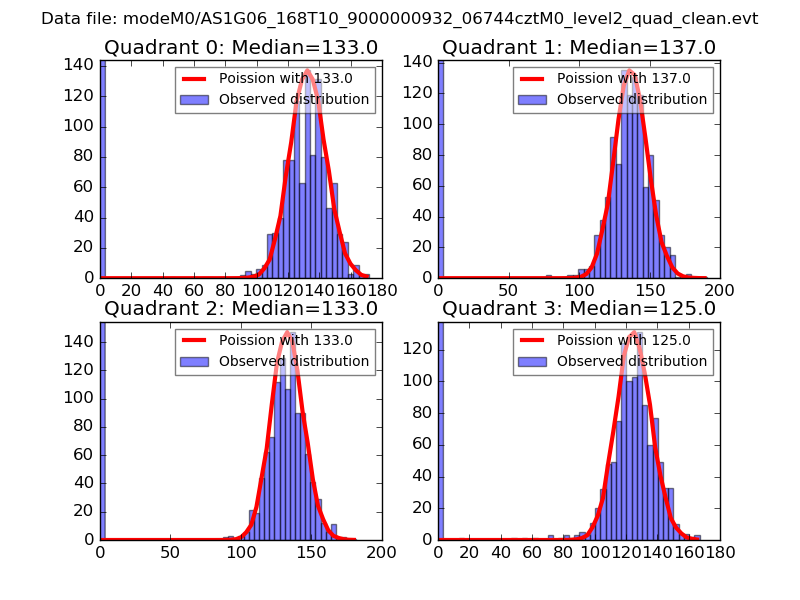
| Comparison with Poisson distribution Blue bars denote a histogram of data divided into 1 sec bins. Red curve is a Poisson curve with rate = median count rate of data. |
 |
 |
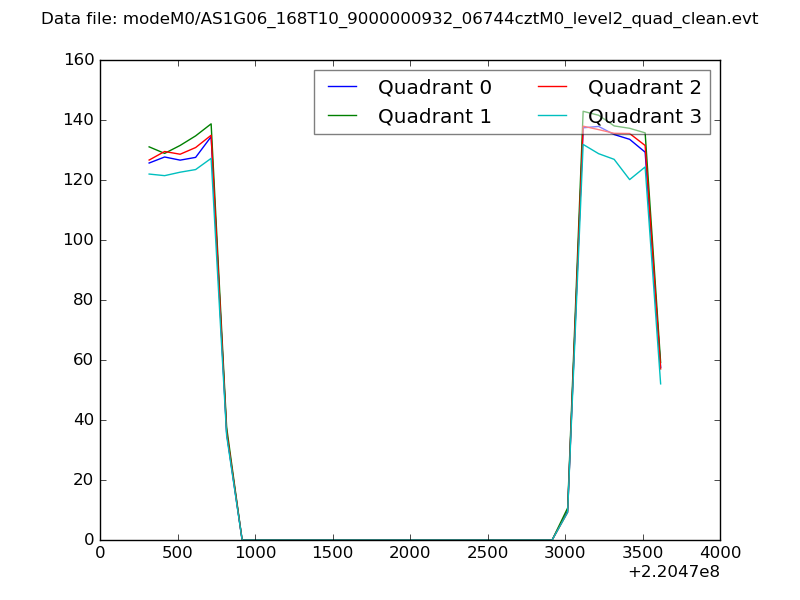
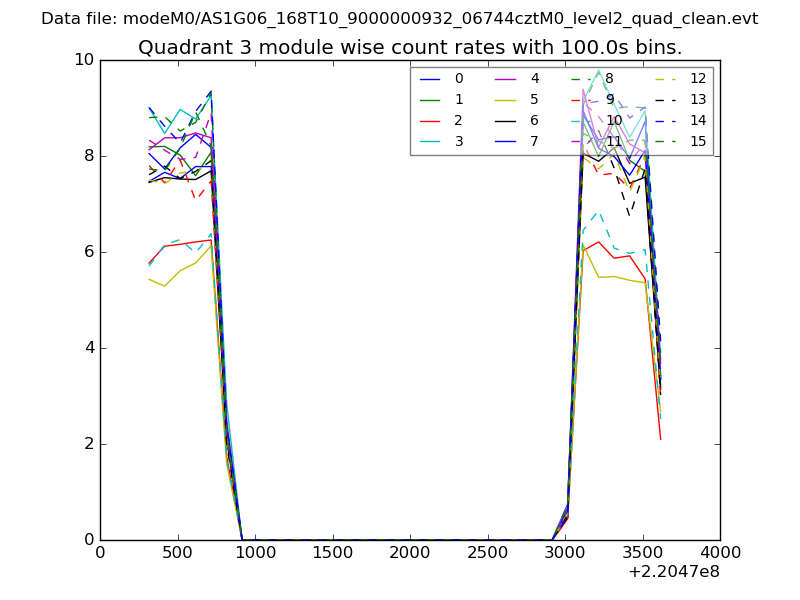
| Quadrant-wise count rates Data is divided into 100 sec bins |
 |
|
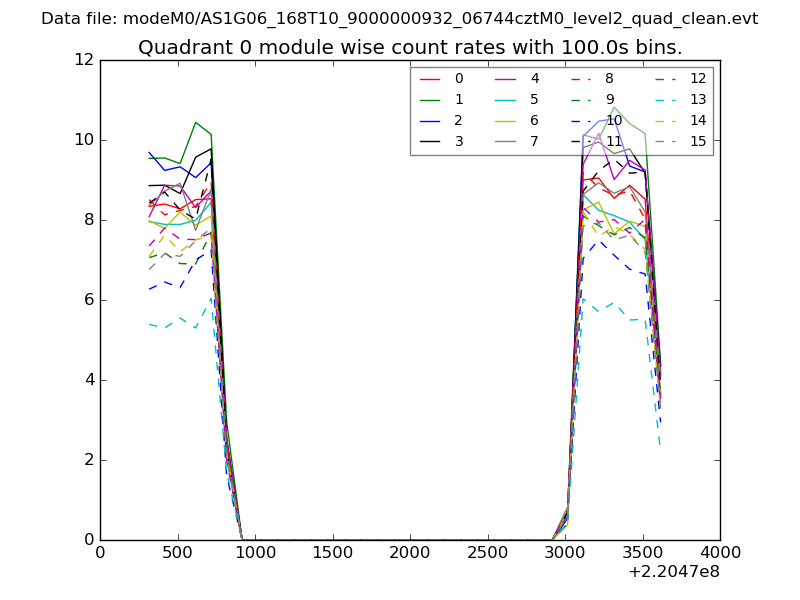
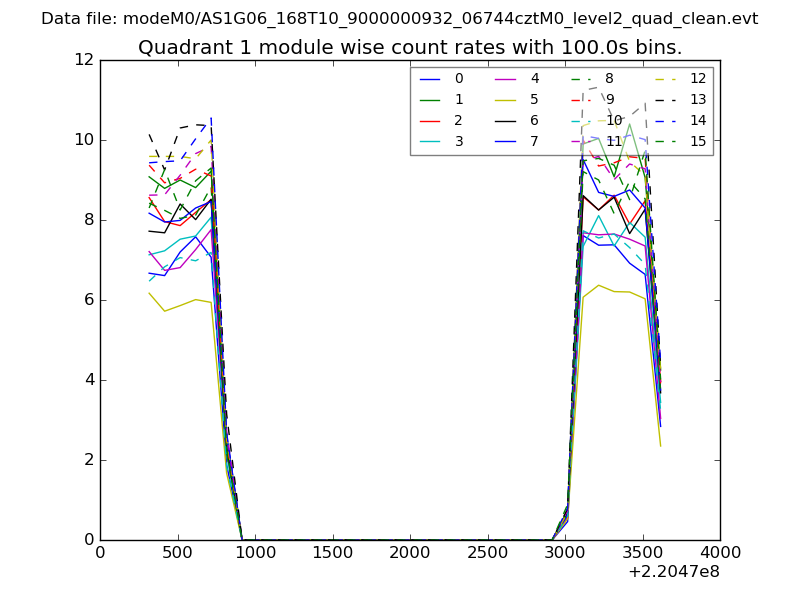
| Module-wise count rates for Quadrant A Data is divided into 100 sec bins |
 |
 |
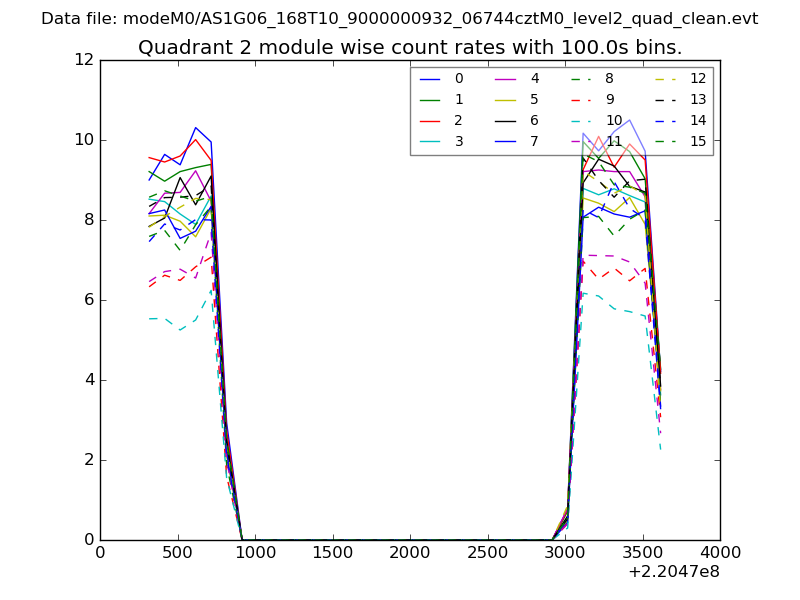
| Module-wise count rates for Quadrant B Data is divided into 100 sec bins |
 |
 |
| Module-wise count rates for Quadrant C Data is divided into 100 sec bins |
 |
 |
| Module-wise count rates for Quadrant D Data is divided into 100 sec bins |
 |
 |
| Parameter | Plot |
|---|---|
| CZT HV Monitor | 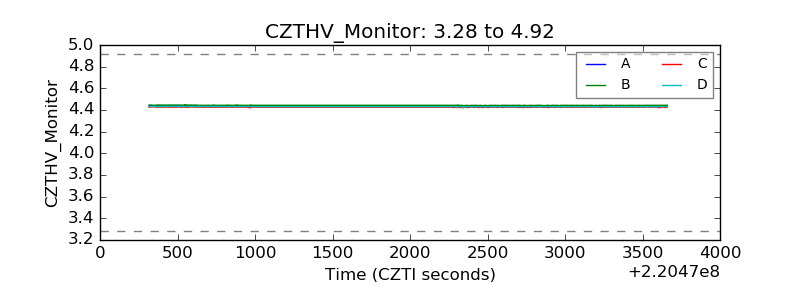 |
| D_VDD | 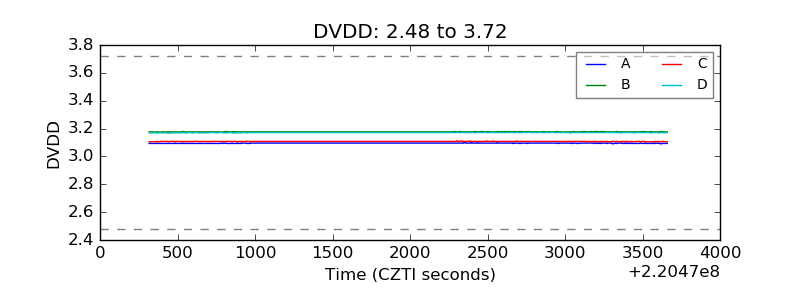 |
| Temperature 1 | 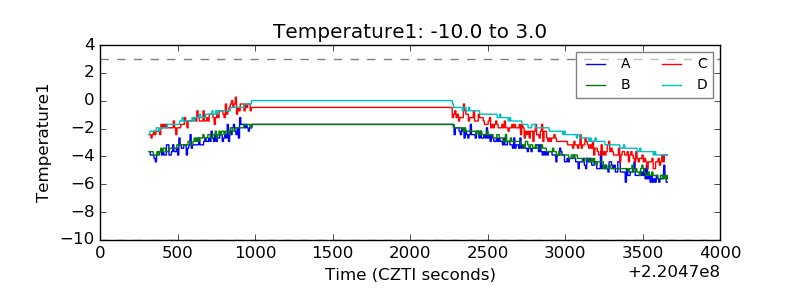 |
| Veto HV Monitor | 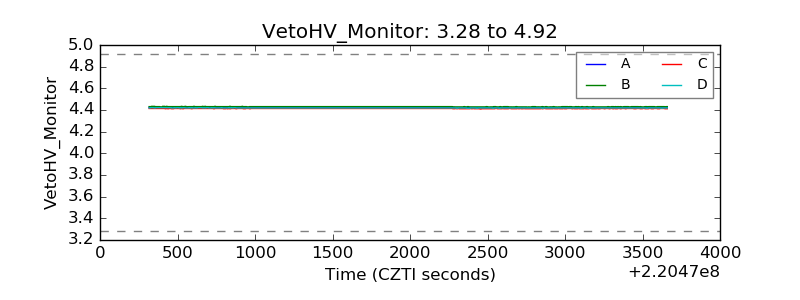 |
| Veto LLD | 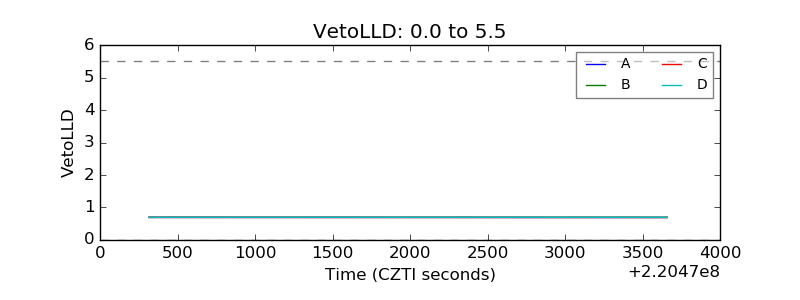 |
| Alpha Counter | 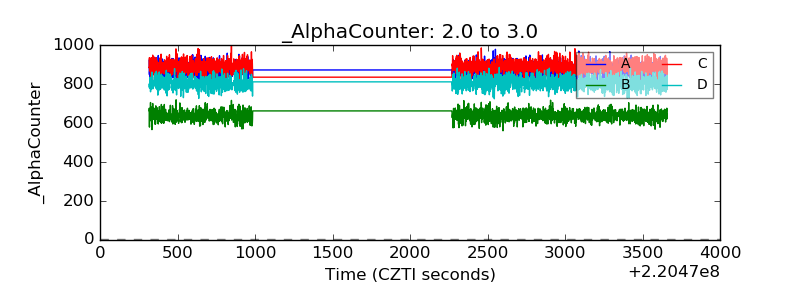 |
| _CPM_Rate | 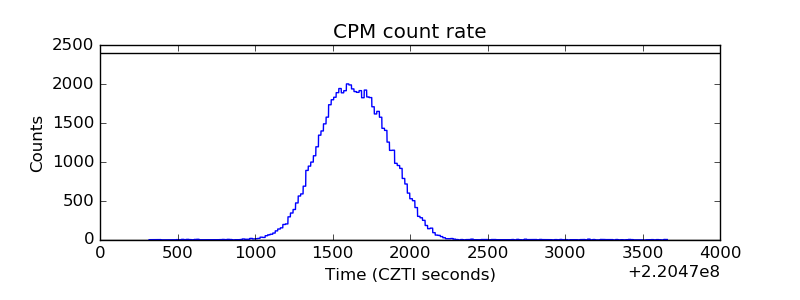 |
| CZT Counter | 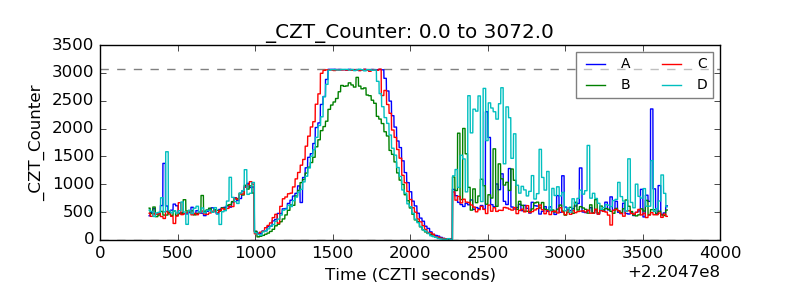 |
| +2.5 Volts monitor |  |
| +5 Volts monitor |  |
| _ROLL_ROT | 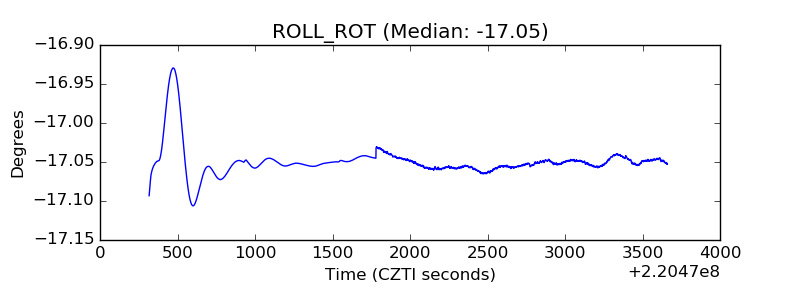 |
| _Roll_DEC | 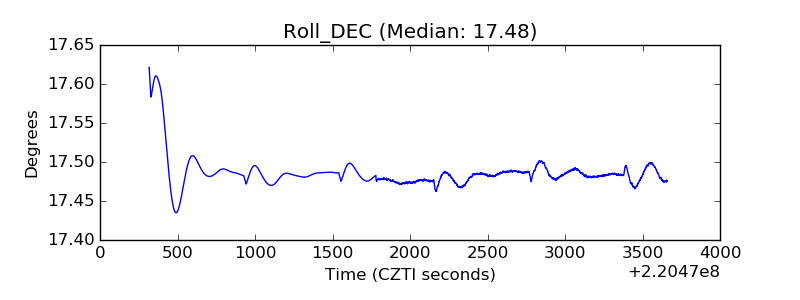 |
| _Roll_RA | 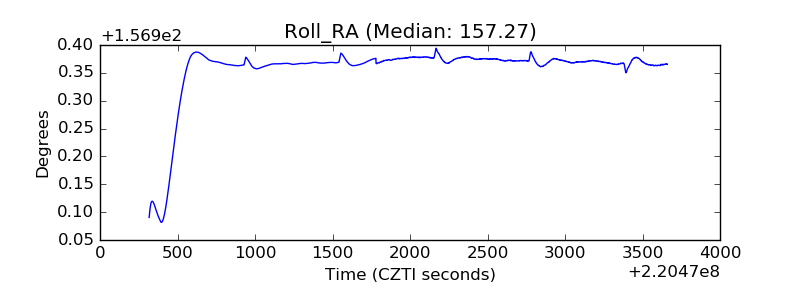 |
| Veto Counter | 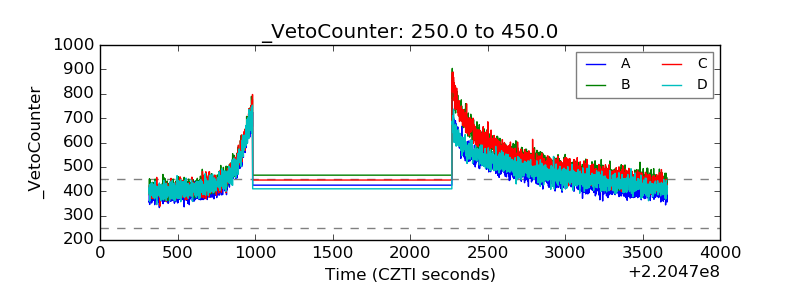 |