| Param | Original file | Final file |
|---|---|---|
| Filename | modeM0/AS1G06_168T10_9000000932_06745cztM0_level2.evt | modeM0/AS1G06_168T10_9000000932_06745cztM0_level2_quad_clean.evt |
| Size (bytes) | 641,214,720 | 100,903,680 |
| Size | 611.5 MB | 96.2 MB |
| Events in quadrant A | 3,764,045 | 659,296 |
| Events in quadrant B | 3,802,918 | 675,676 |
| Events in quadrant C | 3,428,524 | 661,909 |
| Events in quadrant D | 7,942,202 | 563,636 |
| Mode M9 | |||
|---|---|---|---|
| Quadrant | BADHDUFLAG | Total packets | Discarded packets |
| A | 0 | 26 | 0 |
| B | 0 | 26 | 0 |
| C | 0 | 26 | 0 |
| D | 0 | 26 | 0 |
| Mode SS | |||
|---|---|---|---|
| Quadrant | BADHDUFLAG | Total packets | Discarded packets |
| A | 0 | 146 | 0 |
| B | 0 | 146 | 0 |
| C | 0 | 146 | 0 |
| D | 0 | 146 | 0 |
| Mode M0 | |||
|---|---|---|---|
| Quadrant | BADHDUFLAG | Total packets | Discarded packets |
| A | 0 | 15961 | 4 |
| B | 0 | 16000 | 3 |
| C | 0 | 14875 | 3 |
| D | 0 | 28391 | 3 |
| Quadrant | Total seconds | Saturated seconds | Saturation percentage |
|---|---|---|---|
| A | 7107 | 126 | 1.772900% |
| B | 7107 | 153 | 2.152807% |
| C | 7107 | 55 | 0.773885% |
| D | 7107 | 1591 | 22.386380% |
Noise dominated data is calculated using 1-second bins in cleaned event files. If a bin has >2000 counts, and if more than 50% of those come from <1% of pixels, then it is considered to be noise-dominated and hence unusable.
| Quadrant | # 1 sec bins | Bins with >0 counts | Bins with >2000 counts | High rate bins dominated by noise | Noise dominated (total time) | Noise dominated (detector-on time) | Marked lightcurve |
|---|---|---|---|---|---|---|---|
| A | 9737 | 7110 | 20 | 20 | 0.21% | 0.28% | 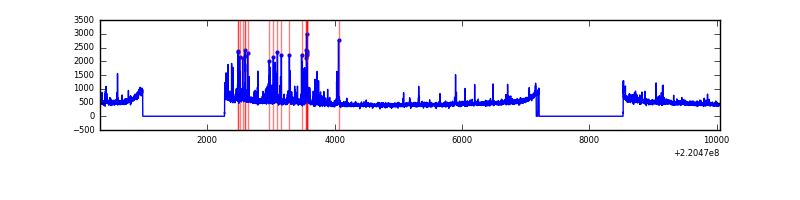 |
| B | 9737 | 7110 | 16 | 16 | 0.16% | 0.23% | 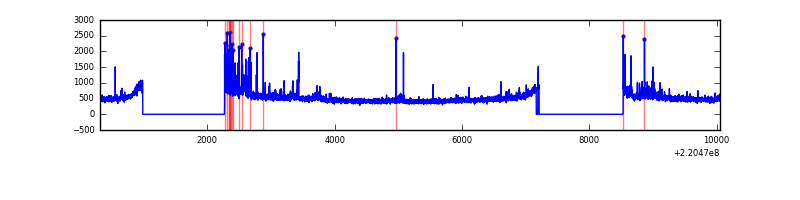 |
| C | 9737 | 7110 | 0 | 0 | 0.00% | 0.00% | 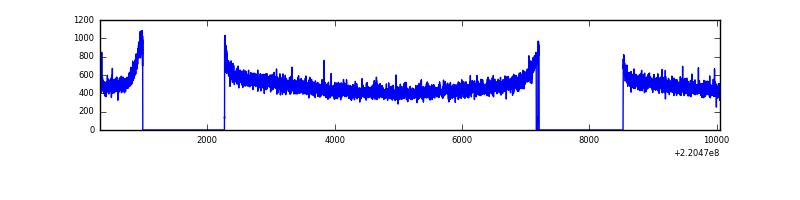 |
| D | 9737 | 7110 | 1389 | 1389 | 14.27% | 19.54% |  |
Top three noisy pixels from each quadrant. If the there are fewer than three noisy pixels in the level2.evt file, extra rows are filled as -1
| Pixel properties | Quadrant properties | ||||||
|---|---|---|---|---|---|---|---|
| Quadrant | DetID | PixID | Counts | Sigma | Mean | Median | Sigma |
| A | 13 | 251 | 106120 | 584.09 | 885 | 870 | 180.2 |
| A | 13 | 248 | 83152 | 456.63 | 885 | 870 | 180.2 |
| A | 4 | 2 | 80408 | 441.4 | 885 | 870 | 180.2 |
| B | 4 | 48 | 98655 | 571.77 | 897 | 878 | 171.0 |
| B | 4 | 80 | 47958 | 275.31 | 897 | 878 | 171.0 |
| B | 0 | 214 | 39143 | 223.76 | 897 | 878 | 171.0 |
| C | 9 | 247 | 34542 | 166.55 | 867 | 874 | 202.1 |
| C | 12 | 4 | 8130 | 35.9 | 867 | 874 | 202.1 |
| C | 13 | 61 | 6878 | 29.7 | 867 | 874 | 202.1 |
| D | 2 | 33 | 3720261 | 19520.07 | 775 | 752 | 190.5 |
| D | 14 | 34 | 487167 | 2552.72 | 775 | 752 | 190.5 |
| D | 2 | 152 | 344400 | 1803.47 | 775 | 752 | 190.5 |
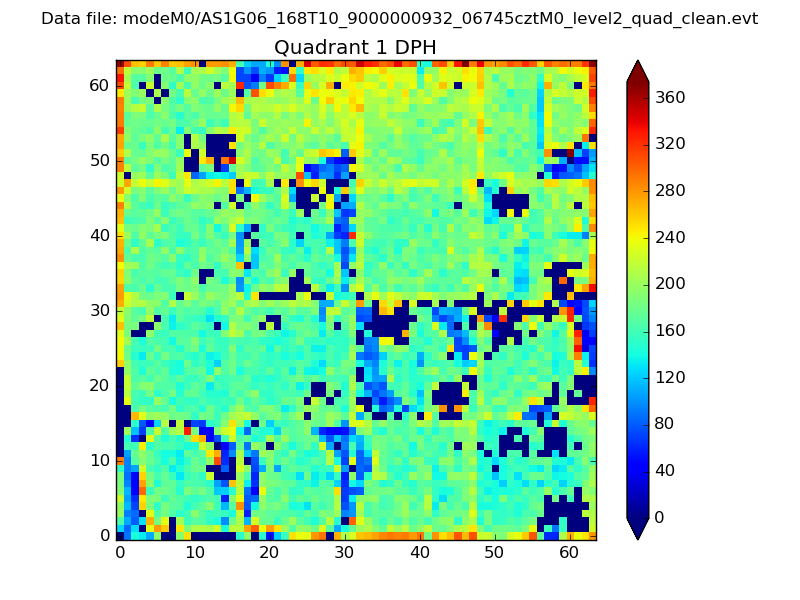
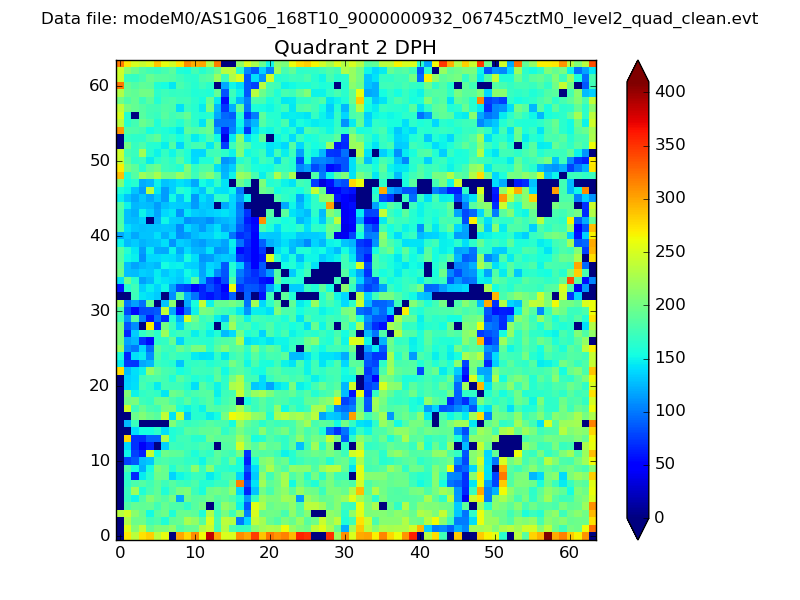
Histogram calculated using DETX and DETY for each event in the final _common_clean file
| Quadrant A | 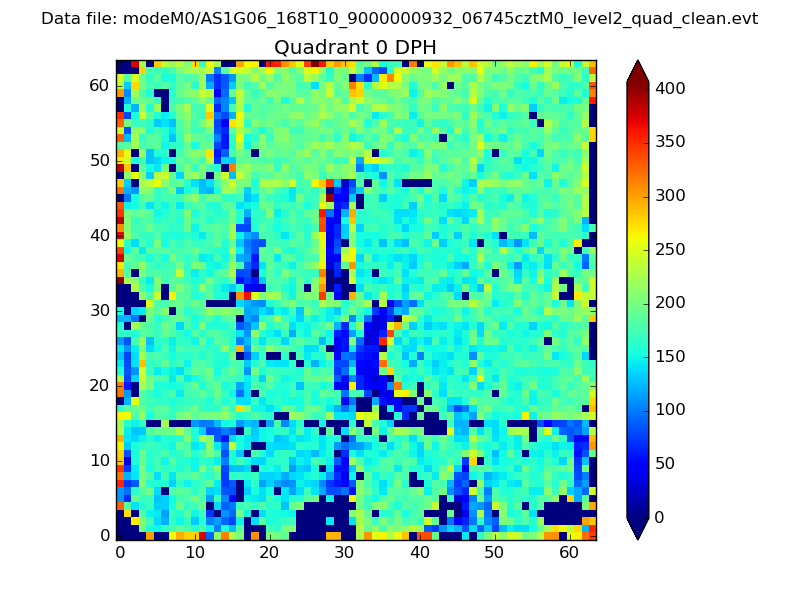 |
 |
Quadrant B |
|---|---|---|---|
| Quadrant D | 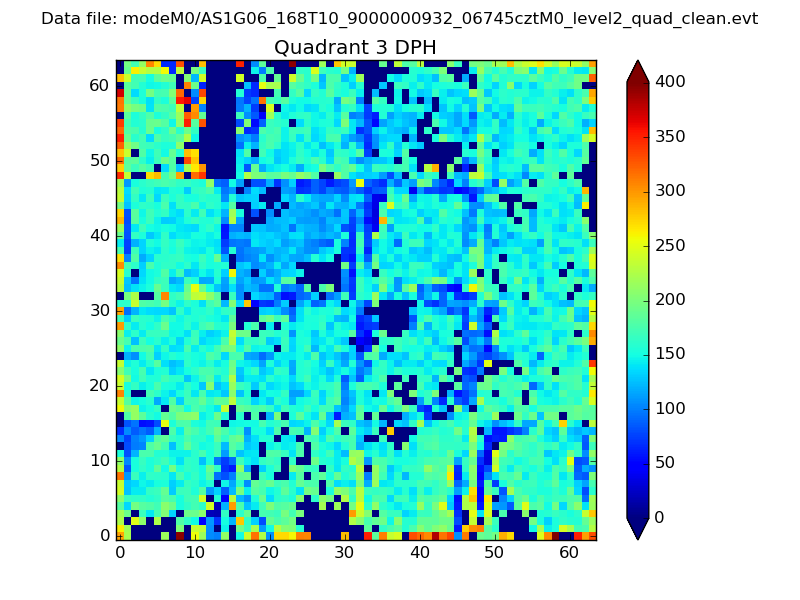 |
 |
Quadrant C |
| Plot type | Count rate plots | Images |
|---|---|---|
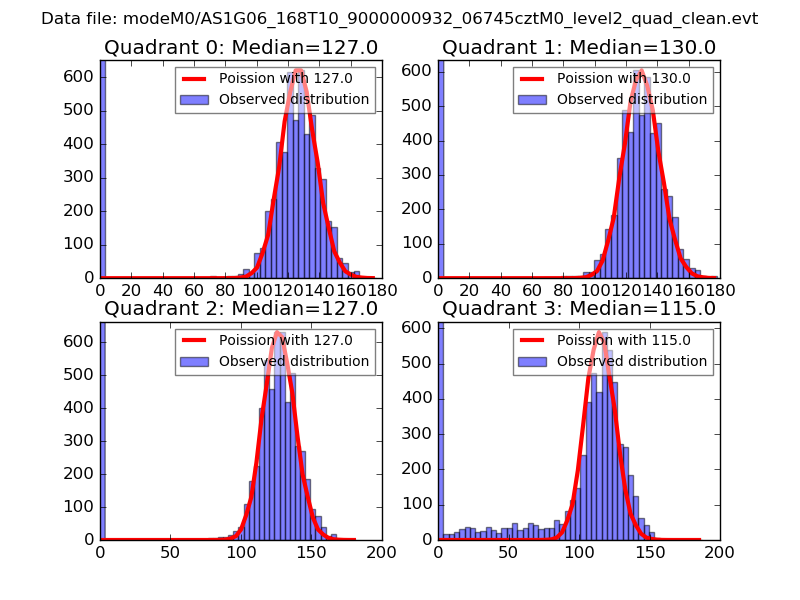
| Comparison with Poisson distribution Blue bars denote a histogram of data divided into 1 sec bins. Red curve is a Poisson curve with rate = median count rate of data. |
 |
 |
| Quadrant-wise count rates Data is divided into 100 sec bins |
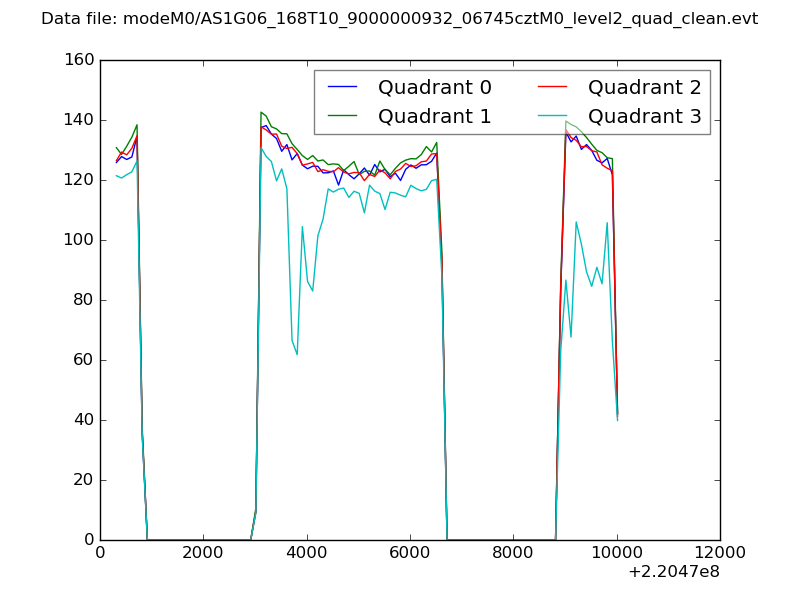 |
|
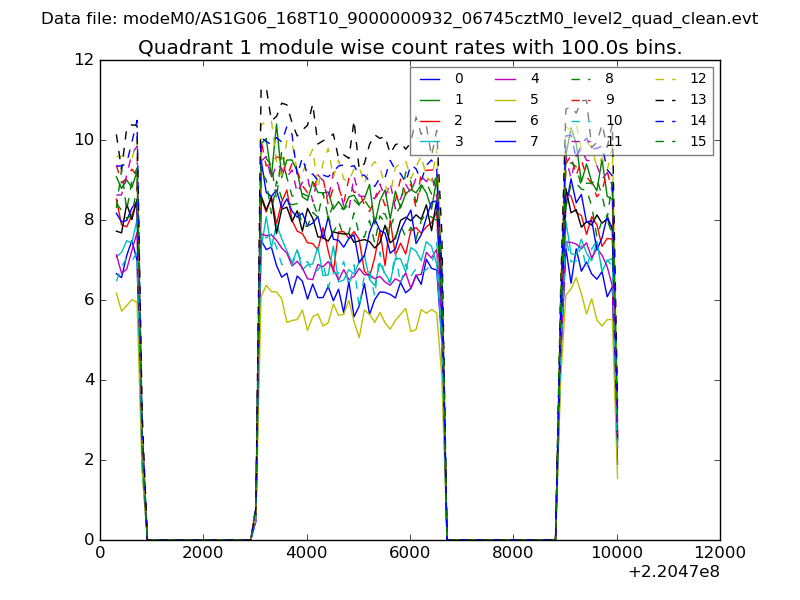
| Module-wise count rates for Quadrant A Data is divided into 100 sec bins |
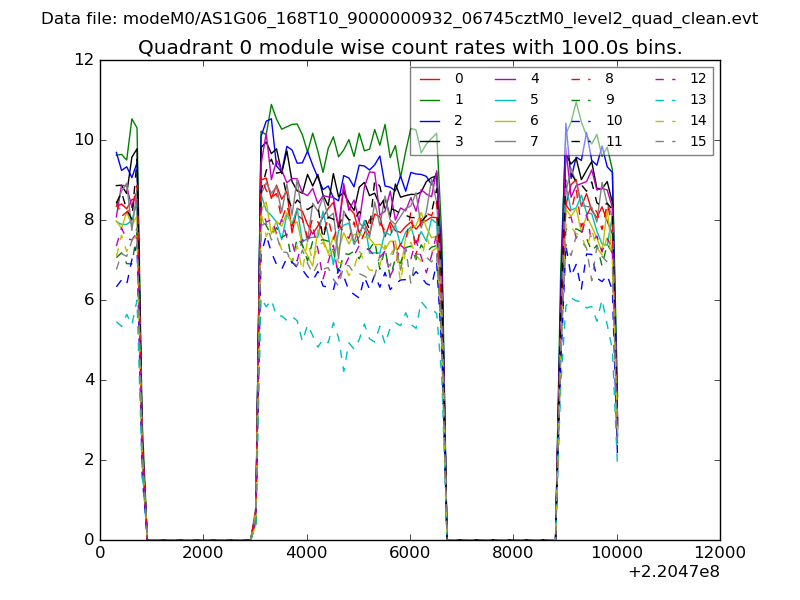 |
 |
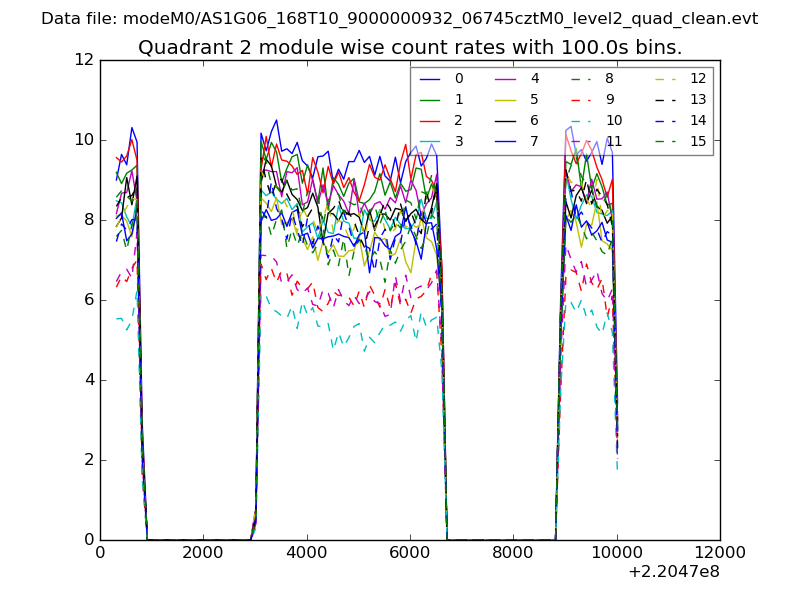
| Module-wise count rates for Quadrant B Data is divided into 100 sec bins |
 |
 |
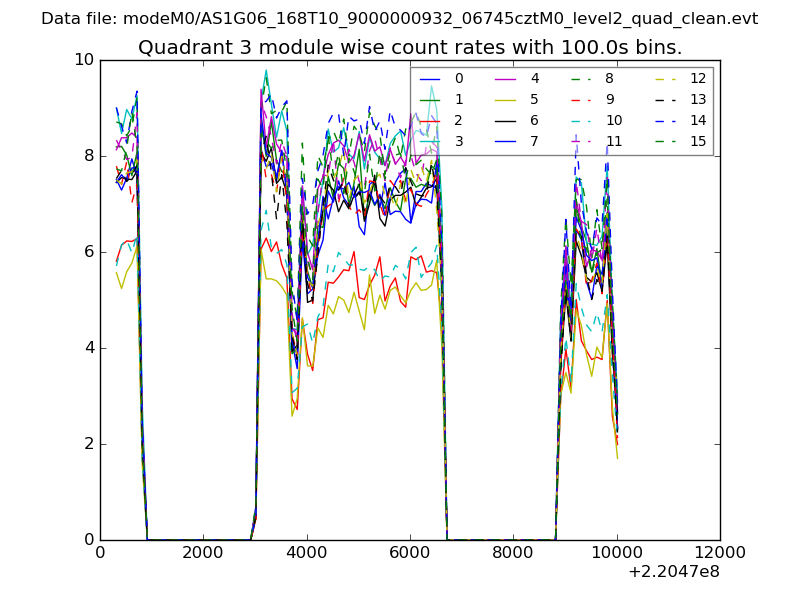
| Module-wise count rates for Quadrant C Data is divided into 100 sec bins |
 |
 |
| Module-wise count rates for Quadrant D Data is divided into 100 sec bins |
 |
 |
| Parameter | Plot |
|---|---|
| CZT HV Monitor | 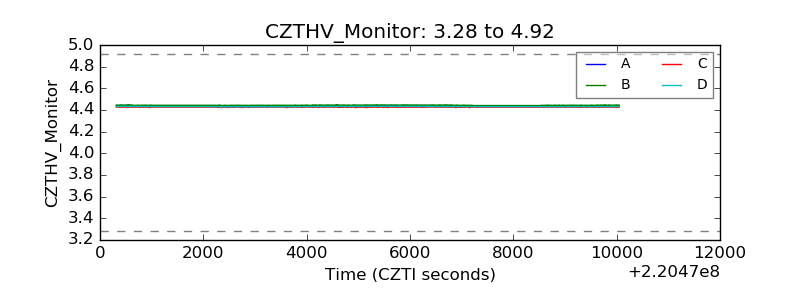 |
| D_VDD | 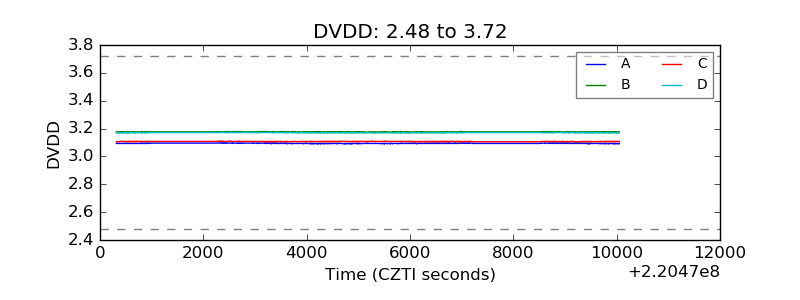 |
| Temperature 1 | 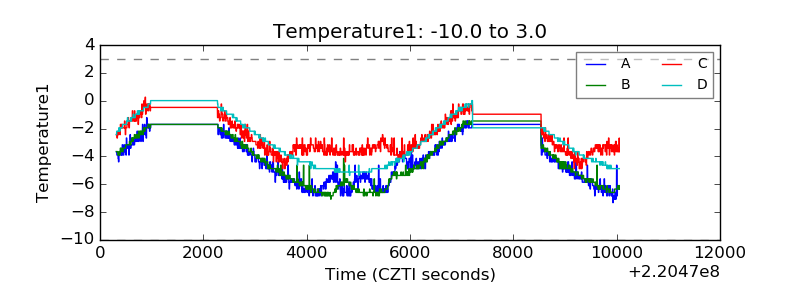 |
| Veto HV Monitor | 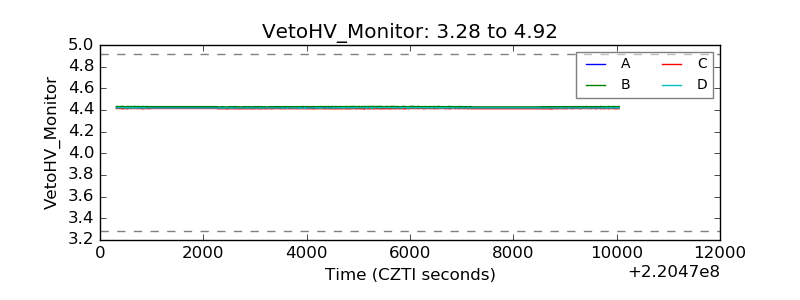 |
| Veto LLD | 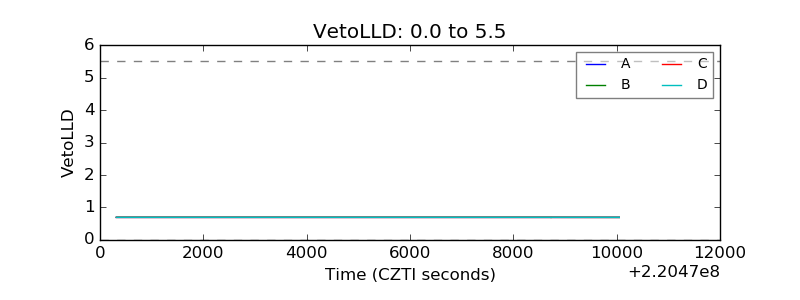 |
| Alpha Counter | 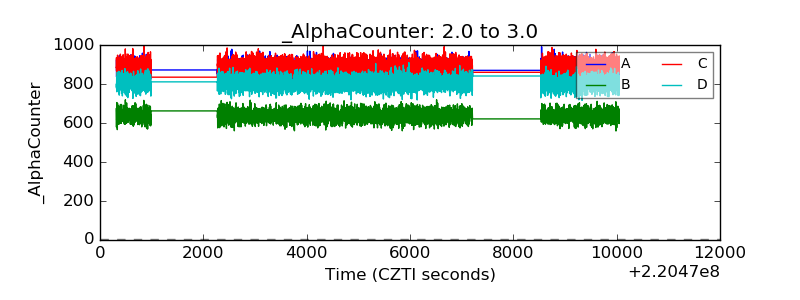 |
| _CPM_Rate | 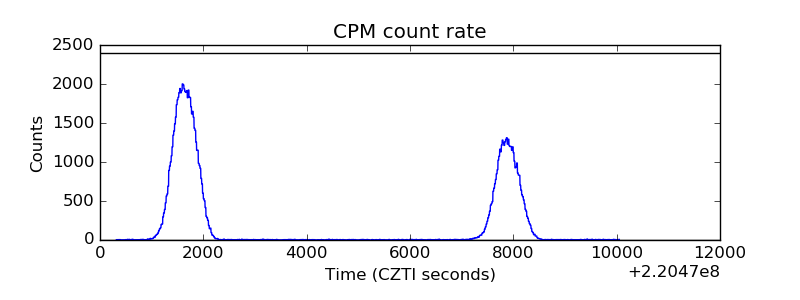 |
| CZT Counter | 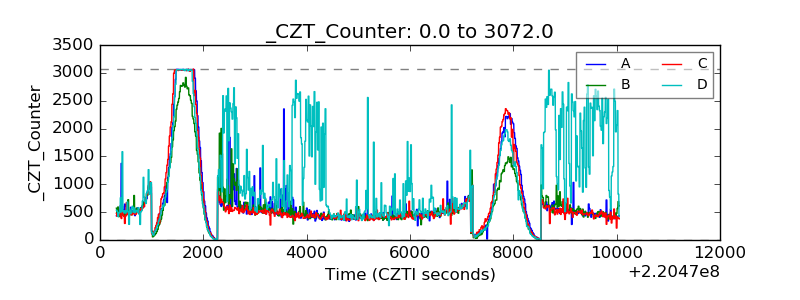 |
| +2.5 Volts monitor |  |
| +5 Volts monitor |  |
| _ROLL_ROT | 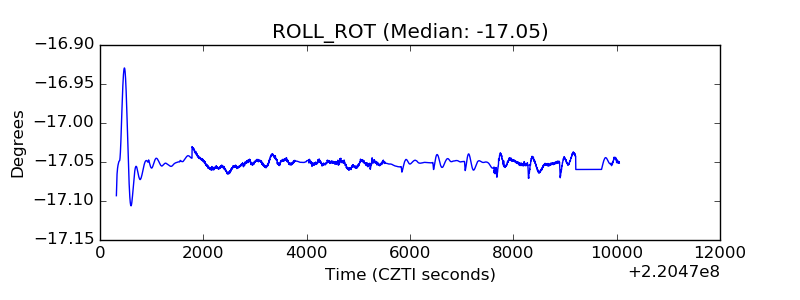 |
| _Roll_DEC | 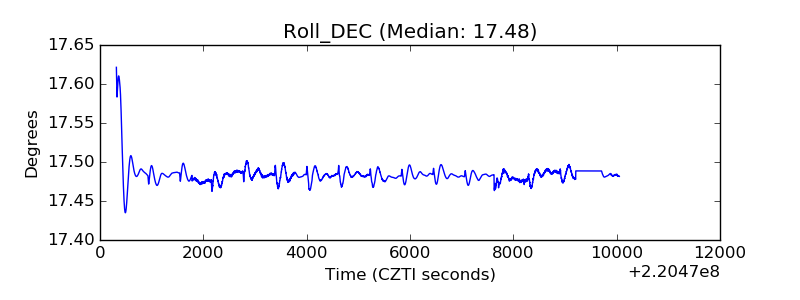 |
| _Roll_RA | 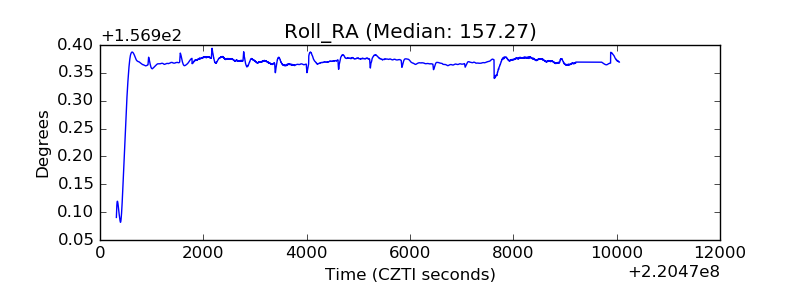 |
| Veto Counter | 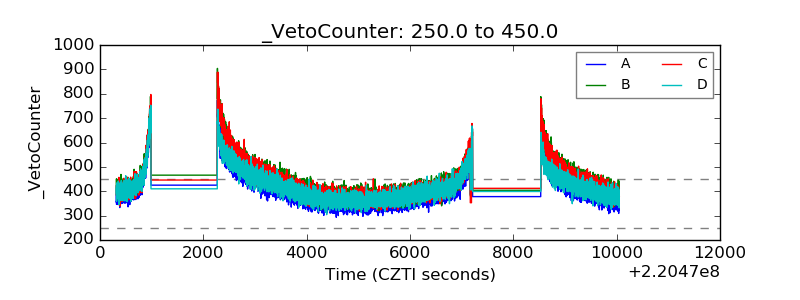 |