| Param | Original file | Final file |
|---|---|---|
| Filename | modeM0/AS1G06_168T10_9000000932_06746cztM0_level2.evt | modeM0/AS1G06_168T10_9000000932_06746cztM0_level2_quad_clean.evt |
| Size (bytes) | 552,032,640 | 90,434,880 |
| Size | 526.5 MB | 86.2 MB |
| Events in quadrant A | 3,087,546 | 591,945 |
| Events in quadrant B | 3,303,340 | 604,486 |
| Events in quadrant C | 2,924,987 | 594,430 |
| Events in quadrant D | 6,970,770 | 503,699 |
| Mode M9 | |||
|---|---|---|---|
| Quadrant | BADHDUFLAG | Total packets | Discarded packets |
| A | 0 | 25 | 0 |
| B | 0 | 25 | 0 |
| C | 0 | 25 | 0 |
| D | 0 | 25 | 0 |
| Mode SS | |||
|---|---|---|---|
| Quadrant | BADHDUFLAG | Total packets | Discarded packets |
| A | 0 | 132 | 0 |
| B | 0 | 132 | 0 |
| C | 0 | 132 | 0 |
| D | 0 | 132 | 0 |
| Mode M0 | |||
|---|---|---|---|
| Quadrant | BADHDUFLAG | Total packets | Discarded packets |
| A | 0 | 13507 | 4 |
| B | 0 | 14153 | 3 |
| C | 0 | 13120 | 3 |
| D | 0 | 24929 | 3 |
| Quadrant | Total seconds | Saturated seconds | Saturation percentage |
|---|---|---|---|
| A | 6355 | 61 | 0.959874% |
| B | 6355 | 117 | 1.841070% |
| C | 6355 | 28 | 0.440598% |
| D | 6356 | 1495 | 23.521082% |
Noise dominated data is calculated using 1-second bins in cleaned event files. If a bin has >2000 counts, and if more than 50% of those come from <1% of pixels, then it is considered to be noise-dominated and hence unusable.
| Quadrant | # 1 sec bins | Bins with >0 counts | Bins with >2000 counts | High rate bins dominated by noise | Noise dominated (total time) | Noise dominated (detector-on time) | Marked lightcurve |
|---|---|---|---|---|---|---|---|
| A | 8835 | 6357 | 3 | 3 | 0.03% | 0.05% | 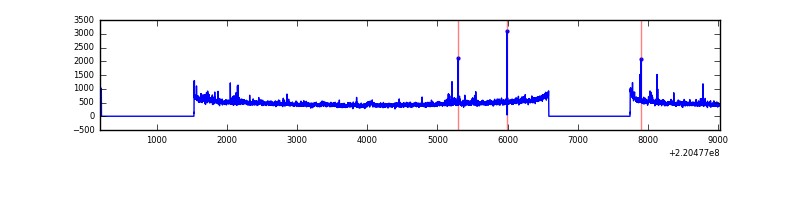 |
| B | 8835 | 6357 | 15 | 15 | 0.17% | 0.24% |  |
| C | 8835 | 6357 | 0 | 0 | 0.00% | 0.00% | 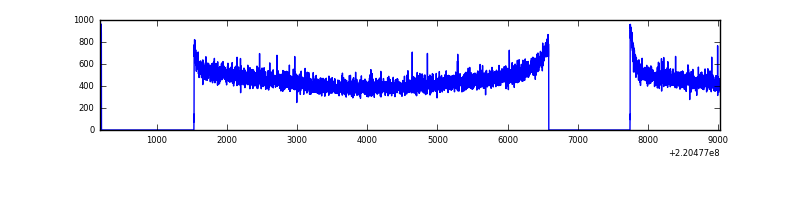 |
| D | 8836 | 6358 | 1282 | 1282 | 14.51% | 20.16% |  |
Top three noisy pixels from each quadrant. If the there are fewer than three noisy pixels in the level2.evt file, extra rows are filled as -1
| Pixel properties | Quadrant properties | ||||||
|---|---|---|---|---|---|---|---|
| Quadrant | DetID | PixID | Counts | Sigma | Mean | Median | Sigma |
| A | 8 | 15 | 67705 | 425.97 | 764 | 747 | 157.2 |
| A | 13 | 251 | 40432 | 252.47 | 764 | 747 | 157.2 |
| A | 13 | 248 | 27081 | 167.53 | 764 | 747 | 157.2 |
| B | 4 | 48 | 102279 | 678.23 | 774 | 755 | 149.7 |
| B | 0 | 214 | 66954 | 442.24 | 774 | 755 | 149.7 |
| B | 4 | 81 | 44359 | 291.3 | 774 | 755 | 149.7 |
| C | 9 | 247 | 6381 | 32.35 | 746 | 749 | 174.1 |
| C | 13 | 61 | 5872 | 29.43 | 746 | 749 | 174.1 |
| C | 12 | 4 | 4930 | 24.02 | 746 | 749 | 174.1 |
| D | 2 | 33 | 3425500 | 21279.21 | 652 | 632 | 160.9 |
| D | 8 | 195 | 309055 | 1916.28 | 652 | 632 | 160.9 |
| D | 14 | 34 | 277880 | 1722.58 | 652 | 632 | 160.9 |
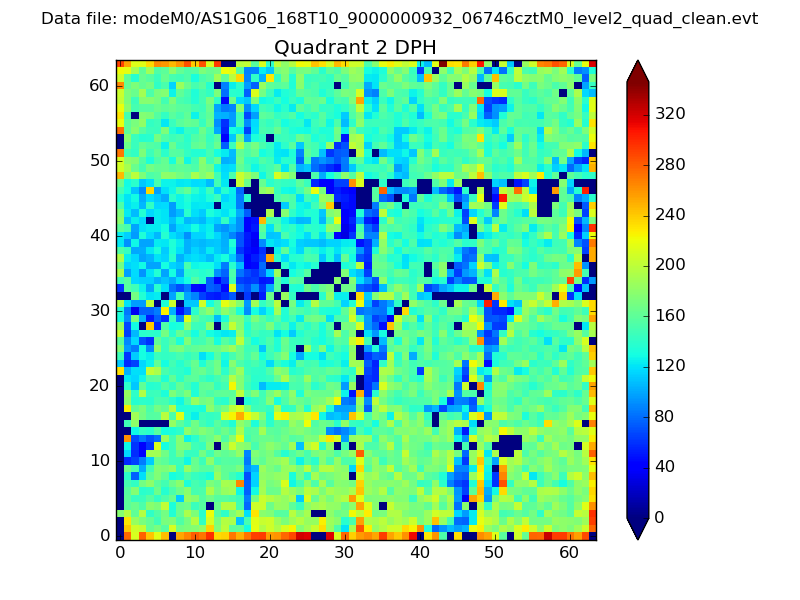
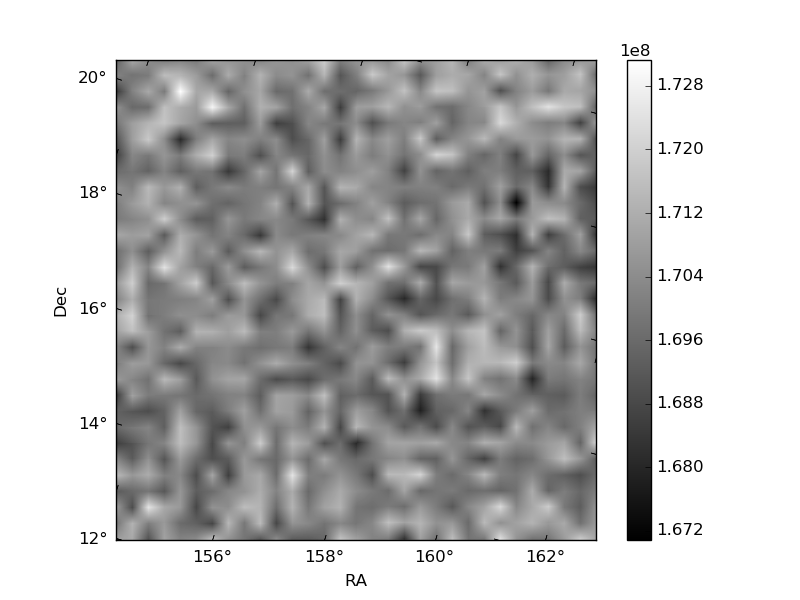
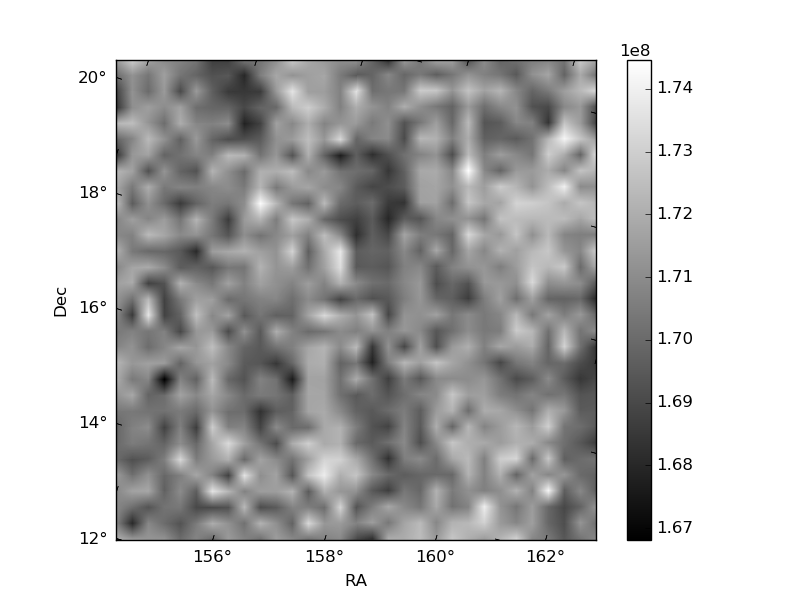
Histogram calculated using DETX and DETY for each event in the final _common_clean file
| Quadrant A | 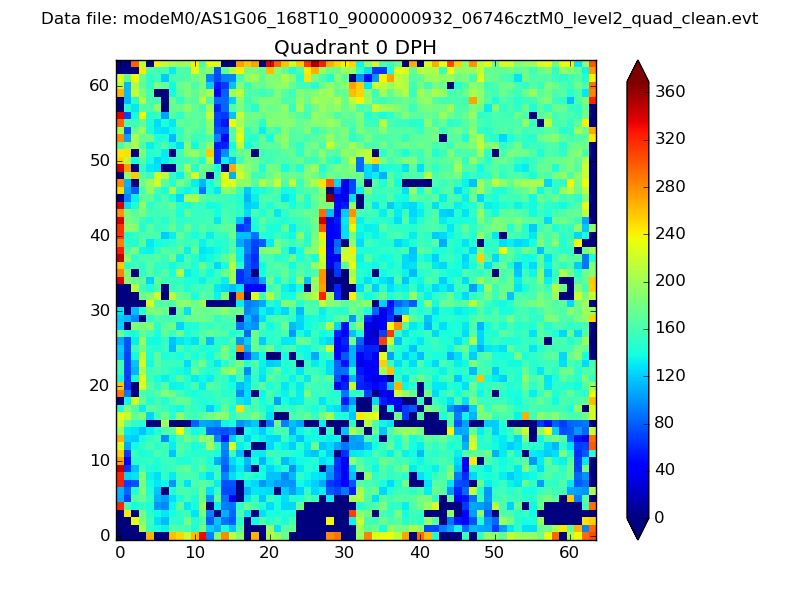 |
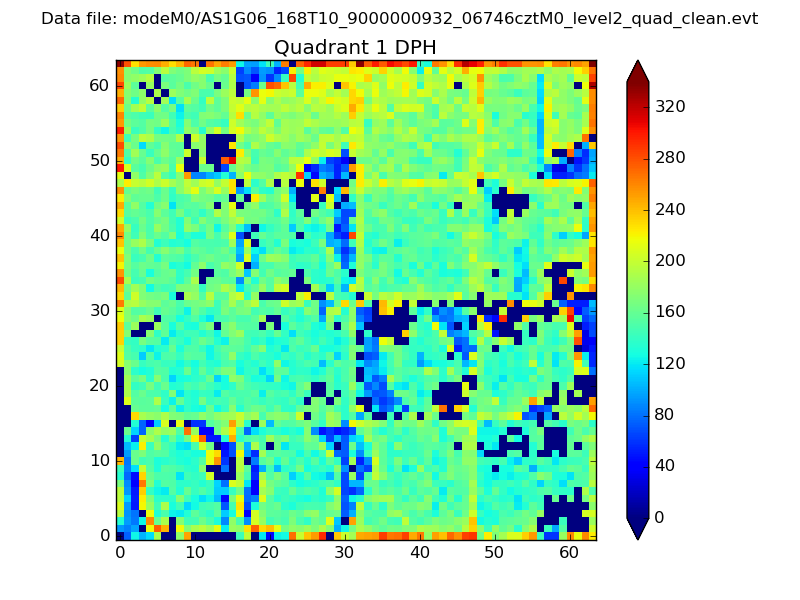 |
Quadrant B |
|---|---|---|---|
| Quadrant D | 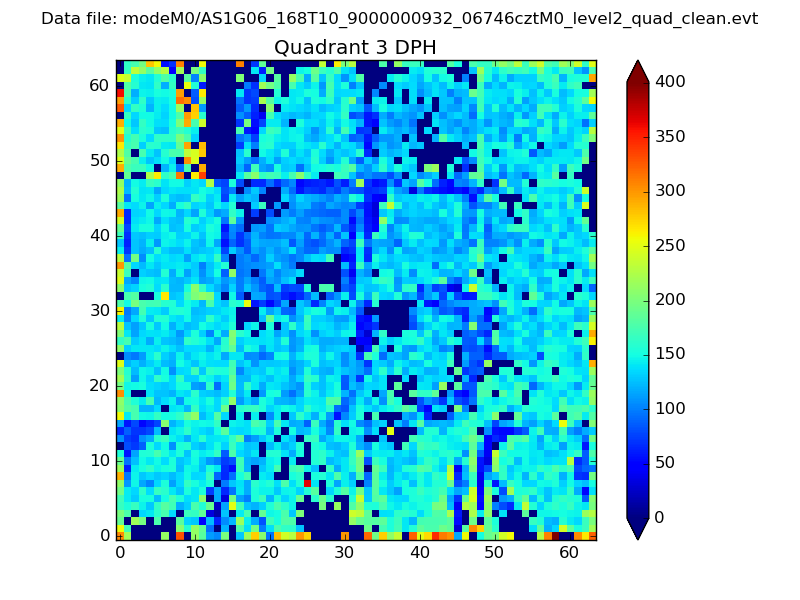 |
 |
Quadrant C |
| Plot type | Count rate plots | Images |
|---|---|---|
| Comparison with Poisson distribution Blue bars denote a histogram of data divided into 1 sec bins. Red curve is a Poisson curve with rate = median count rate of data. |
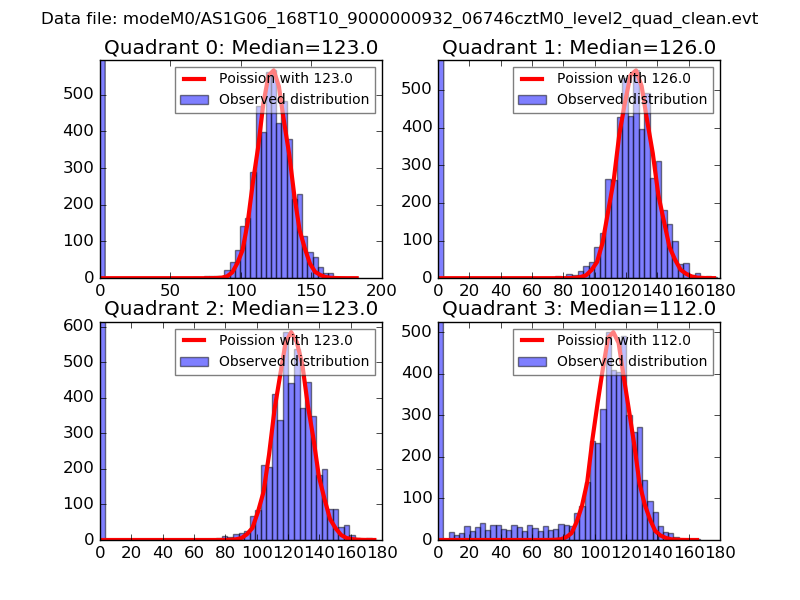 |
 |
| Quadrant-wise count rates Data is divided into 100 sec bins |
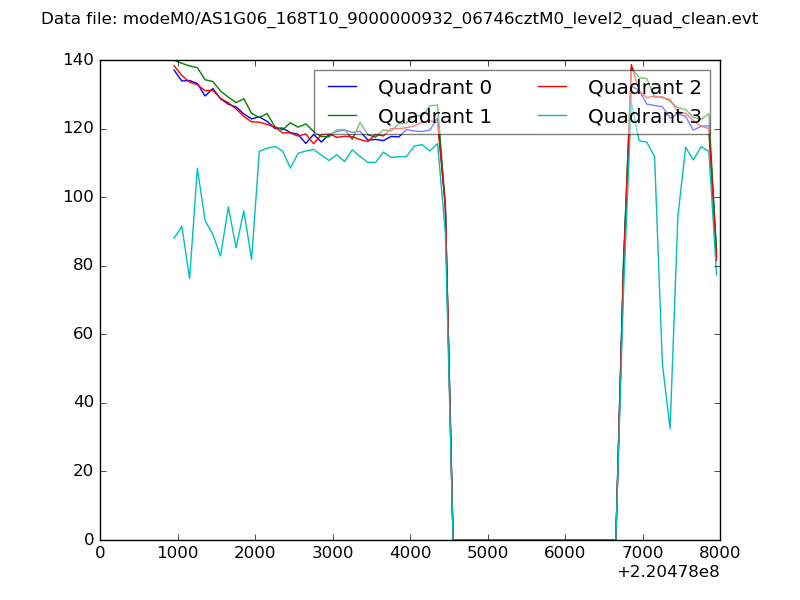 |
|
| Module-wise count rates for Quadrant A Data is divided into 100 sec bins |
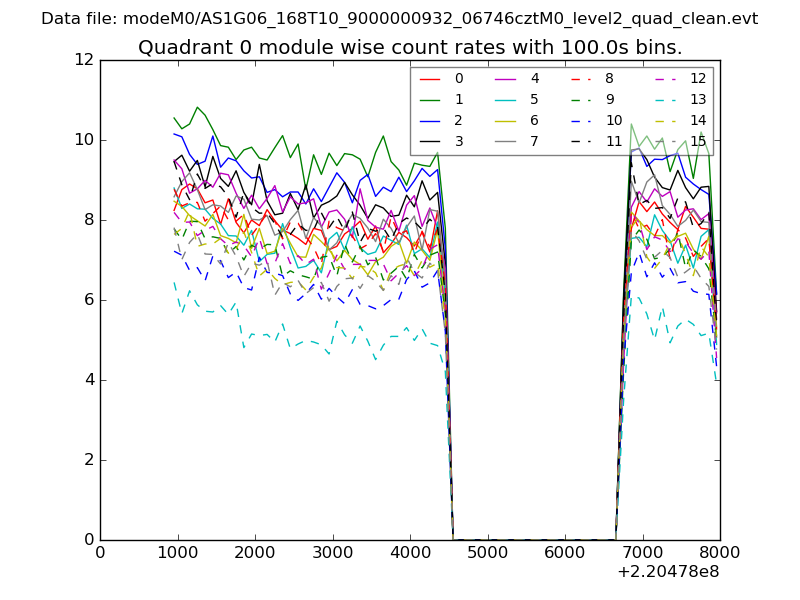 |
 |
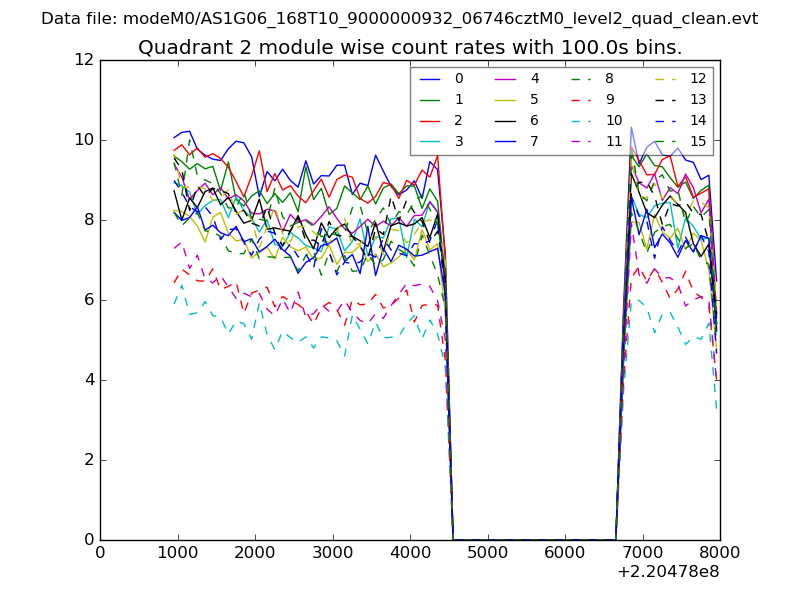
| Module-wise count rates for Quadrant B Data is divided into 100 sec bins |
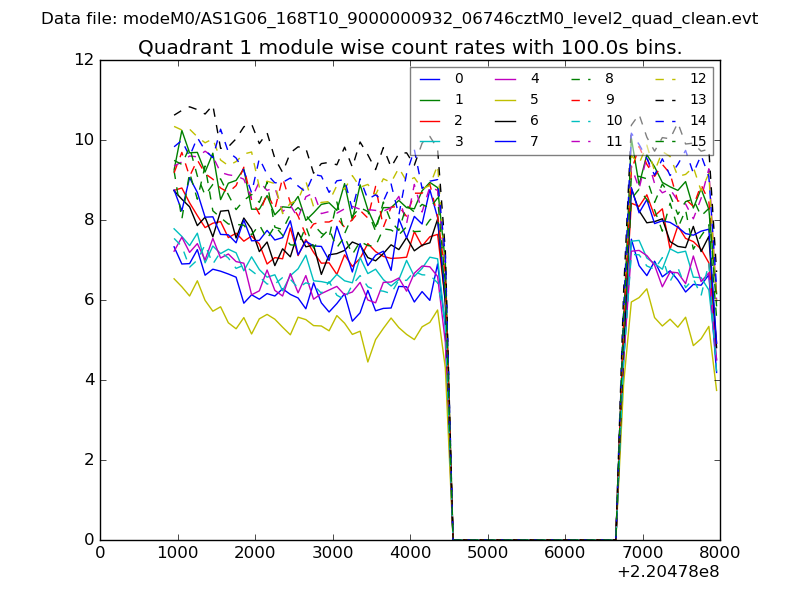 |
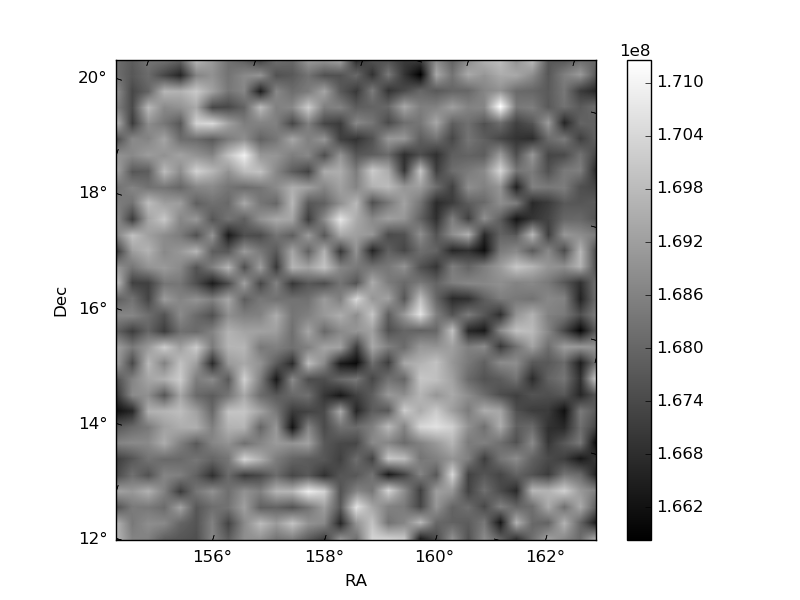 |
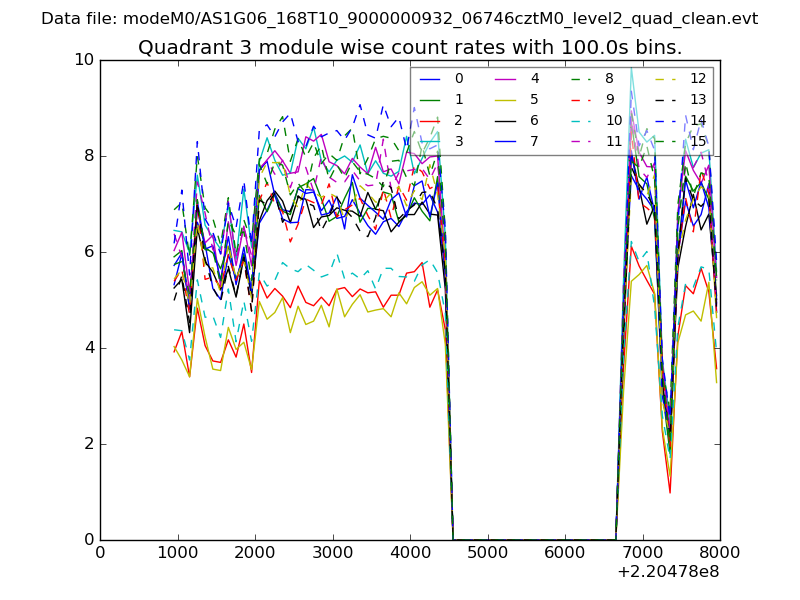
| Module-wise count rates for Quadrant C Data is divided into 100 sec bins |
 |
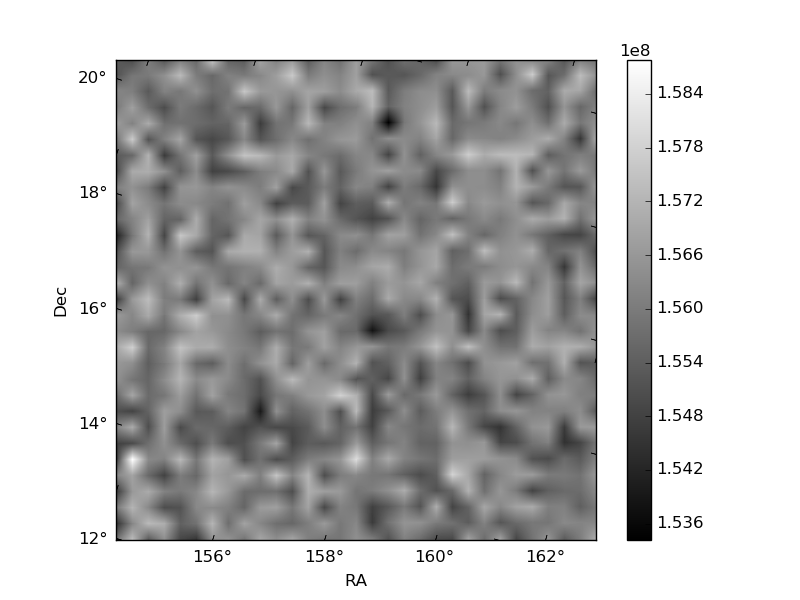 |
| Module-wise count rates for Quadrant D Data is divided into 100 sec bins |
 |
 |
| Parameter | Plot |
|---|---|
| CZT HV Monitor | 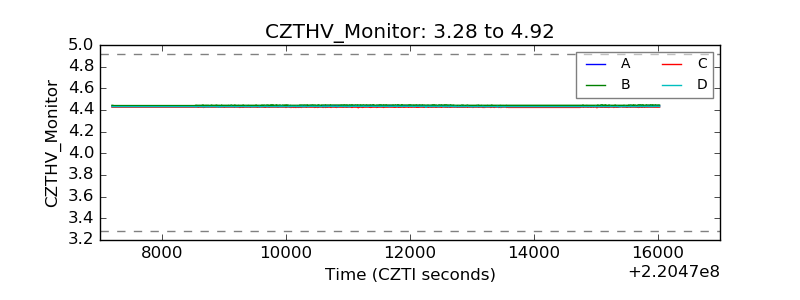 |
| D_VDD | 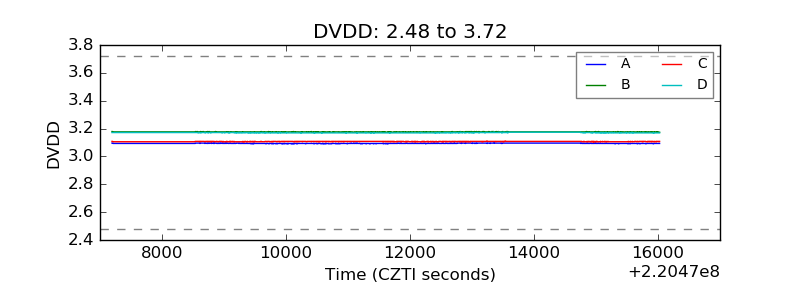 |
| Temperature 1 | 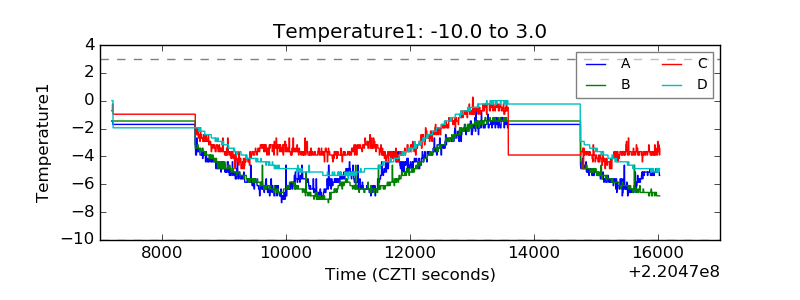 |
| Veto HV Monitor | 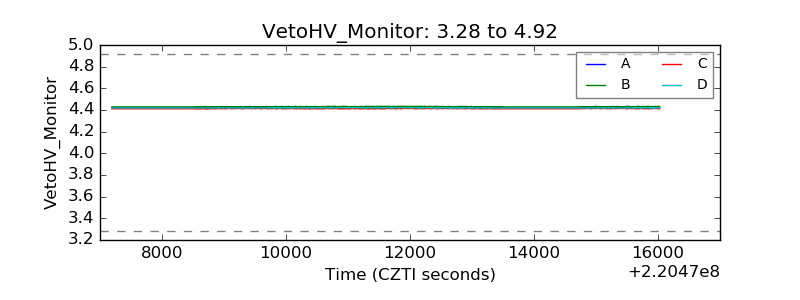 |
| Veto LLD | 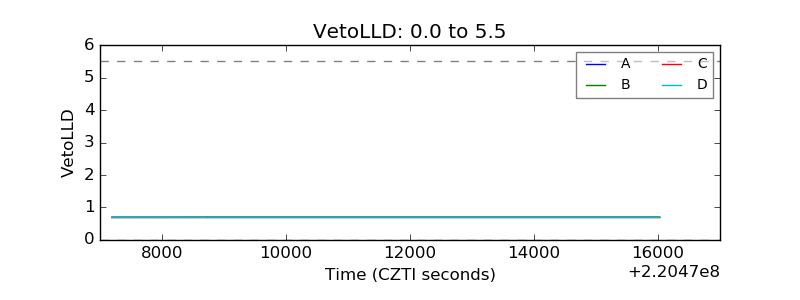 |
| Alpha Counter | 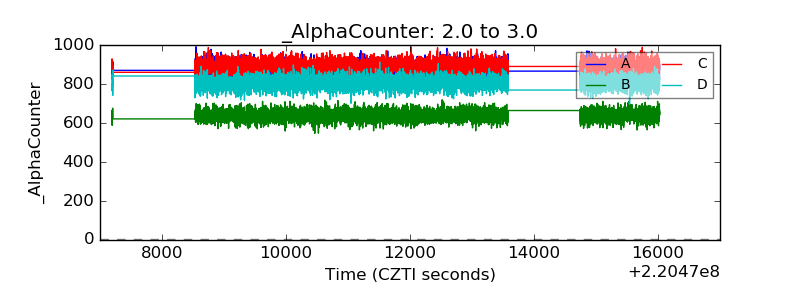 |
| _CPM_Rate | 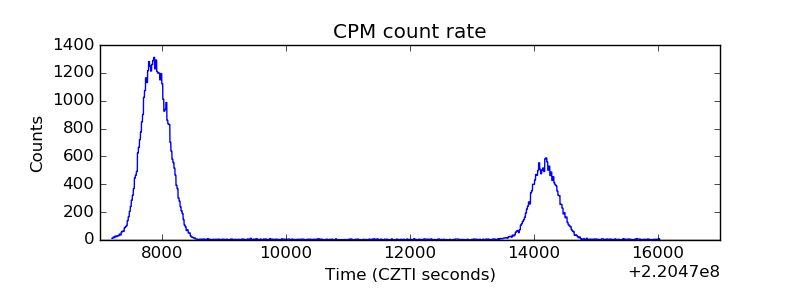 |
| CZT Counter | 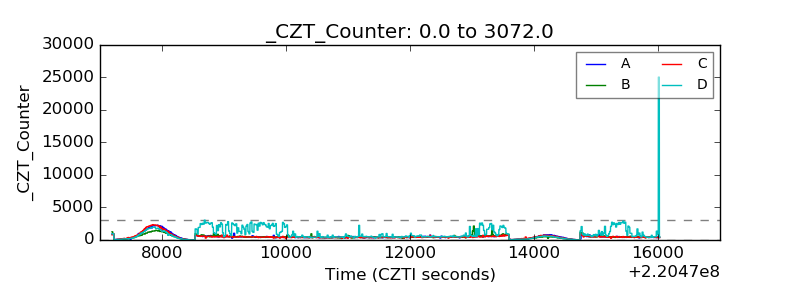 |
| +2.5 Volts monitor |  |
| +5 Volts monitor |  |
| _ROLL_ROT | 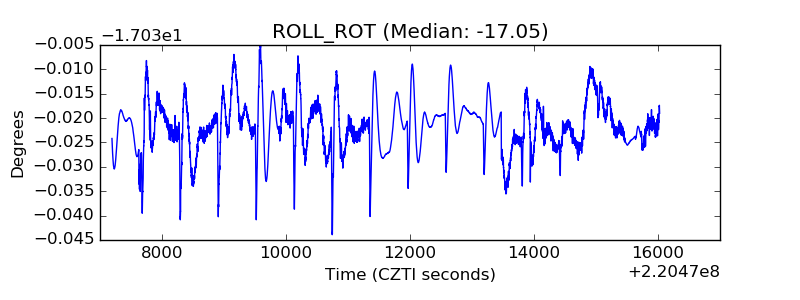 |
| _Roll_DEC | 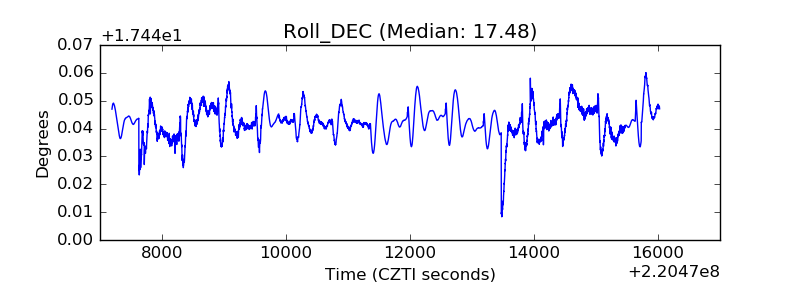 |
| _Roll_RA | 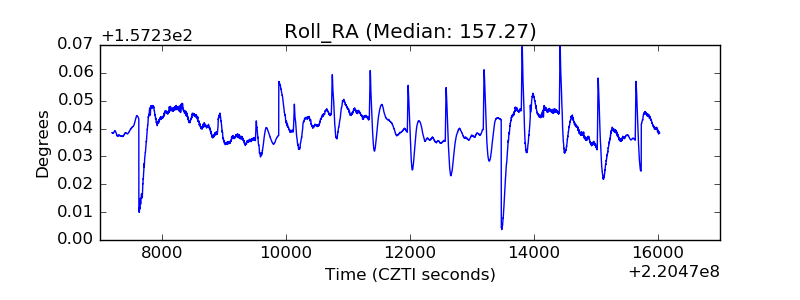 |
| Veto Counter | 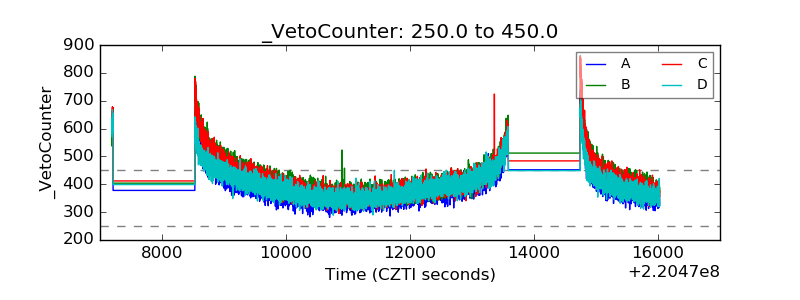 |