| Param | Original file | Final file |
|---|---|---|
| Filename | modeM0/AS1G06_168T10_9000000932_06748cztM0_level2.evt | modeM0/AS1G06_168T10_9000000932_06748cztM0_level2_quad_clean.evt |
| Size (bytes) | 617,728,320 | 100,310,400 |
| Size | 589.1 MB | 95.7 MB |
| Events in quadrant A | 4,154,915 | 620,685 |
| Events in quadrant B | 3,938,074 | 638,897 |
| Events in quadrant C | 3,743,775 | 627,490 |
| Events in quadrant D | 6,317,258 | 583,236 |
| Mode M9 | |||
|---|---|---|---|
| Quadrant | BADHDUFLAG | Total packets | Discarded packets |
| A | 0 | 12 | 0 |
| B | 0 | 12 | 0 |
| C | 0 | 12 | 0 |
| D | 0 | 12 | 0 |
| Mode SS | |||
|---|---|---|---|
| Quadrant | BADHDUFLAG | Total packets | Discarded packets |
| A | 0 | 170 | 0 |
| B | 0 | 170 | 0 |
| C | 0 | 170 | 0 |
| D | 0 | 170 | 0 |
| Mode M0 | |||
|---|---|---|---|
| Quadrant | BADHDUFLAG | Total packets | Discarded packets |
| A | 0 | 18230 | 3 |
| B | 0 | 17376 | 2 |
| C | 0 | 17002 | 2 |
| D | 0 | 24229 | 2 |
| Quadrant | Total seconds | Saturated seconds | Saturation percentage |
|---|---|---|---|
| A | 8155 | 210 | 2.575107% |
| B | 8155 | 142 | 1.741263% |
| C | 8155 | 51 | 0.625383% |
| D | 8155 | 901 | 11.048437% |
Noise dominated data is calculated using 1-second bins in cleaned event files. If a bin has >2000 counts, and if more than 50% of those come from <1% of pixels, then it is considered to be noise-dominated and hence unusable.
| Quadrant | # 1 sec bins | Bins with >0 counts | Bins with >2000 counts | High rate bins dominated by noise | Noise dominated (total time) | Noise dominated (detector-on time) | Marked lightcurve |
|---|---|---|---|---|---|---|---|
| A | 9455 | 8157 | 39 | 39 | 0.41% | 0.48% | 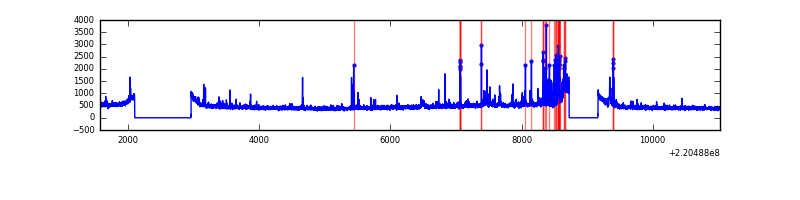 |
| B | 9455 | 8157 | 2 | 2 | 0.02% | 0.02% | 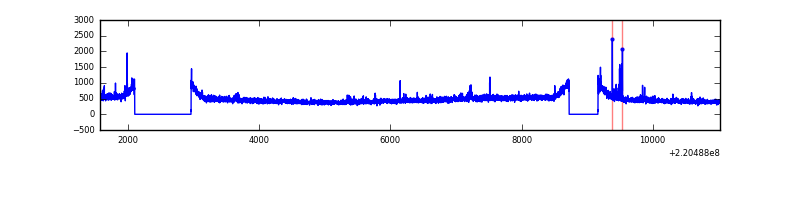 |
| C | 9455 | 8157 | 0 | 0 | 0.00% | 0.00% | 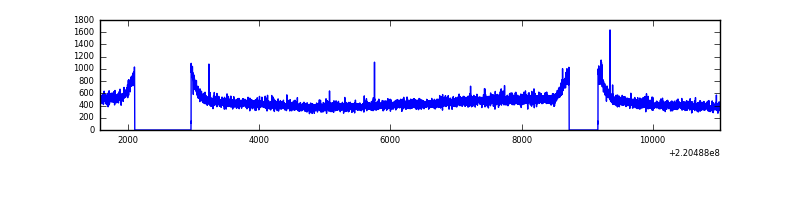 |
| D | 9455 | 8157 | 638 | 638 | 6.75% | 7.82% | 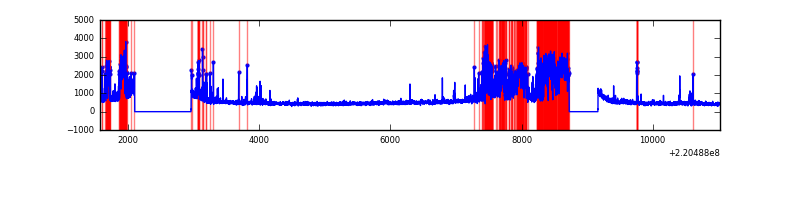 |
Top three noisy pixels from each quadrant. If the there are fewer than three noisy pixels in the level2.evt file, extra rows are filled as -1
| Pixel properties | Quadrant properties | ||||||
|---|---|---|---|---|---|---|---|
| Quadrant | DetID | PixID | Counts | Sigma | Mean | Median | Sigma |
| A | 4 | 2 | 207070 | 1030.78 | 967 | 947 | 200.0 |
| A | 14 | 111 | 86862 | 429.64 | 967 | 947 | 200.0 |
| A | 13 | 248 | 67142 | 331.03 | 967 | 947 | 200.0 |
| B | 4 | 81 | 57254 | 294.72 | 985 | 959 | 191.0 |
| B | 5 | 143 | 20384 | 101.69 | 985 | 959 | 191.0 |
| B | 12 | 111 | 19367 | 96.37 | 985 | 959 | 191.0 |
| C | 9 | 247 | 25604 | 111.34 | 946 | 953 | 221.4 |
| C | 13 | 61 | 7539 | 29.75 | 946 | 953 | 221.4 |
| C | 8 | 128 | 6344 | 24.35 | 946 | 953 | 221.4 |
| D | 2 | 33 | 1243218 | 5664.63 | 890 | 863 | 219.3 |
| D | 14 | 34 | 831197 | 3785.98 | 890 | 863 | 219.3 |
| D | 8 | 195 | 512792 | 2334.19 | 890 | 863 | 219.3 |
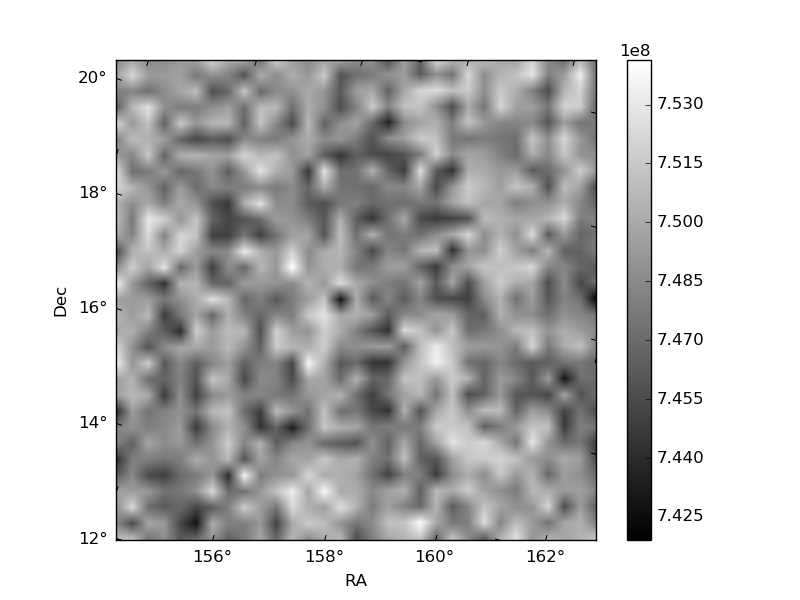
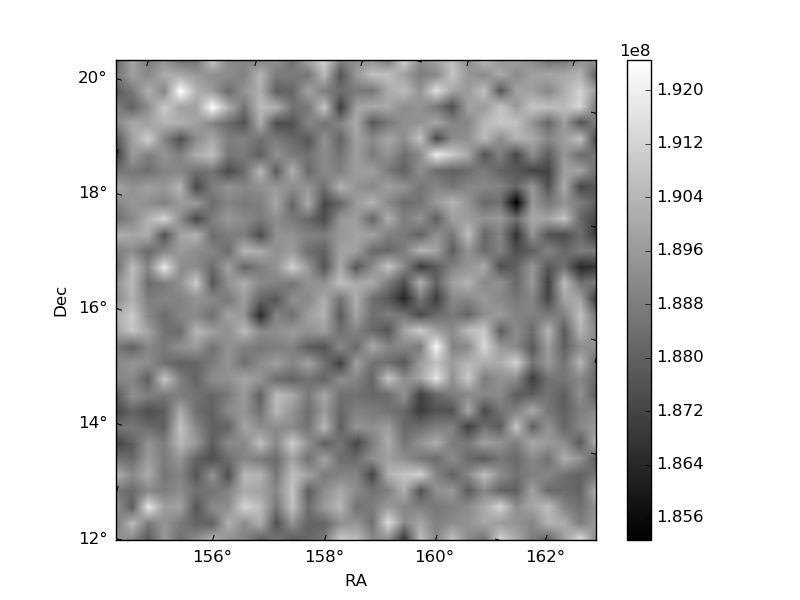
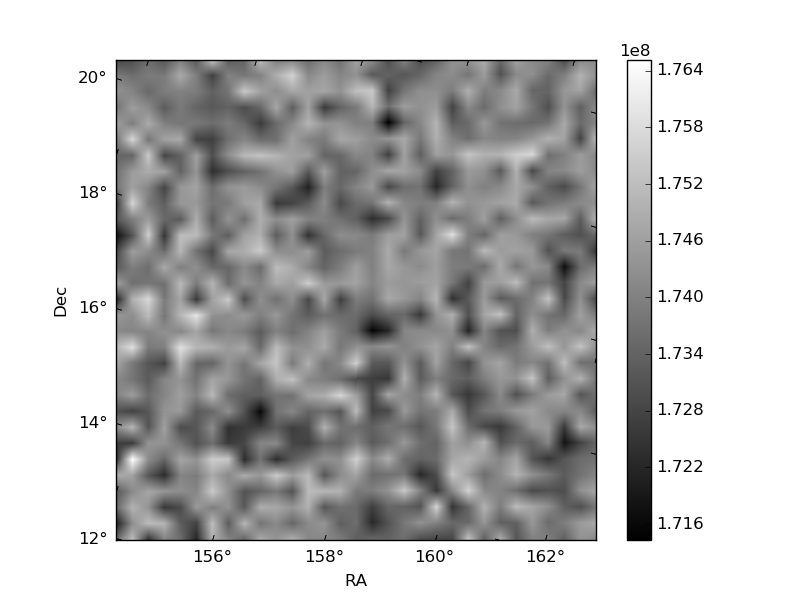
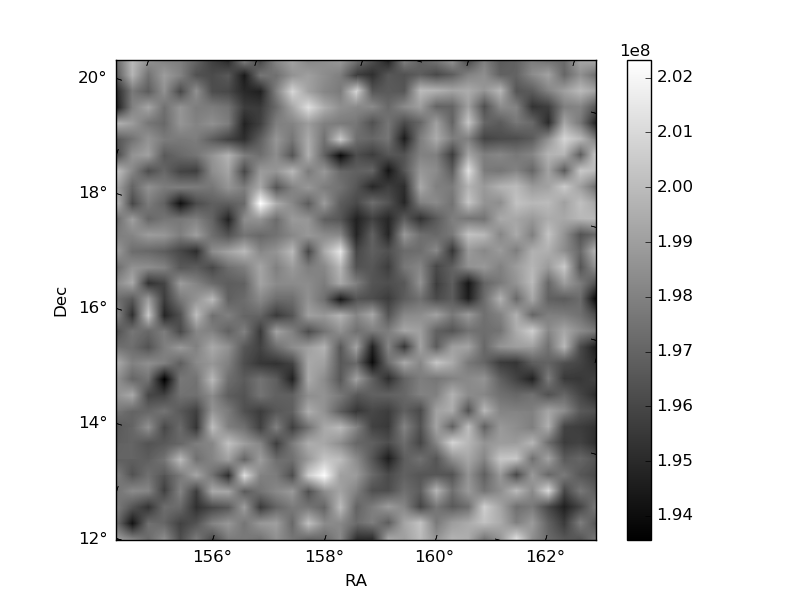
Histogram calculated using DETX and DETY for each event in the final _common_clean file
| Quadrant A | 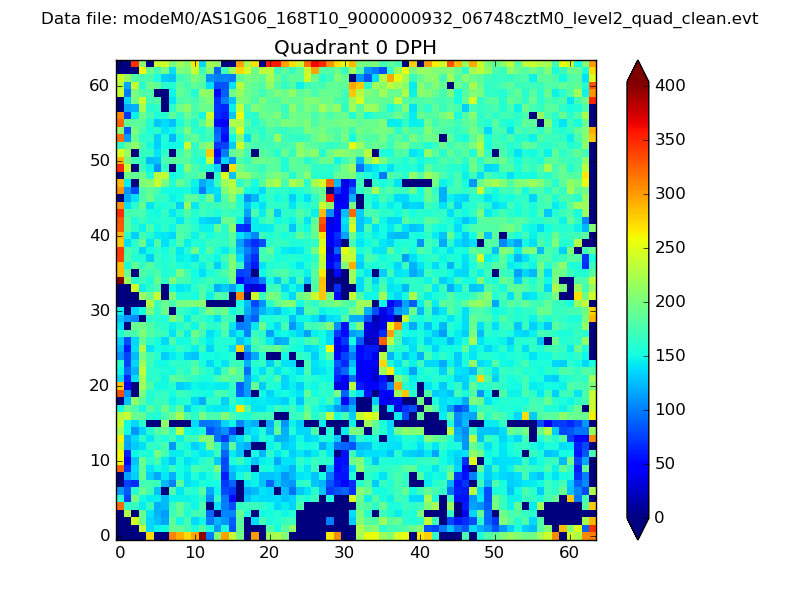 |
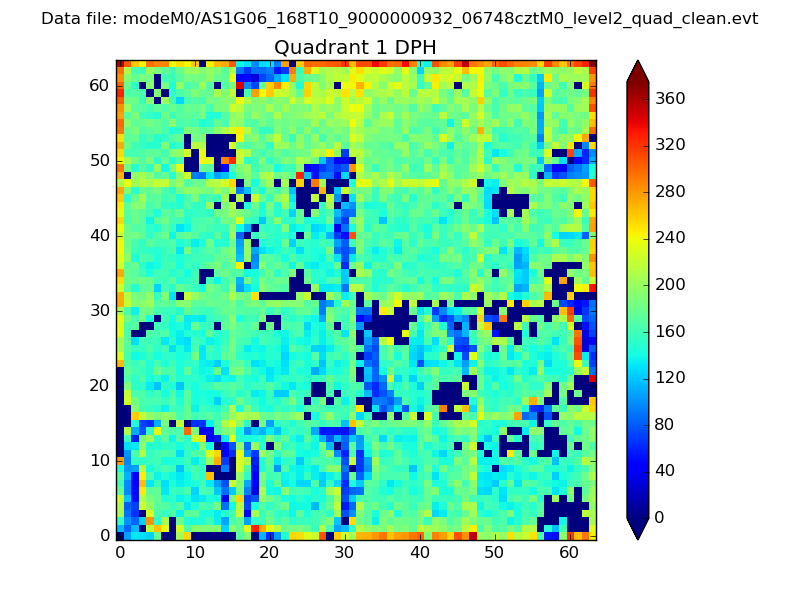 |
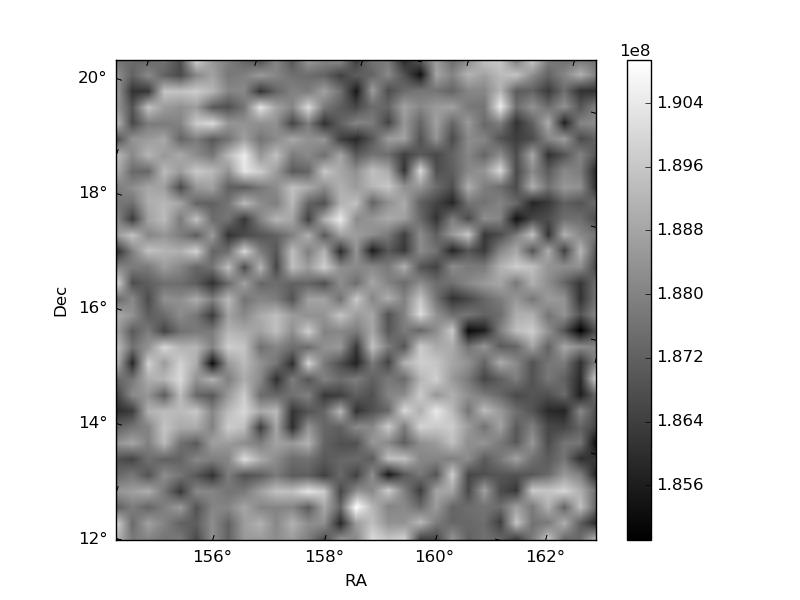
Quadrant B |
|---|---|---|---|
| Quadrant D | 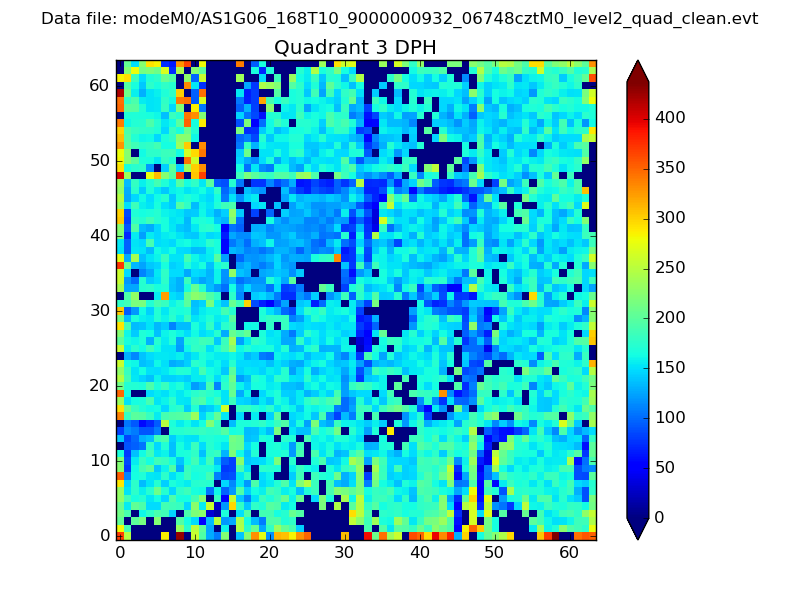 |
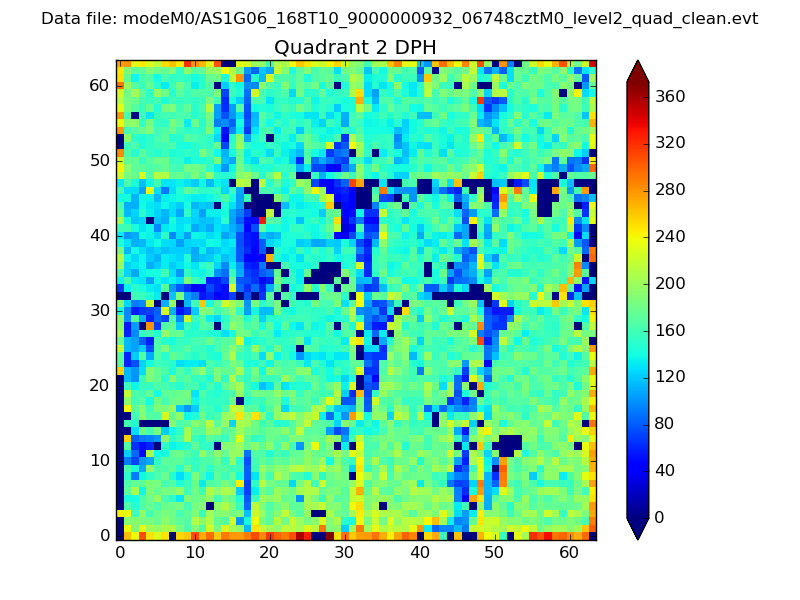 |
Quadrant C |
| Plot type | Count rate plots | Images |
|---|---|---|
| Comparison with Poisson distribution Blue bars denote a histogram of data divided into 1 sec bins. Red curve is a Poisson curve with rate = median count rate of data. |
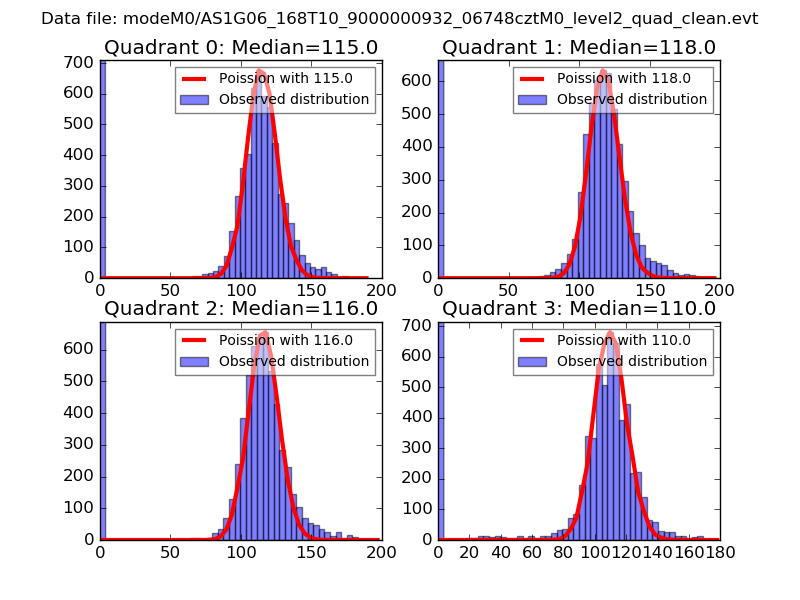 |
 |
| Quadrant-wise count rates Data is divided into 100 sec bins |
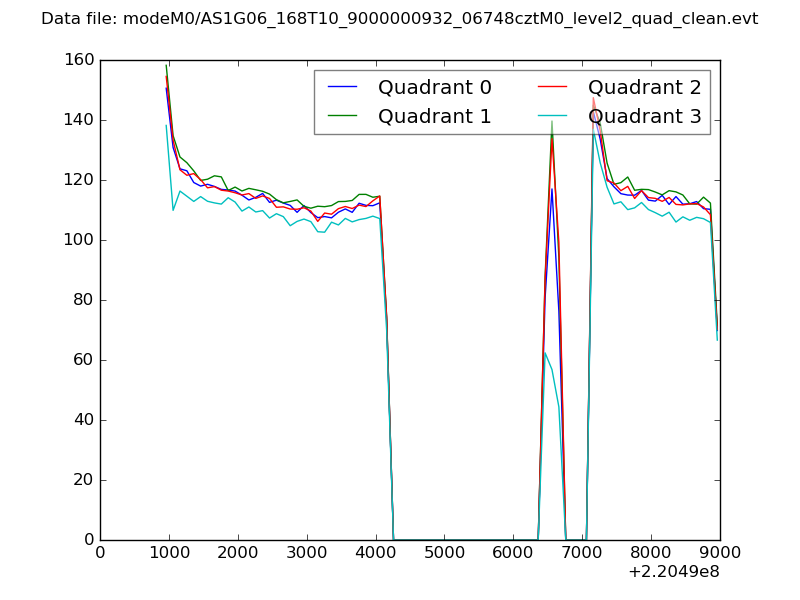 |
|
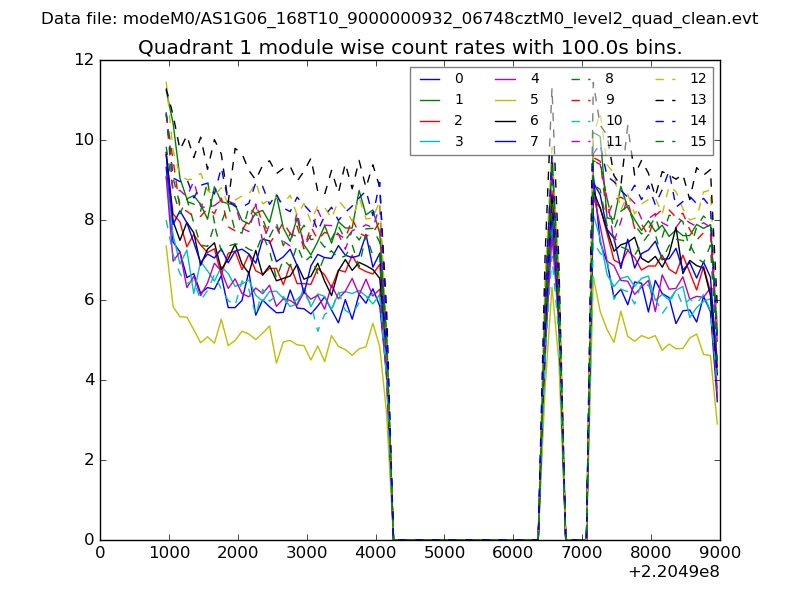
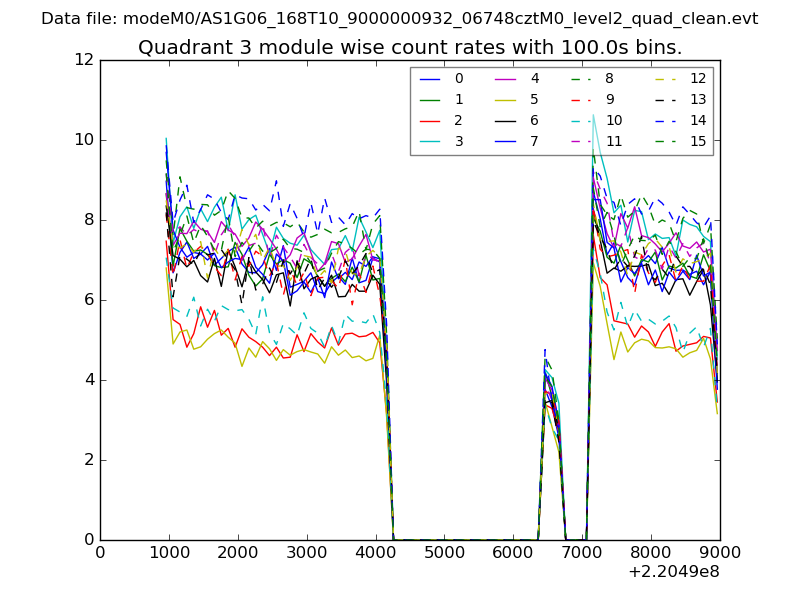
| Module-wise count rates for Quadrant A Data is divided into 100 sec bins |
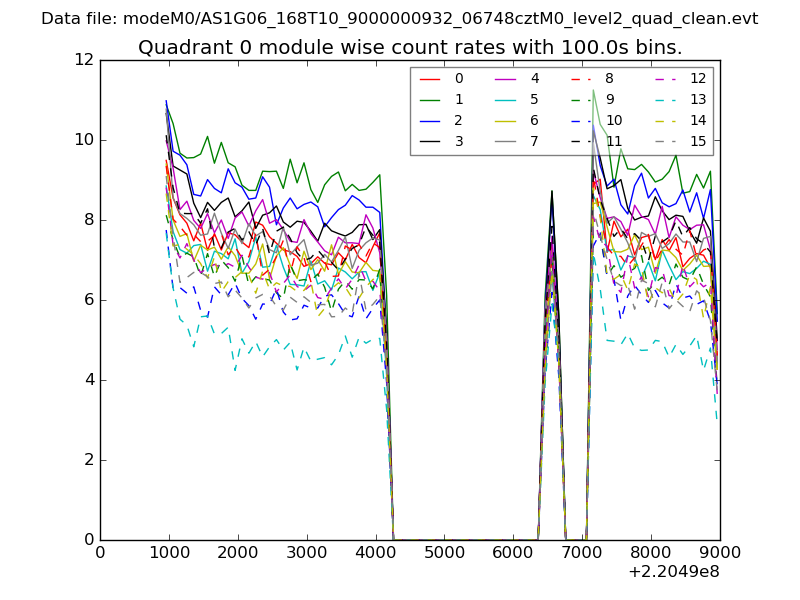 |
 |
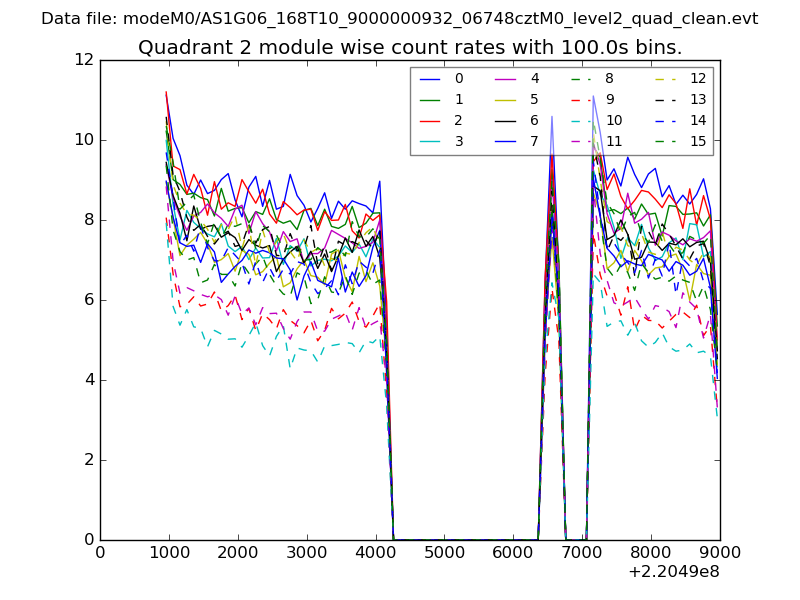
| Module-wise count rates for Quadrant B Data is divided into 100 sec bins |
 |
 |
| Module-wise count rates for Quadrant C Data is divided into 100 sec bins |
 |
 |
| Module-wise count rates for Quadrant D Data is divided into 100 sec bins |
 |
 |
| Parameter | Plot |
|---|---|
| CZT HV Monitor | 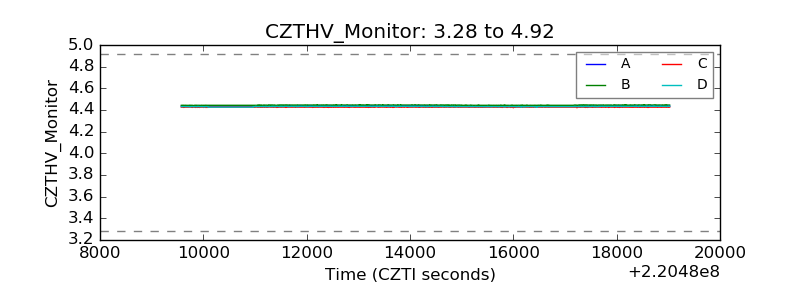 |
| D_VDD | 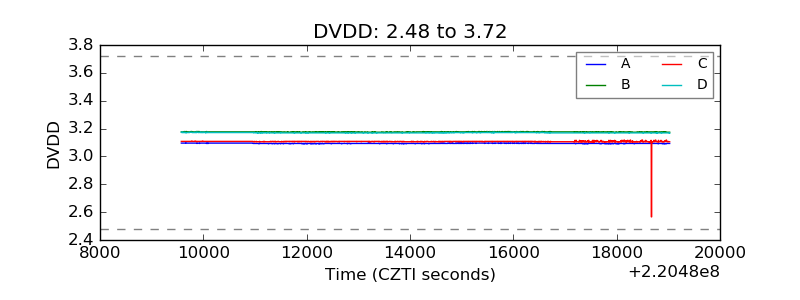 |
| Temperature 1 | 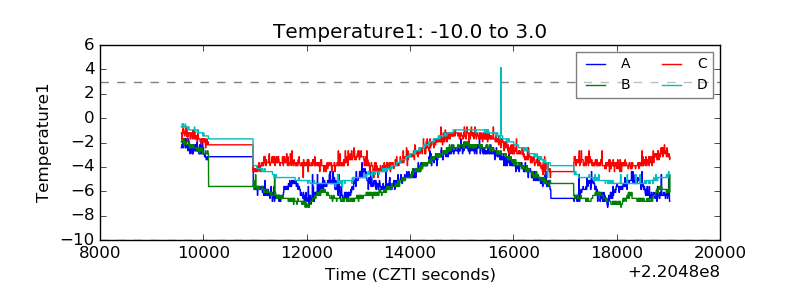 |
| Veto HV Monitor | 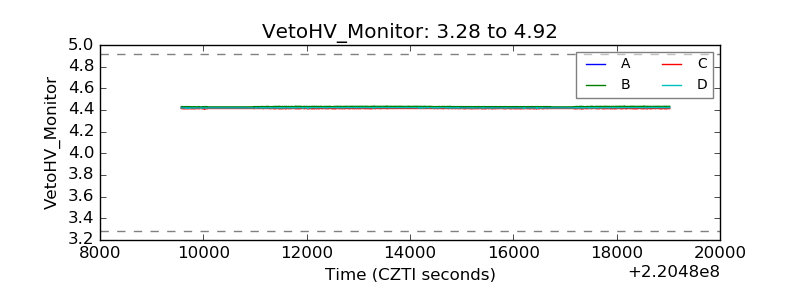 |
| Veto LLD | 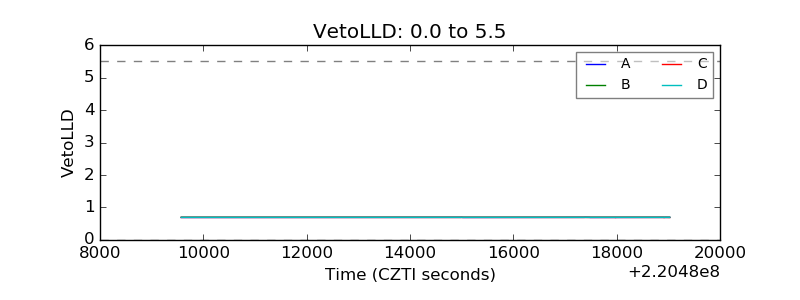 |
| Alpha Counter | 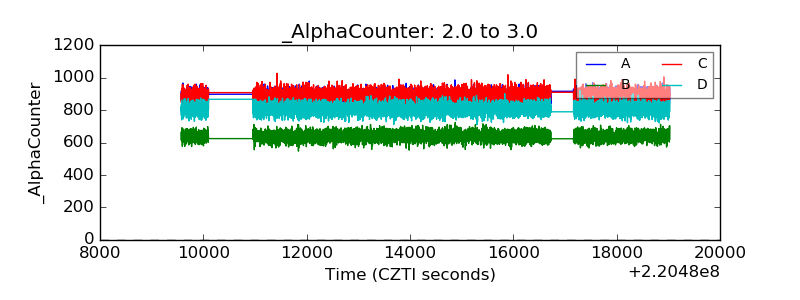 |
| _CPM_Rate | 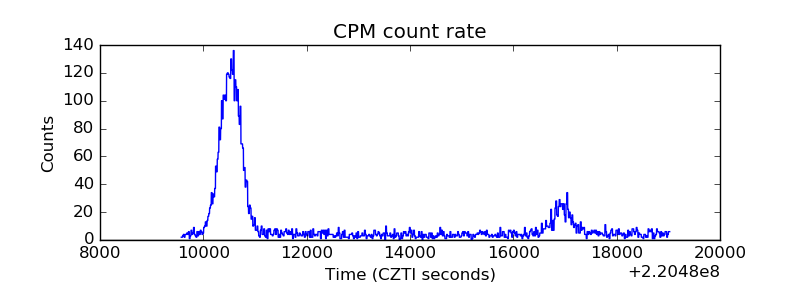 |
| CZT Counter | 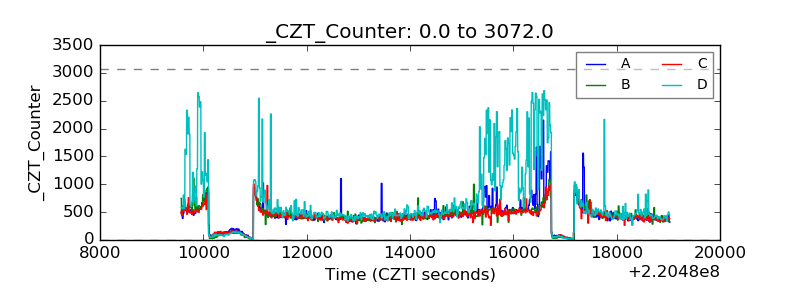 |
| +2.5 Volts monitor | 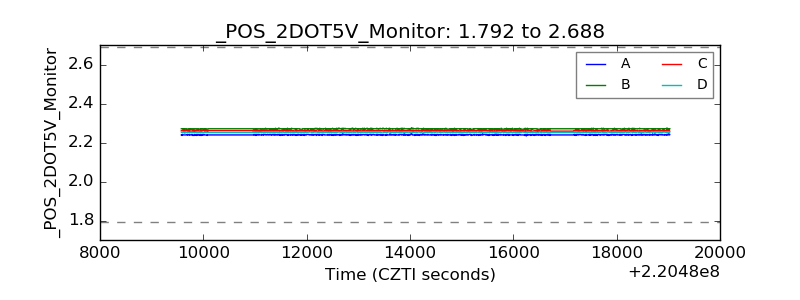 |
| +5 Volts monitor | 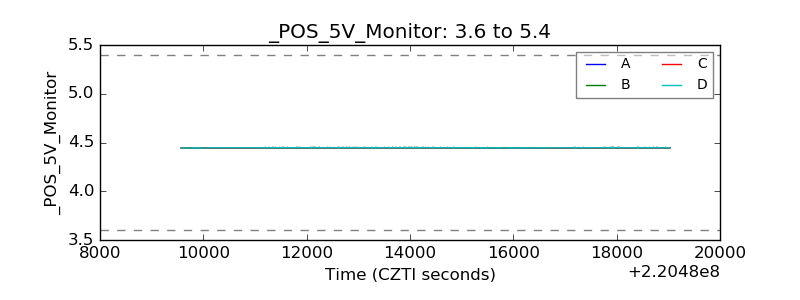 |
| _ROLL_ROT | 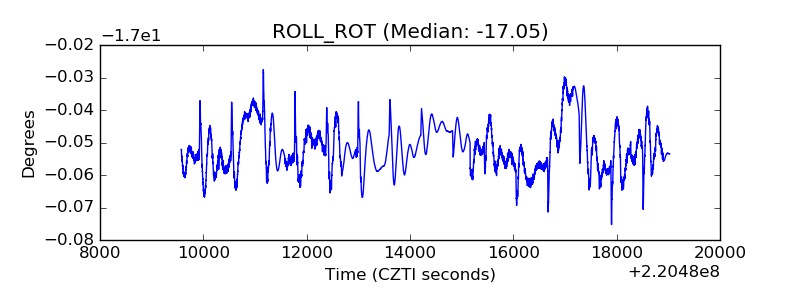 |
| _Roll_DEC | 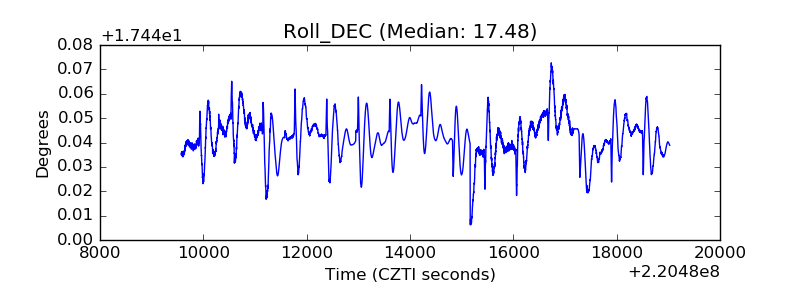 |
| _Roll_RA | 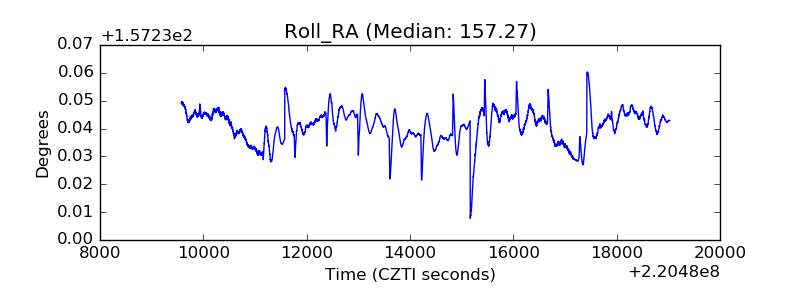 |
| Veto Counter | 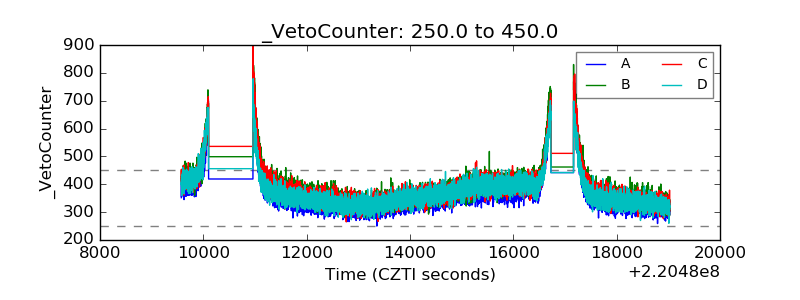 |