| Param | Original file | Final file |
|---|---|---|
| Filename | modeM0/AS1G06_168T10_9000000932_06749cztM0_level2.evt | modeM0/AS1G06_168T10_9000000932_06749cztM0_level2_quad_clean.evt |
| Size (bytes) | 642,055,680 | 112,642,560 |
| Size | 612.3 MB | 107.4 MB |
| Events in quadrant A | 4,537,405 | 705,349 |
| Events in quadrant B | 4,306,510 | 723,707 |
| Events in quadrant C | 4,100,187 | 712,643 |
| Events in quadrant D | 5,905,304 | 660,136 |
| Mode M9 | |||
|---|---|---|---|
| Quadrant | BADHDUFLAG | Total packets | Discarded packets |
| A | 0 | 4 | 0 |
| B | 0 | 4 | 0 |
| C | 0 | 4 | 0 |
| D | 0 | 4 | 0 |
| Mode SS | |||
|---|---|---|---|
| Quadrant | BADHDUFLAG | Total packets | Discarded packets |
| A | 0 | 178 | 0 |
| B | 0 | 178 | 0 |
| C | 0 | 178 | 0 |
| D | 0 | 178 | 0 |
| Mode M0 | |||
|---|---|---|---|
| Quadrant | BADHDUFLAG | Total packets | Discarded packets |
| A | 0 | 19730 | 2 |
| B | 0 | 18800 | 1 |
| C | 0 | 18495 | 1 |
| D | 0 | 23407 | 1 |
| Quadrant | Total seconds | Saturated seconds | Saturation percentage |
|---|---|---|---|
| A | 8773 | 327 | 3.727345% |
| B | 8773 | 268 | 3.054827% |
| C | 8773 | 105 | 1.196854% |
| D | 8773 | 642 | 7.317907% |
Noise dominated data is calculated using 1-second bins in cleaned event files. If a bin has >2000 counts, and if more than 50% of those come from <1% of pixels, then it is considered to be noise-dominated and hence unusable.
| Quadrant | # 1 sec bins | Bins with >0 counts | Bins with >2000 counts | High rate bins dominated by noise | Noise dominated (total time) | Noise dominated (detector-on time) | Marked lightcurve |
|---|---|---|---|---|---|---|---|
| A | 9213 | 8774 | 39 | 39 | 0.42% | 0.44% | 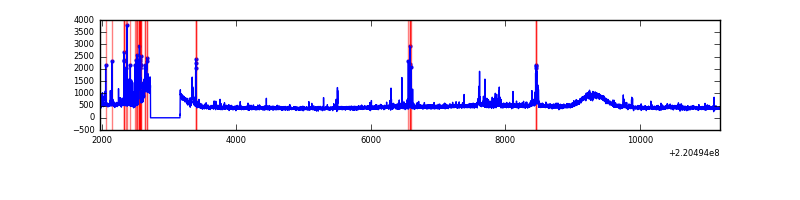 |
| B | 9213 | 8774 | 5 | 5 | 0.05% | 0.06% | 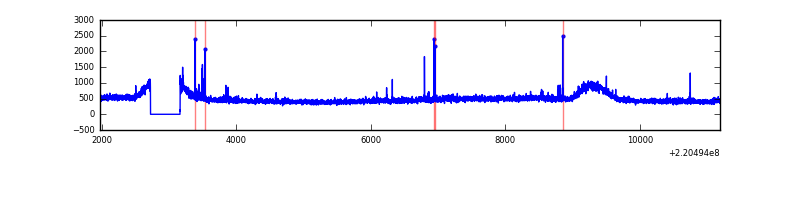 |
| C | 9213 | 8774 | 0 | 0 | 0.00% | 0.00% | 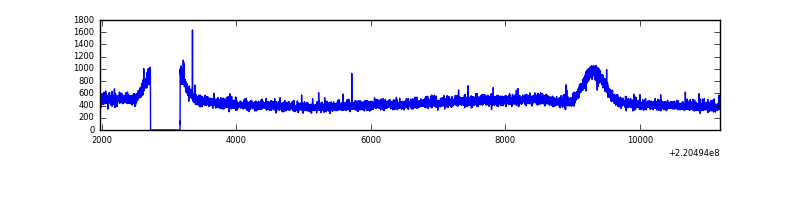 |
| D | 9213 | 8774 | 436 | 436 | 4.73% | 4.97% | 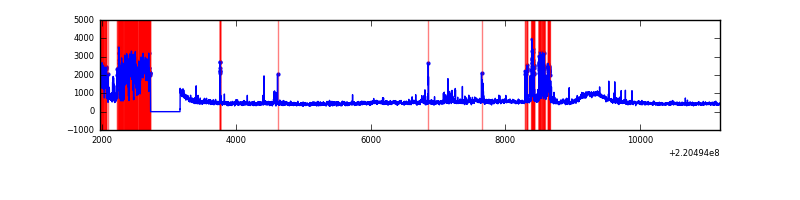 |
Top three noisy pixels from each quadrant. If the there are fewer than three noisy pixels in the level2.evt file, extra rows are filled as -1
| Pixel properties | Quadrant properties | ||||||
|---|---|---|---|---|---|---|---|
| Quadrant | DetID | PixID | Counts | Sigma | Mean | Median | Sigma |
| A | 4 | 2 | 270400 | 1225.44 | 1064 | 1041 | 219.8 |
| A | 13 | 248 | 68954 | 308.97 | 1064 | 1041 | 219.8 |
| A | 15 | 234 | 35457 | 156.58 | 1064 | 1041 | 219.8 |
| B | 4 | 81 | 59273 | 275.07 | 1081 | 1054 | 211.7 |
| B | 5 | 143 | 25690 | 116.4 | 1081 | 1054 | 211.7 |
| B | 12 | 111 | 22259 | 100.19 | 1081 | 1054 | 211.7 |
| C | 9 | 247 | 13498 | 50.83 | 1040 | 1045 | 245.0 |
| C | 9 | 16 | 8411 | 30.06 | 1040 | 1045 | 245.0 |
| C | 13 | 61 | 8118 | 28.87 | 1040 | 1045 | 245.0 |
| D | 14 | 34 | 753609 | 3020.71 | 1004 | 972 | 249.2 |
| D | 2 | 33 | 588263 | 2357.1 | 1004 | 972 | 249.2 |
| D | 8 | 195 | 580046 | 2324.12 | 1004 | 972 | 249.2 |
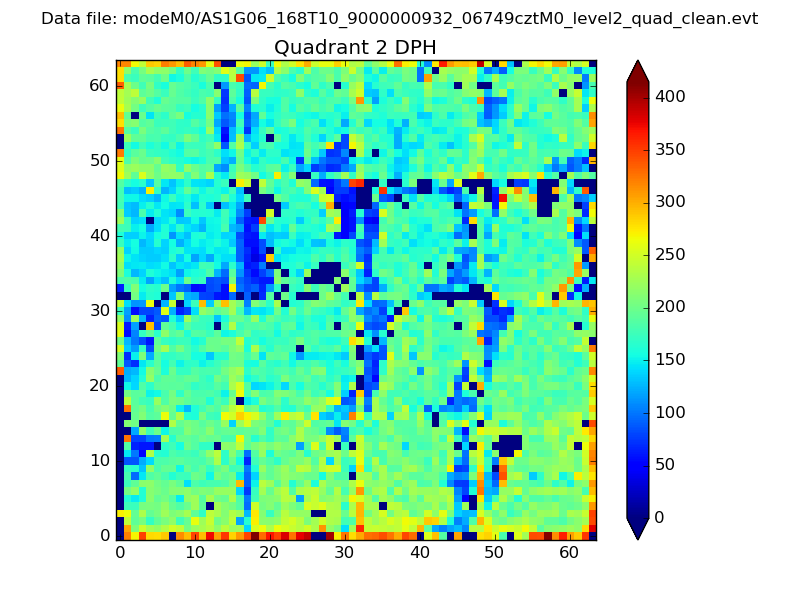
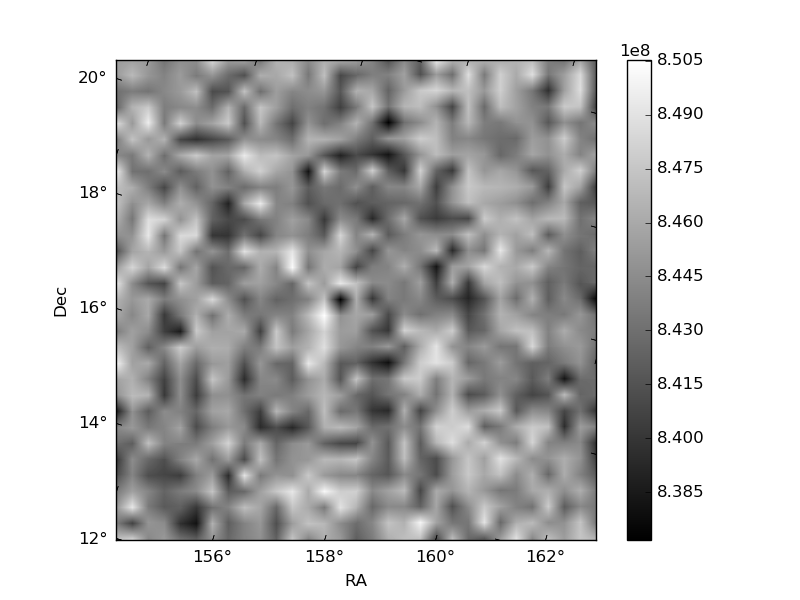
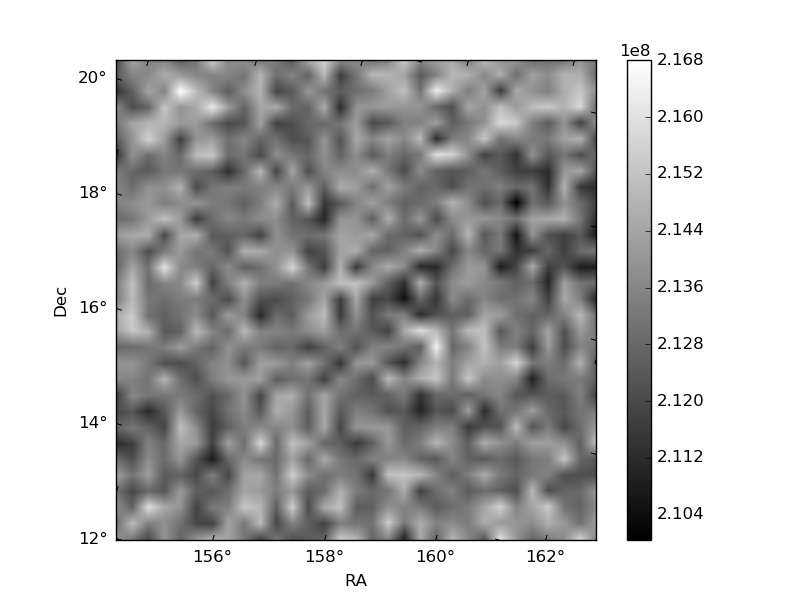
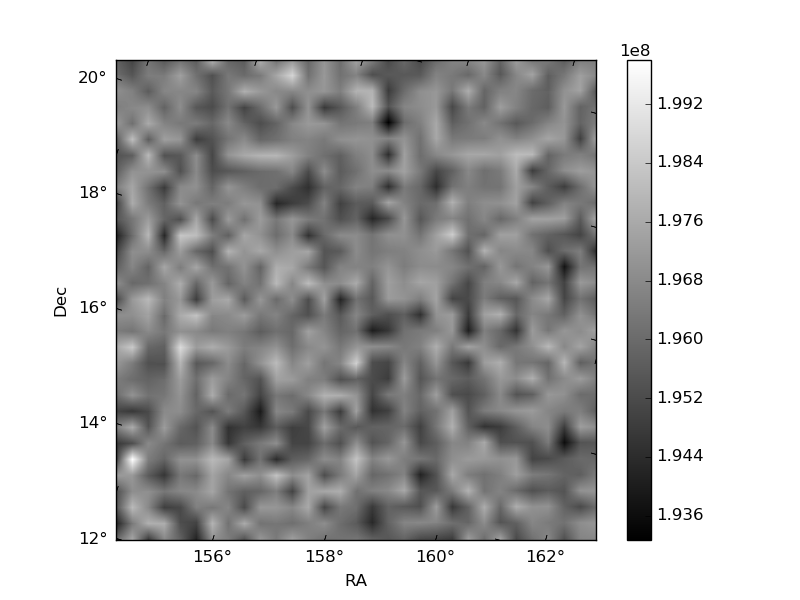
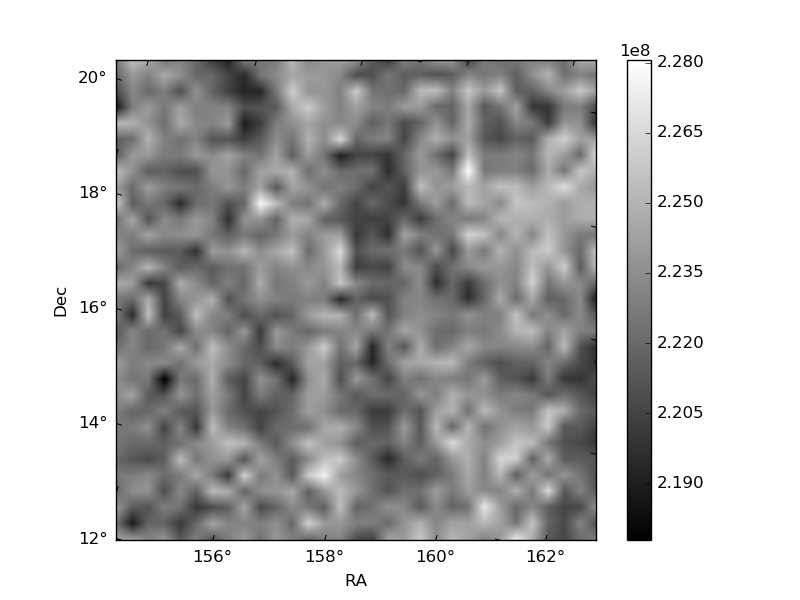
Histogram calculated using DETX and DETY for each event in the final _common_clean file
| Quadrant A | 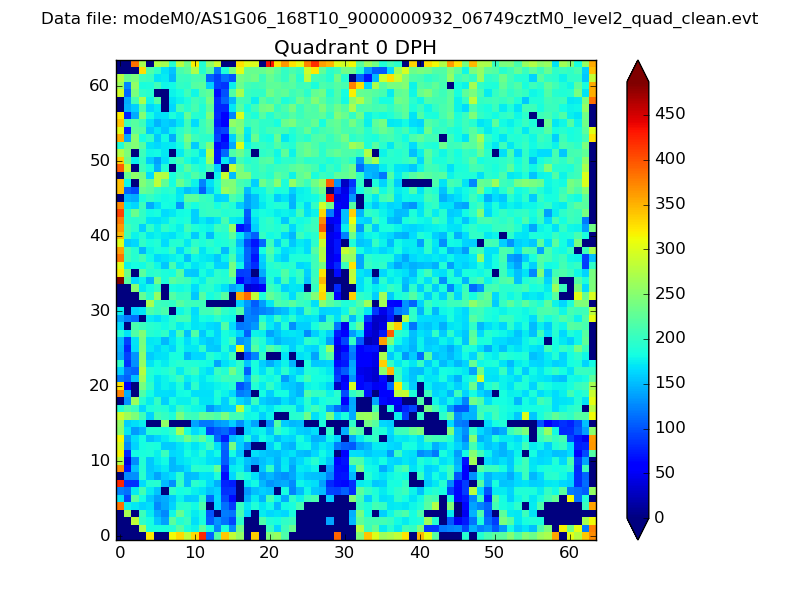 |
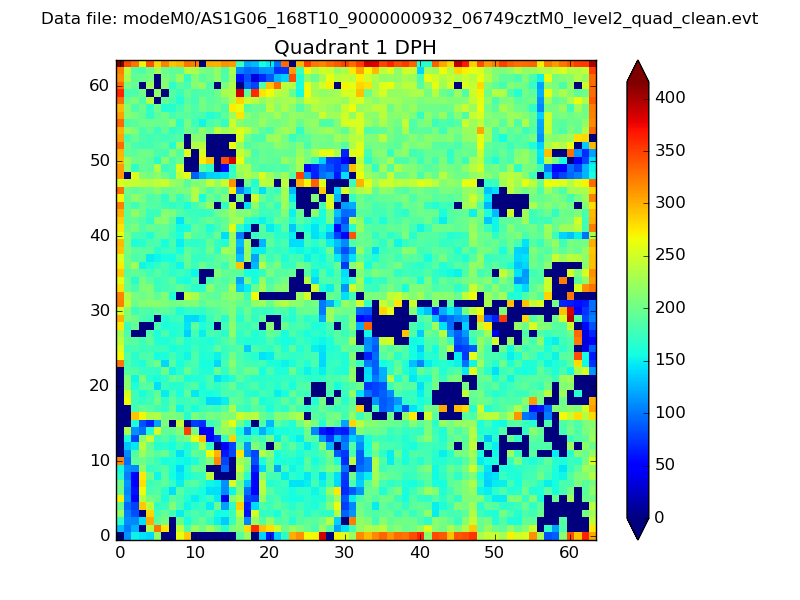 |
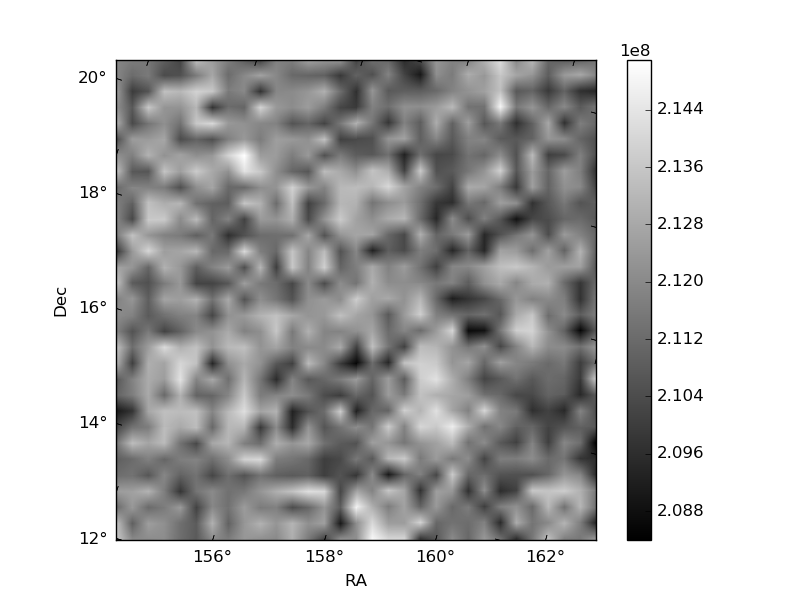
Quadrant B |
|---|---|---|---|
| Quadrant D | 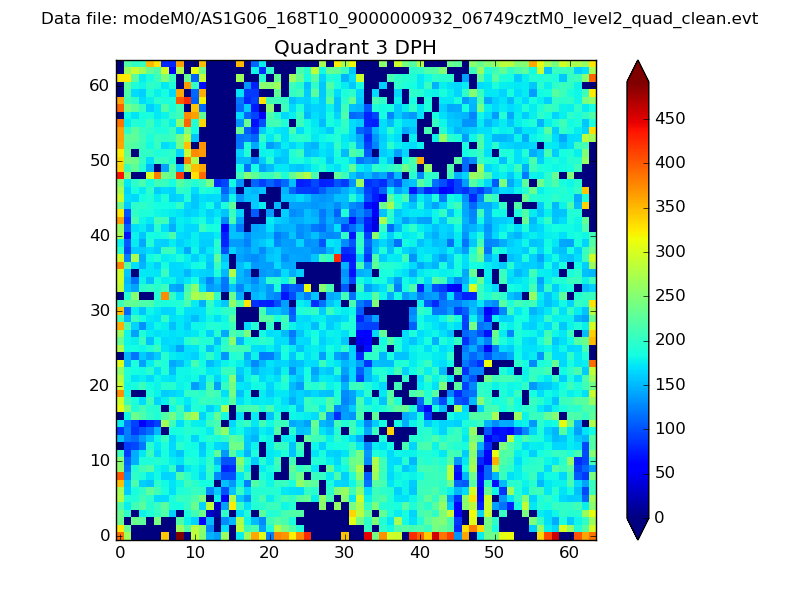 |
 |
Quadrant C |
| Plot type | Count rate plots | Images |
|---|---|---|
| Comparison with Poisson distribution Blue bars denote a histogram of data divided into 1 sec bins. Red curve is a Poisson curve with rate = median count rate of data. |
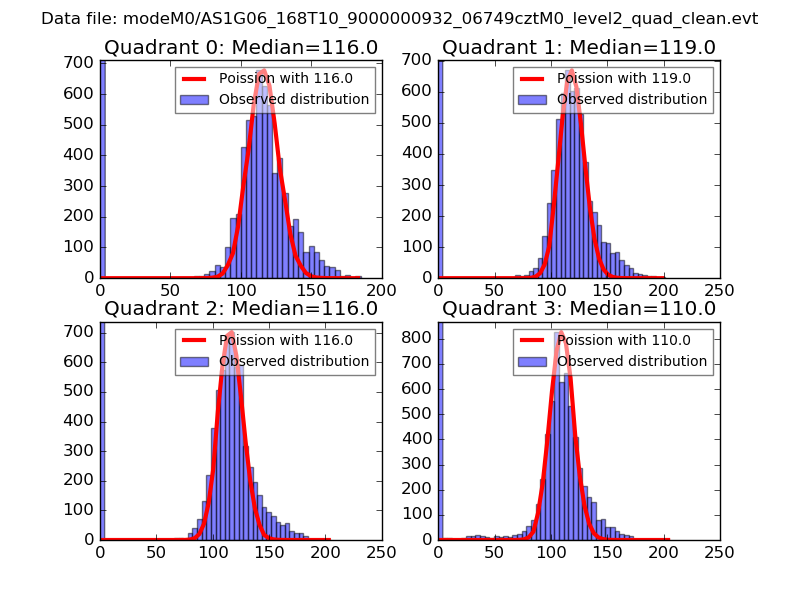 |
 |
| Quadrant-wise count rates Data is divided into 100 sec bins |
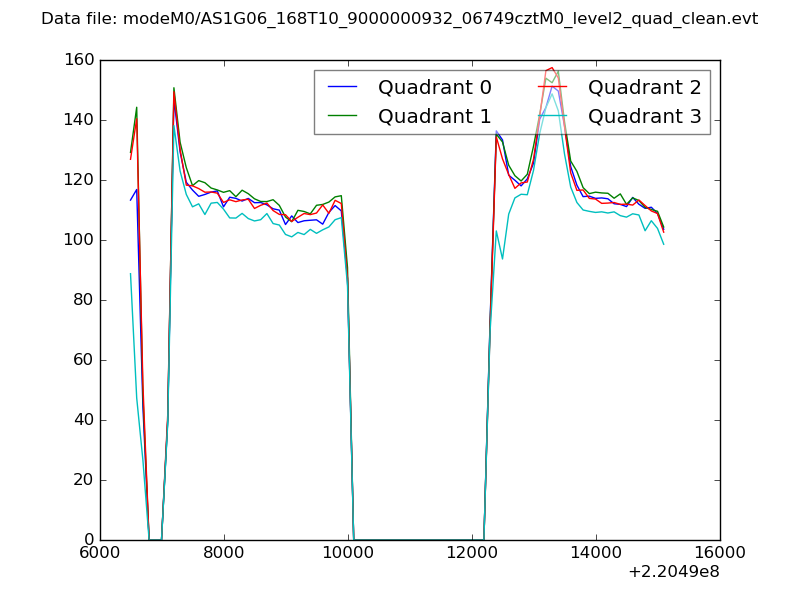 |
|
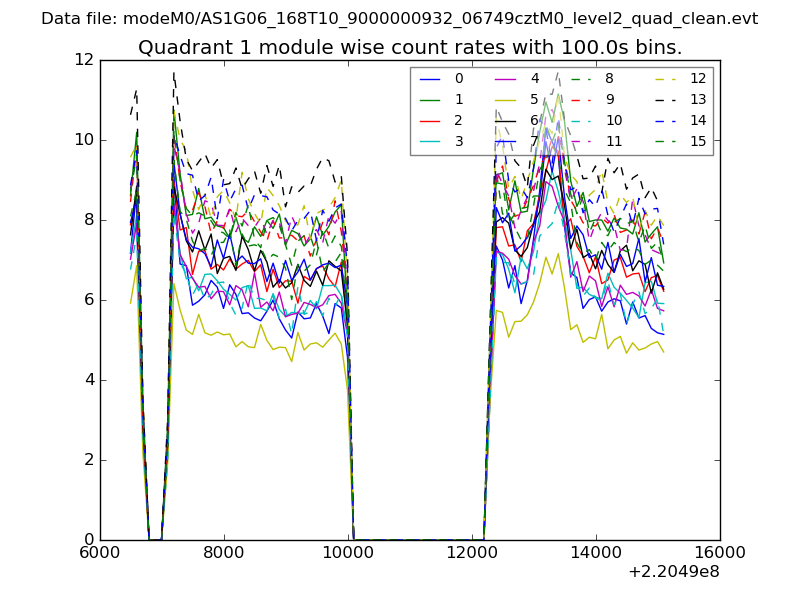
| Module-wise count rates for Quadrant A Data is divided into 100 sec bins |
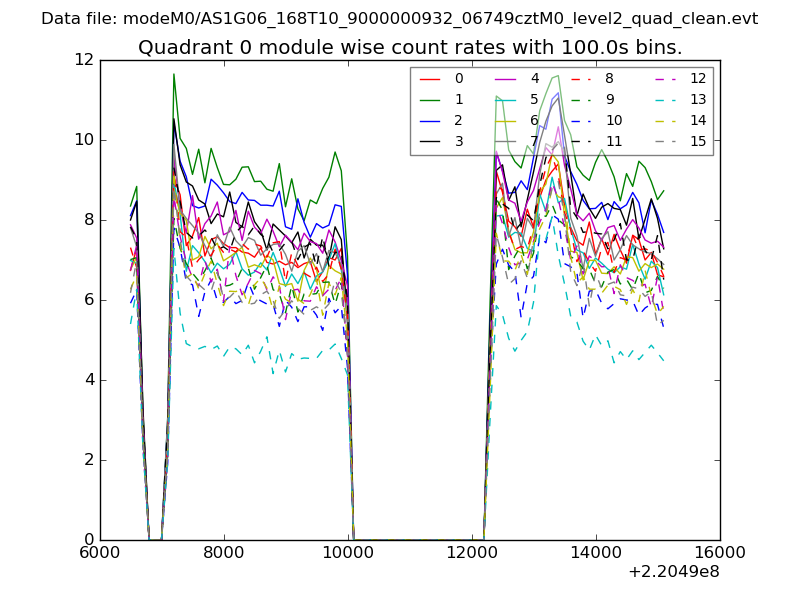 |
 |
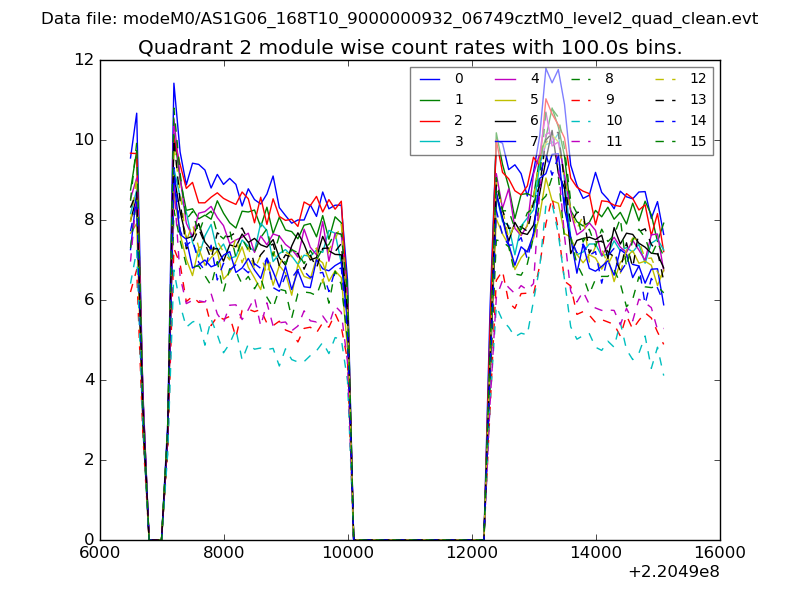
| Module-wise count rates for Quadrant B Data is divided into 100 sec bins |
 |
 |
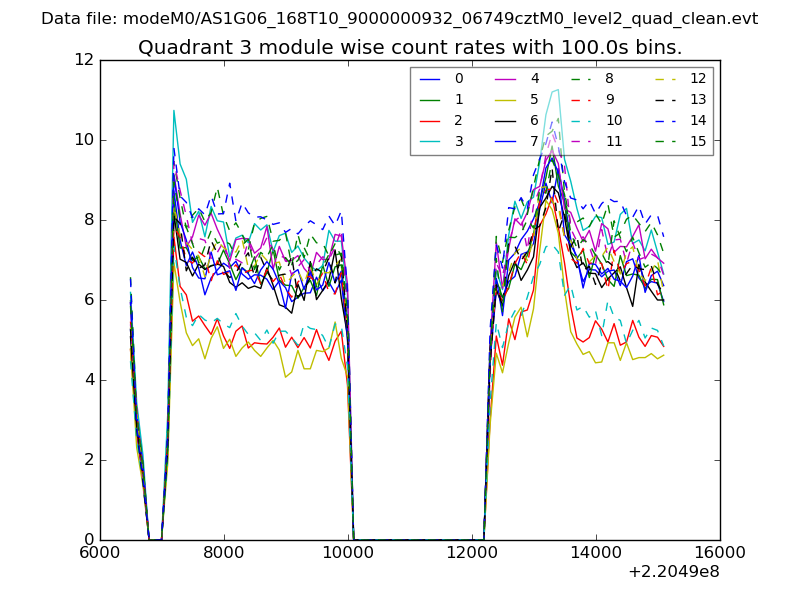
| Module-wise count rates for Quadrant C Data is divided into 100 sec bins |
 |
 |
| Module-wise count rates for Quadrant D Data is divided into 100 sec bins |
 |
 |
| Parameter | Plot |
|---|---|
| CZT HV Monitor | 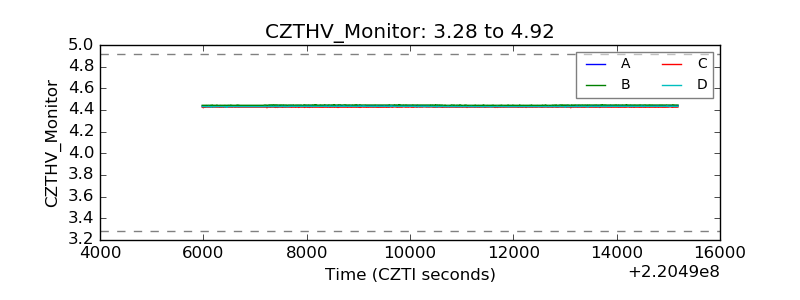 |
| D_VDD | 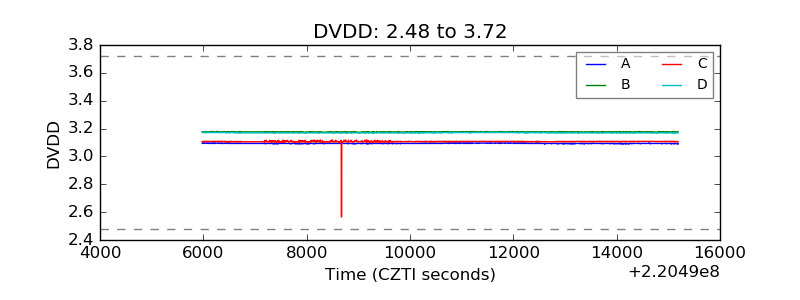 |
| Temperature 1 | 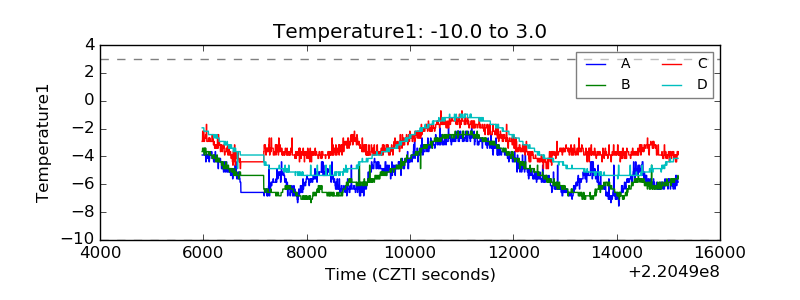 |
| Veto HV Monitor | 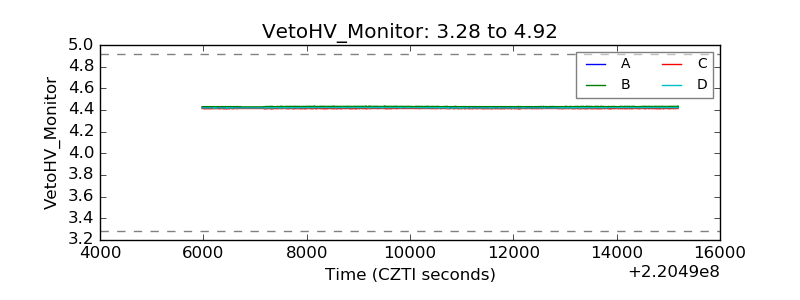 |
| Veto LLD | 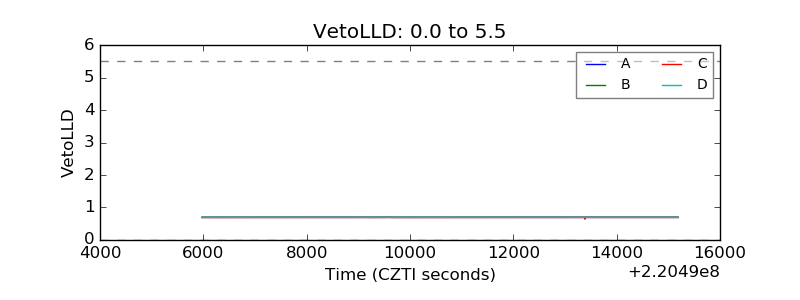 |
| Alpha Counter | 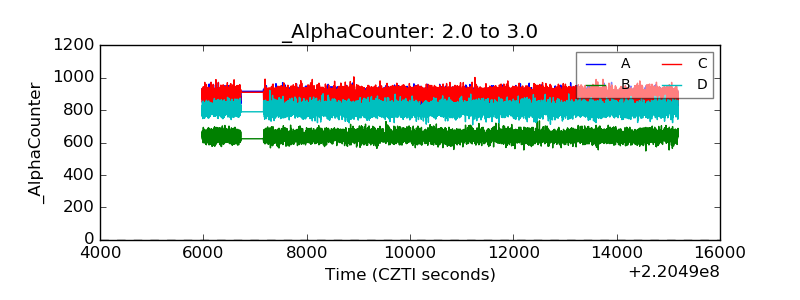 |
| _CPM_Rate | 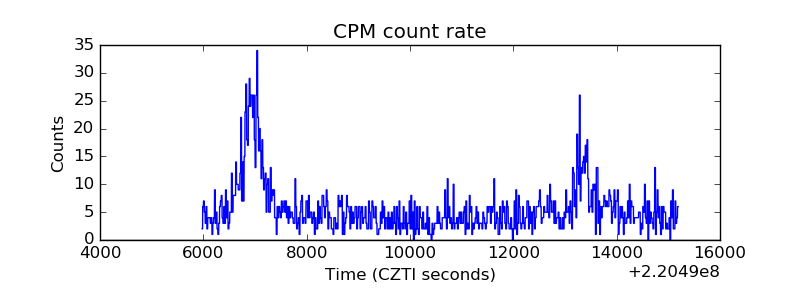 |
| CZT Counter | 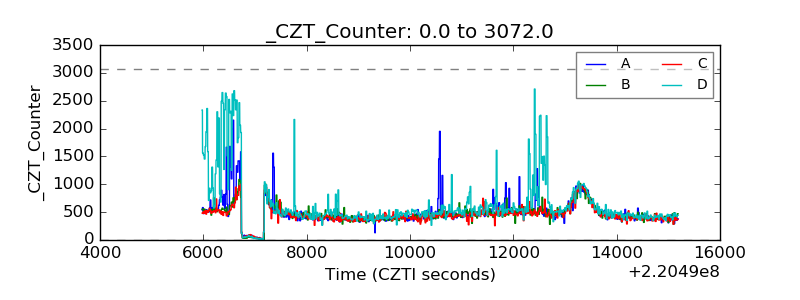 |
| +2.5 Volts monitor |  |
| +5 Volts monitor |  |
| _ROLL_ROT | 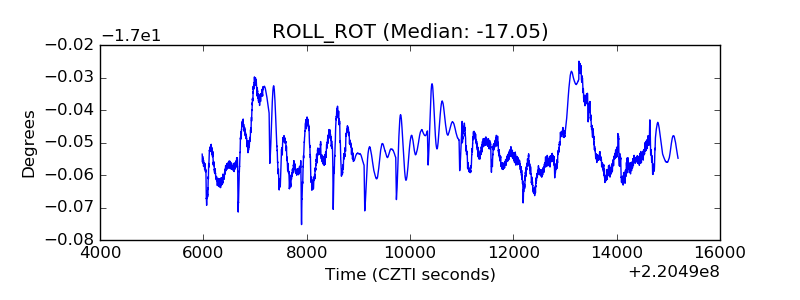 |
| _Roll_DEC | 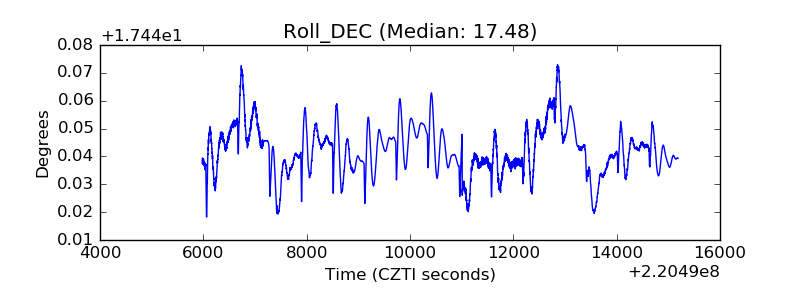 |
| _Roll_RA | 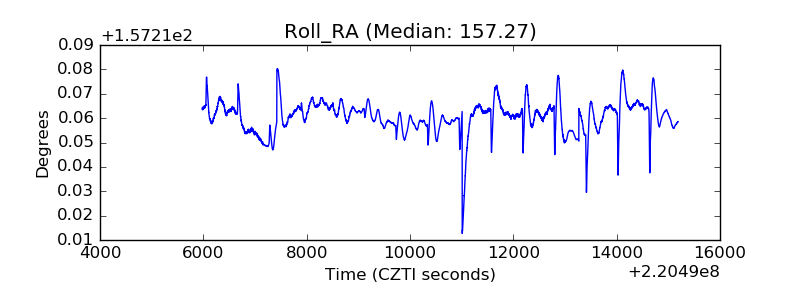 |
| Veto Counter | 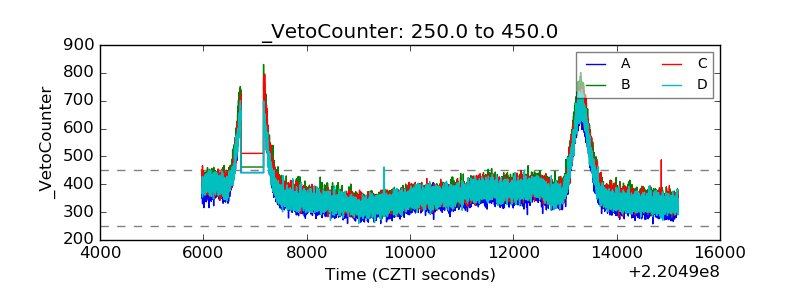 |