| Param | Original file | Final file |
|---|---|---|
| Filename | modeM0/AS1G06_168T10_9000000932_06750cztM0_level2.evt | modeM0/AS1G06_168T10_9000000932_06750cztM0_level2_quad_clean.evt |
| Size (bytes) | 623,949,120 | 119,986,560 |
| Size | 595.0 MB | 114.4 MB |
| Events in quadrant A | 4,750,351 | 751,017 |
| Events in quadrant B | 4,274,907 | 779,782 |
| Events in quadrant C | 4,044,408 | 767,785 |
| Events in quadrant D | 5,235,630 | 730,393 |
| Mode M9 | |||
|---|---|---|---|
| Quadrant | BADHDUFLAG | Total packets | Discarded packets |
| A | 0 | 2 | 0 |
| B | 0 | 2 | 0 |
| C | 0 | 2 | 0 |
| D | 0 | 2 | 0 |
| Mode SS | |||
|---|---|---|---|
| Quadrant | BADHDUFLAG | Total packets | Discarded packets |
| A | 0 | 178 | 0 |
| B | 0 | 178 | 0 |
| C | 0 | 178 | 0 |
| D | 0 | 178 | 0 |
| Mode M0 | |||
|---|---|---|---|
| Quadrant | BADHDUFLAG | Total packets | Discarded packets |
| A | 0 | 20156 | 2 |
| B | 0 | 18627 | 1 |
| C | 0 | 18290 | 1 |
| D | 0 | 21259 | 1 |
| Quadrant | Total seconds | Saturated seconds | Saturation percentage |
|---|---|---|---|
| A | 8700 | 469 | 5.390805% |
| B | 8700 | 280 | 3.218391% |
| C | 8700 | 132 | 1.517241% |
| D | 8700 | 342 | 3.931034% |
Noise dominated data is calculated using 1-second bins in cleaned event files. If a bin has >2000 counts, and if more than 50% of those come from <1% of pixels, then it is considered to be noise-dominated and hence unusable.
| Quadrant | # 1 sec bins | Bins with >0 counts | Bins with >2000 counts | High rate bins dominated by noise | Noise dominated (total time) | Noise dominated (detector-on time) | Marked lightcurve |
|---|---|---|---|---|---|---|---|
| A | 8930 | 8701 | 187 | 187 | 2.09% | 2.15% | 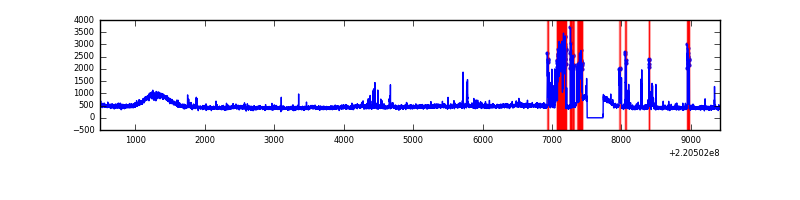 |
| B | 8930 | 8701 | 8 | 8 | 0.09% | 0.09% | 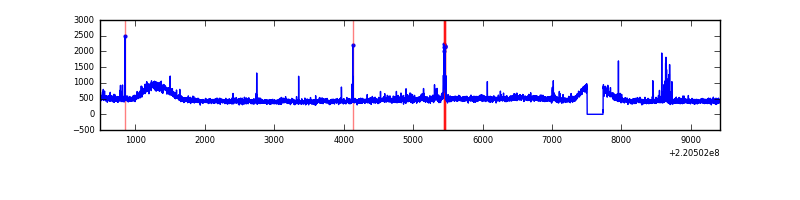 |
| C | 8930 | 8701 | 0 | 0 | 0.00% | 0.00% | 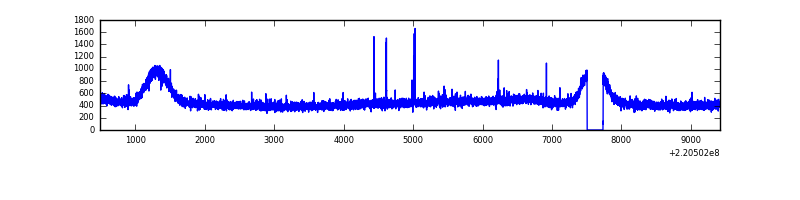 |
| D | 8930 | 8701 | 154 | 154 | 1.72% | 1.77% | 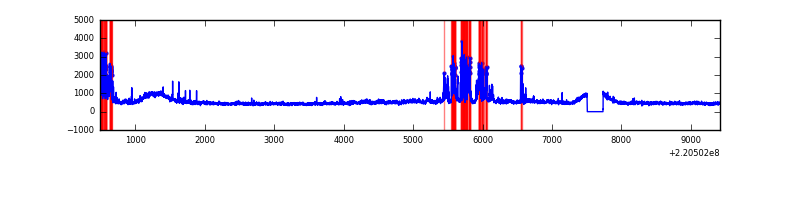 |
Top three noisy pixels from each quadrant. If the there are fewer than three noisy pixels in the level2.evt file, extra rows are filled as -1
| Pixel properties | Quadrant properties | ||||||
|---|---|---|---|---|---|---|---|
| Quadrant | DetID | PixID | Counts | Sigma | Mean | Median | Sigma |
| A | 4 | 2 | 643988 | 2992.04 | 1039 | 1015 | 214.9 |
| A | 14 | 111 | 62988 | 288.39 | 1039 | 1015 | 214.9 |
| A | 13 | 248 | 21785 | 96.65 | 1039 | 1015 | 214.9 |
| B | 0 | 214 | 63154 | 299.29 | 1062 | 1032 | 207.6 |
| B | 4 | 81 | 47471 | 223.73 | 1062 | 1032 | 207.6 |
| B | 5 | 143 | 31163 | 145.16 | 1062 | 1032 | 207.6 |
| C | 9 | 16 | 26584 | 106.21 | 1022 | 1026 | 240.6 |
| C | 9 | 247 | 20919 | 82.66 | 1022 | 1026 | 240.6 |
| C | 13 | 61 | 7770 | 28.02 | 1022 | 1026 | 240.6 |
| D | 2 | 33 | 685305 | 2719.65 | 1014 | 981 | 251.6 |
| D | 8 | 195 | 589655 | 2339.51 | 1014 | 981 | 251.6 |
| D | 2 | 63 | 64764 | 253.49 | 1014 | 981 | 251.6 |
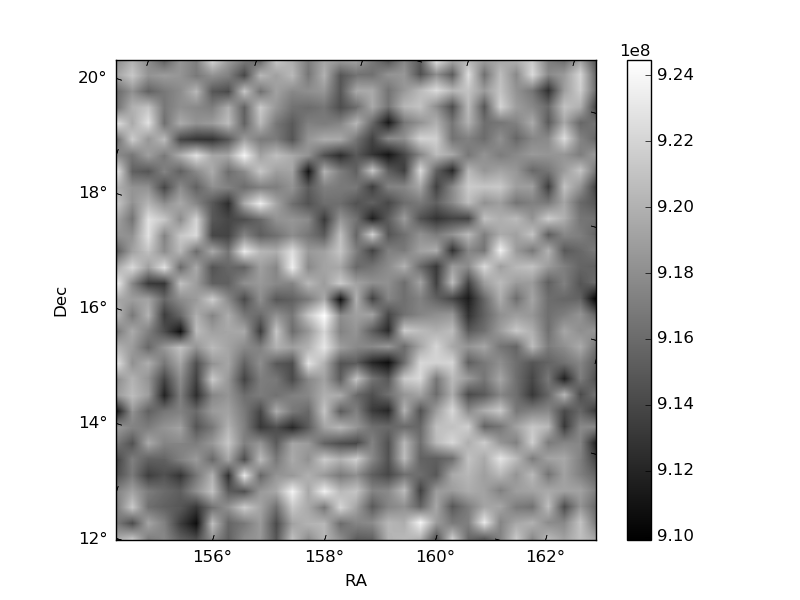
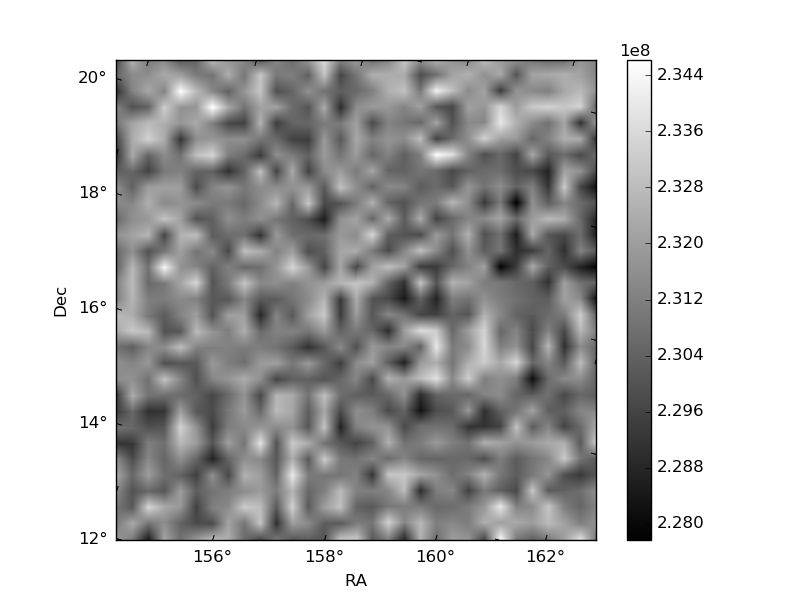
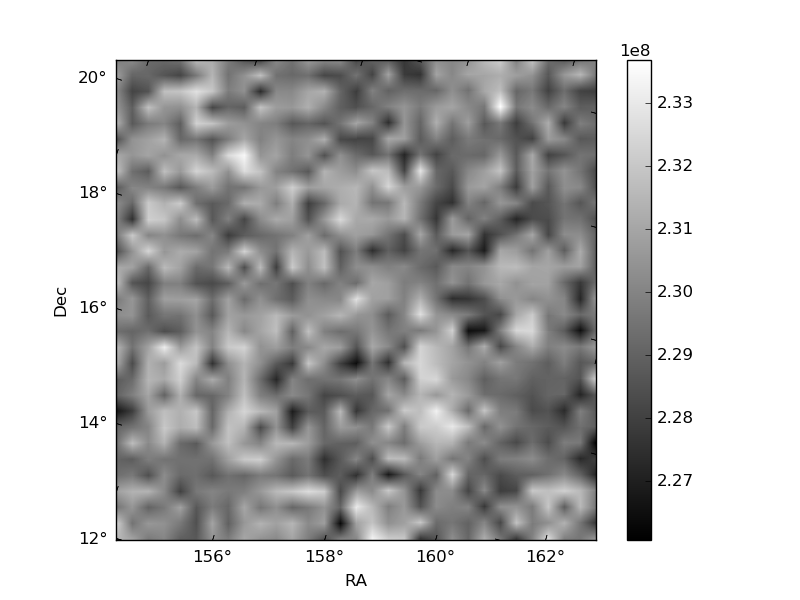
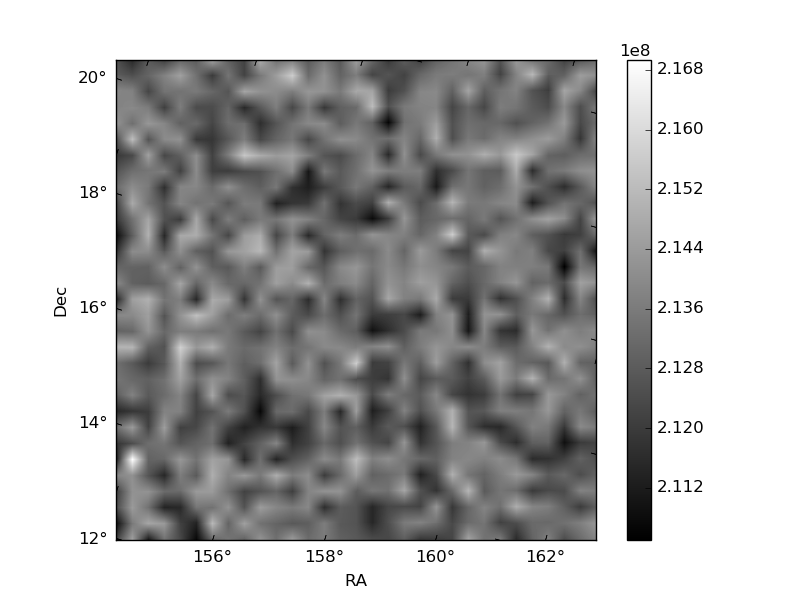
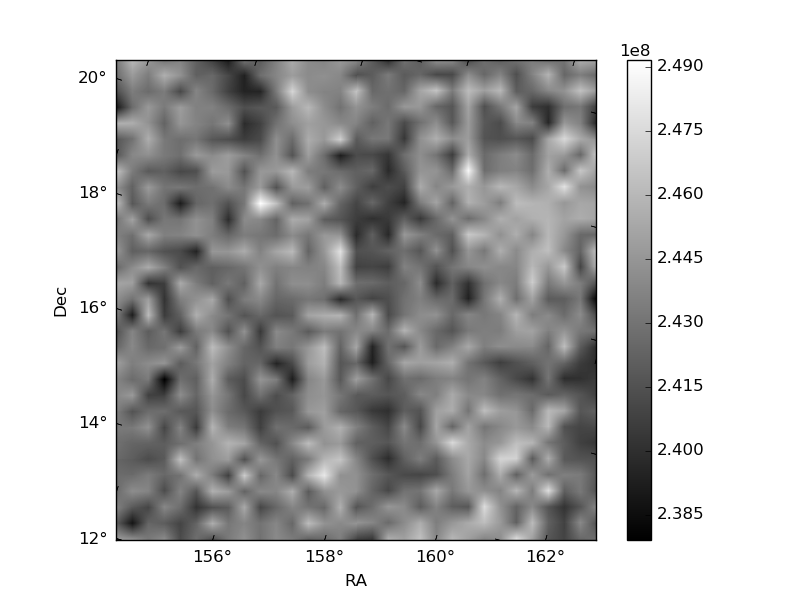
Histogram calculated using DETX and DETY for each event in the final _common_clean file
| Quadrant A | 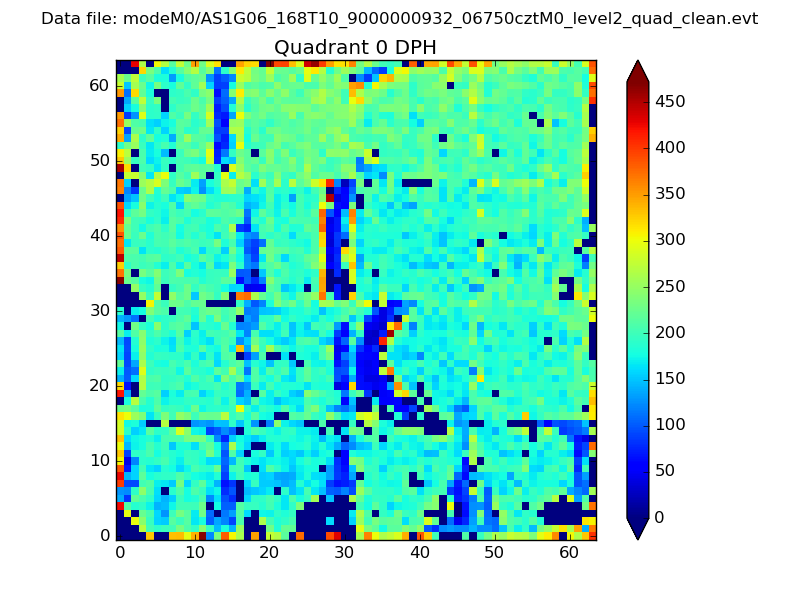 |
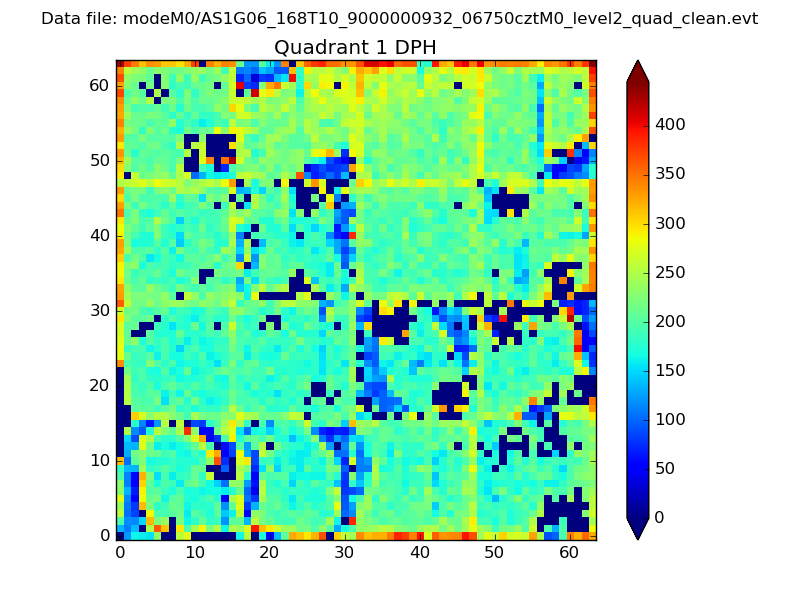 |
Quadrant B |
|---|---|---|---|
| Quadrant D | 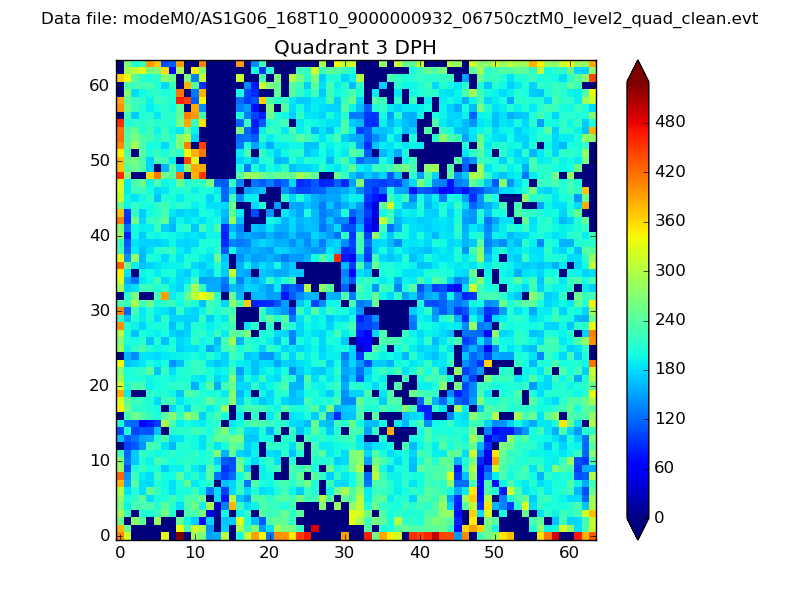 |
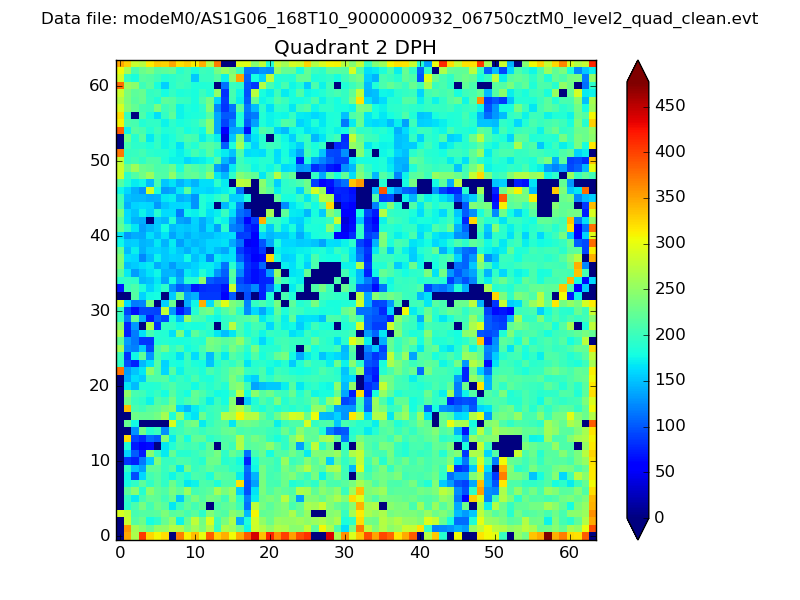 |
Quadrant C |
| Plot type | Count rate plots | Images |
|---|---|---|
| Comparison with Poisson distribution Blue bars denote a histogram of data divided into 1 sec bins. Red curve is a Poisson curve with rate = median count rate of data. |
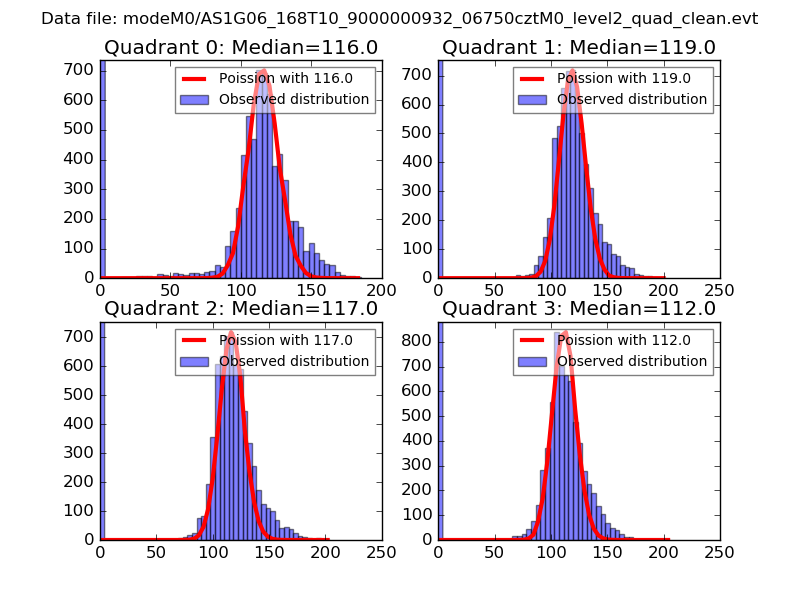 |
 |
| Quadrant-wise count rates Data is divided into 100 sec bins |
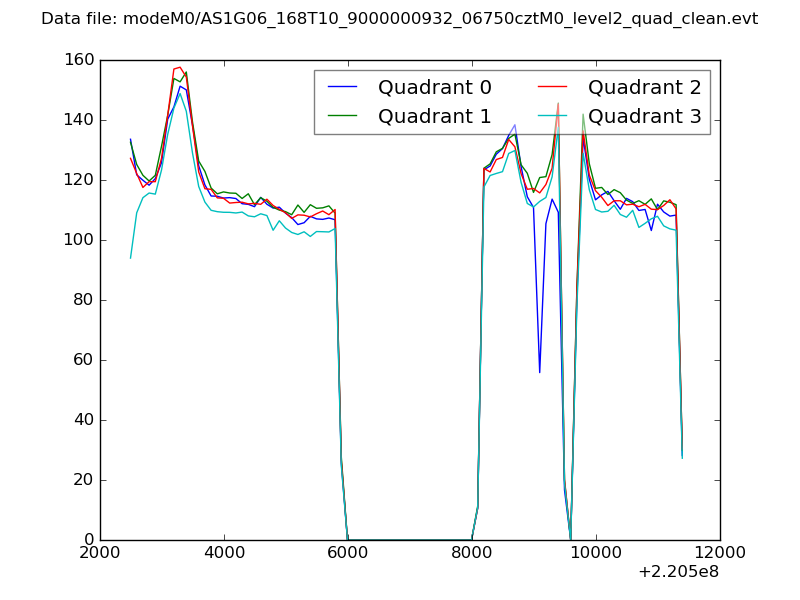 |
|
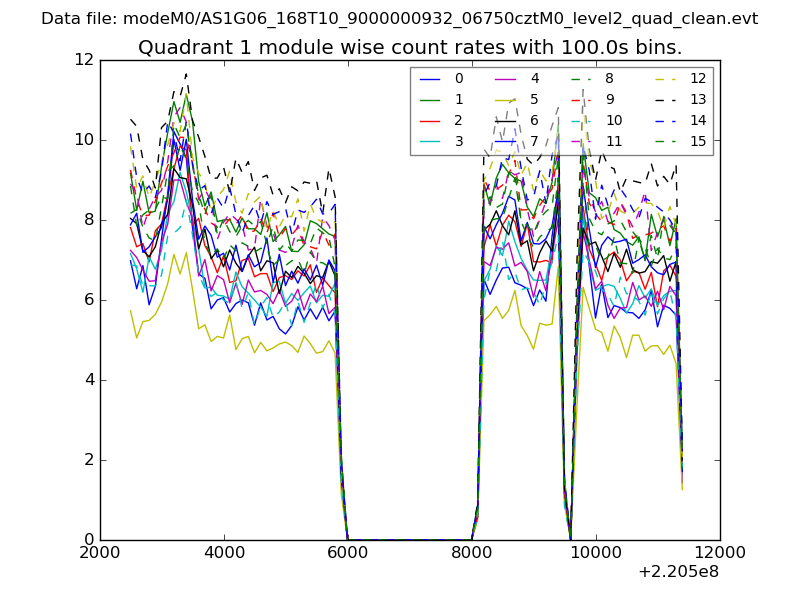
| Module-wise count rates for Quadrant A Data is divided into 100 sec bins |
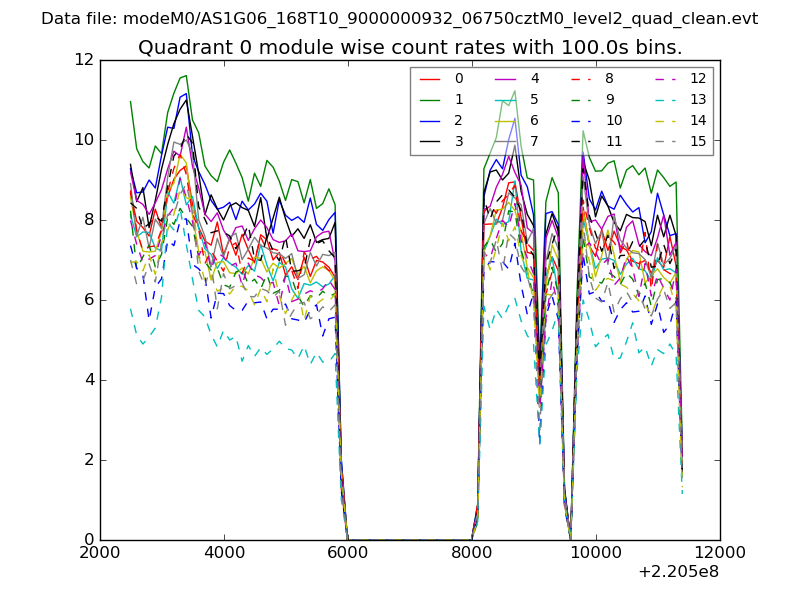 |
 |
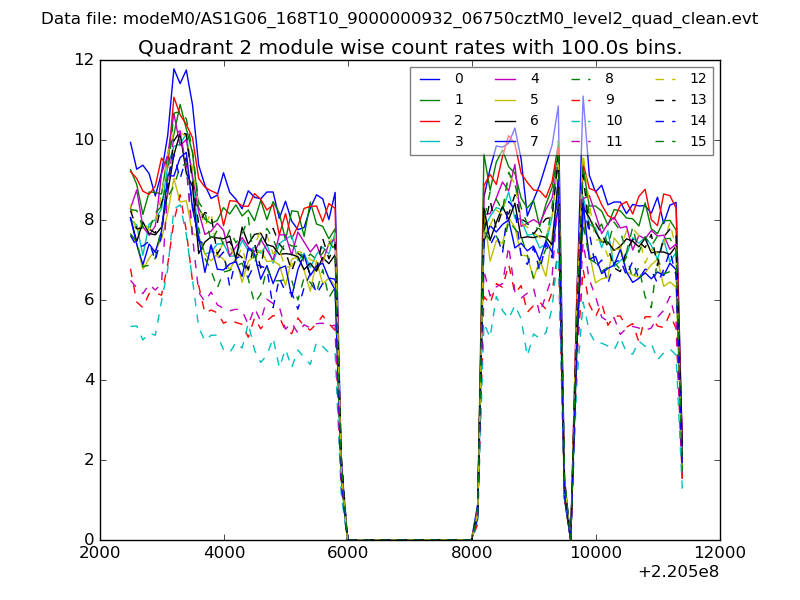
| Module-wise count rates for Quadrant B Data is divided into 100 sec bins |
 |
 |
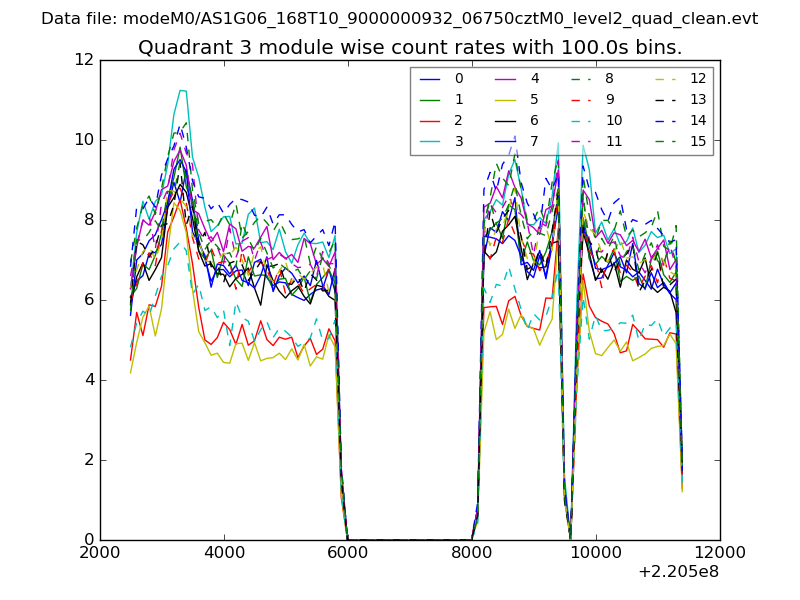
| Module-wise count rates for Quadrant C Data is divided into 100 sec bins |
 |
 |
| Module-wise count rates for Quadrant D Data is divided into 100 sec bins |
 |
 |
| Parameter | Plot |
|---|---|
| CZT HV Monitor | 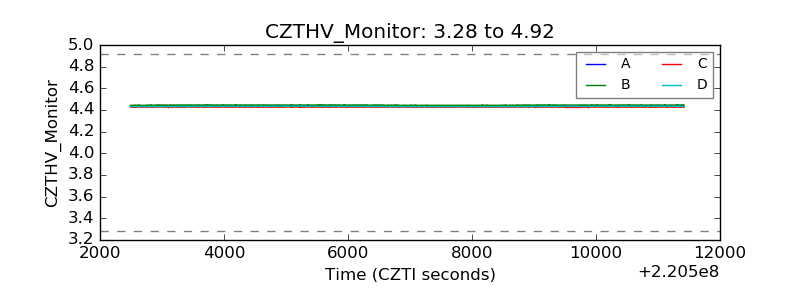 |
| D_VDD | 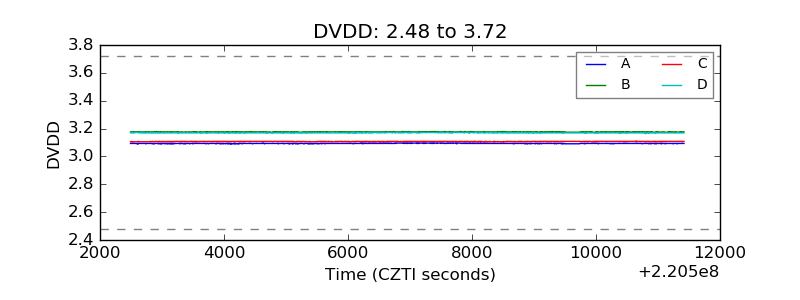 |
| Temperature 1 | 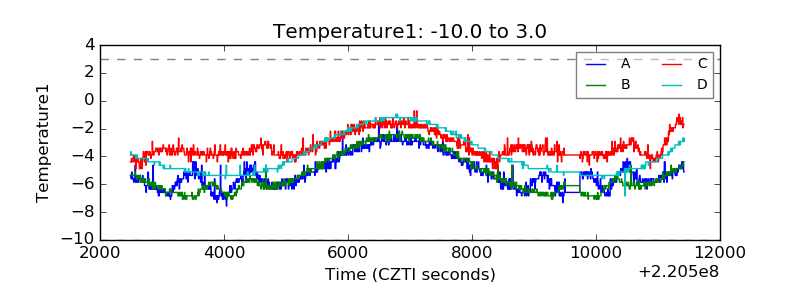 |
| Veto HV Monitor | 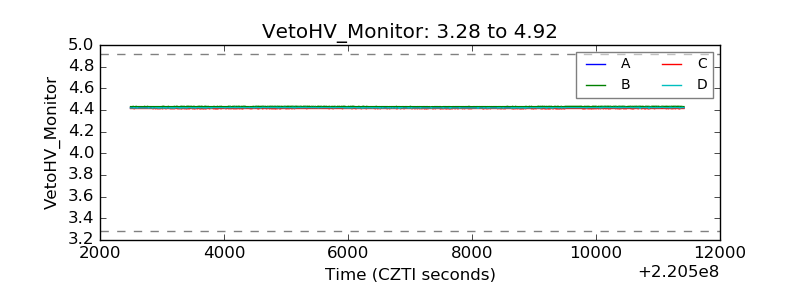 |
| Veto LLD | 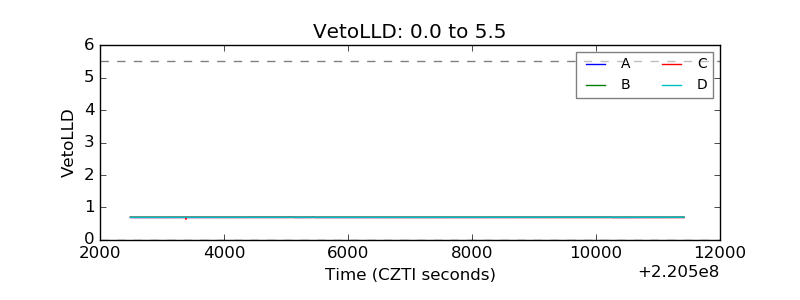 |
| Alpha Counter | 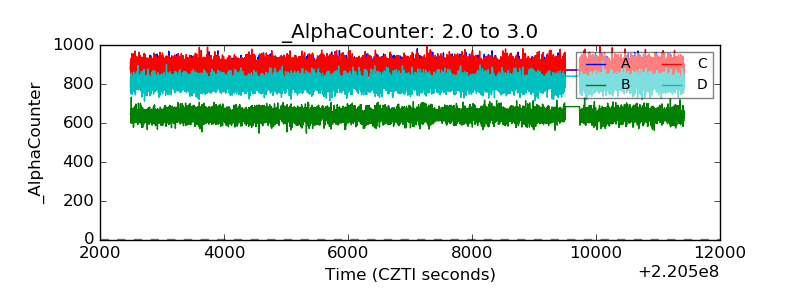 |
| _CPM_Rate | 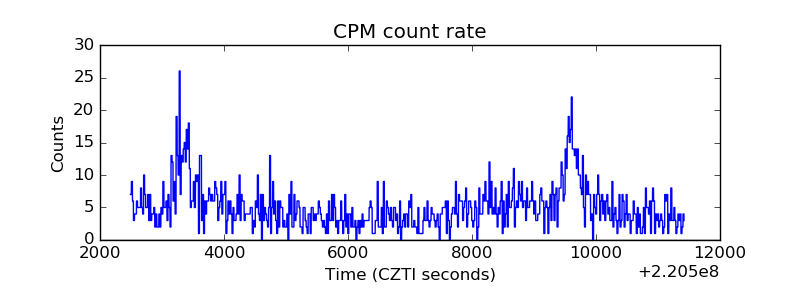 |
| CZT Counter | 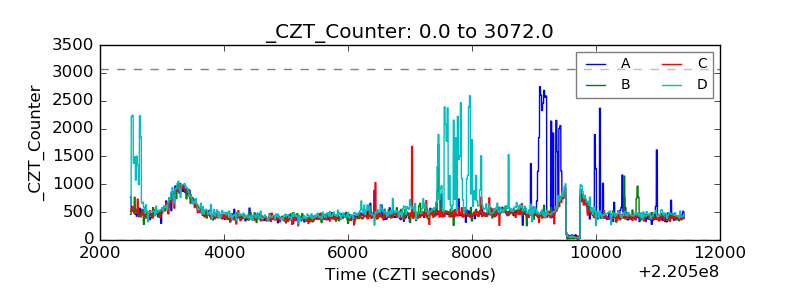 |
| +2.5 Volts monitor |  |
| +5 Volts monitor | 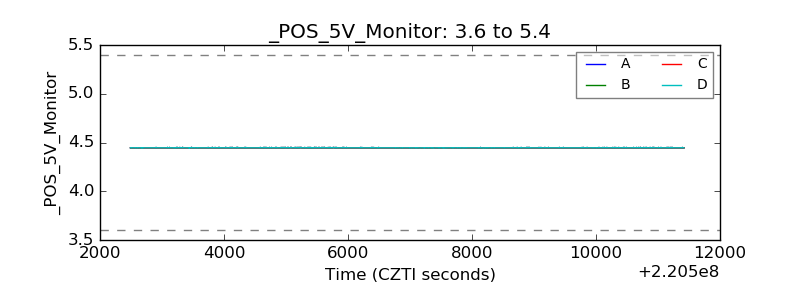 |
| _ROLL_ROT | 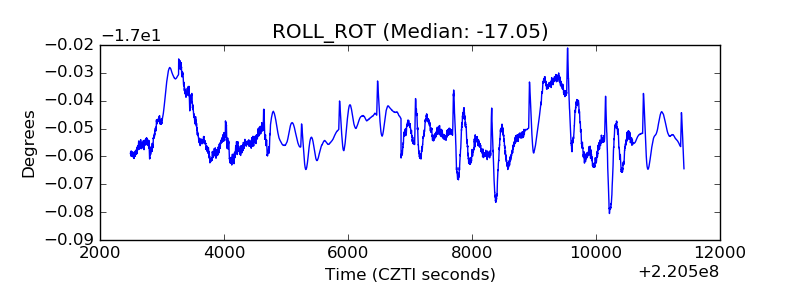 |
| _Roll_DEC | 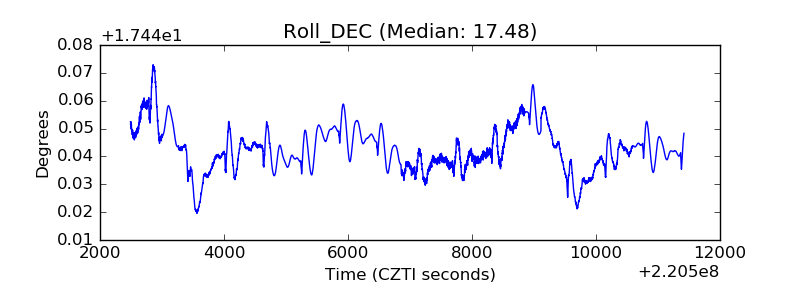 |
| _Roll_RA | 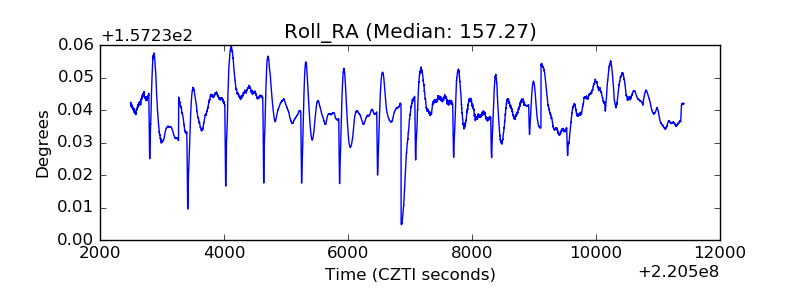 |
| Veto Counter | 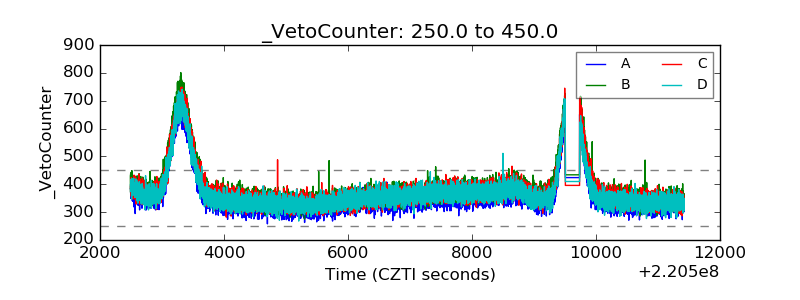 |