| Param | Original file | Final file |
|---|---|---|
| Filename | modeM0/AS1G06_168T10_9000000932_06753cztM0_level2.evt | modeM0/AS1G06_168T10_9000000932_06753cztM0_level2_quad_clean.evt |
| Size (bytes) | 776,439,360 | 133,309,440 |
| Size | 740.5 MB | 127.1 MB |
| Events in quadrant A | 6,147,487 | 804,842 |
| Events in quadrant B | 5,452,258 | 834,104 |
| Events in quadrant C | 5,071,261 | 820,855 |
| Events in quadrant D | 6,065,722 | 783,139 |
| Mode M9 | |||
|---|---|---|---|
| Quadrant | BADHDUFLAG | Total packets | Discarded packets |
| A | 0 | 7 | 0 |
| B | 0 | 7 | 0 |
| C | 0 | 7 | 0 |
| D | 0 | 7 | 0 |
| Mode SS | |||
|---|---|---|---|
| Quadrant | BADHDUFLAG | Total packets | Discarded packets |
| A | 0 | 234 | 0 |
| B | 0 | 234 | 0 |
| C | 0 | 234 | 0 |
| D | 0 | 234 | 0 |
| Mode M0 | |||
|---|---|---|---|
| Quadrant | BADHDUFLAG | Total packets | Discarded packets |
| A | 0 | 26256 | 2 |
| B | 0 | 23905 | 2 |
| C | 0 | 23364 | 2 |
| D | 0 | 25021 | 2 |
| Quadrant | Total seconds | Saturated seconds | Saturation percentage |
|---|---|---|---|
| A | 11474 | 440 | 3.834757% |
| B | 11474 | 159 | 1.385742% |
| C | 11474 | 107 | 0.932543% |
| D | 11474 | 180 | 1.568764% |
Noise dominated data is calculated using 1-second bins in cleaned event files. If a bin has >2000 counts, and if more than 50% of those come from <1% of pixels, then it is considered to be noise-dominated and hence unusable.
| Quadrant | # 1 sec bins | Bins with >0 counts | Bins with >2000 counts | High rate bins dominated by noise | Noise dominated (total time) | Noise dominated (detector-on time) | Marked lightcurve |
|---|---|---|---|---|---|---|---|
| A | 12154 | 11476 | 218 | 218 | 1.79% | 1.90% | 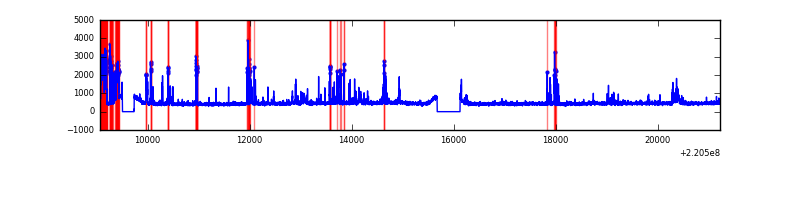 |
| B | 12154 | 11476 | 3 | 3 | 0.02% | 0.03% | 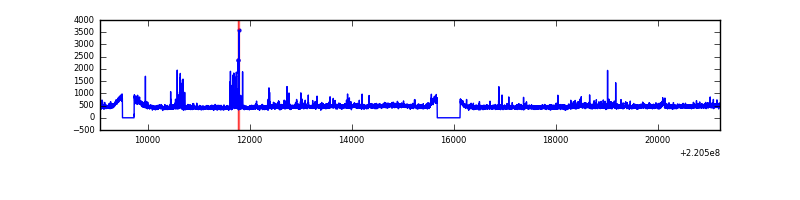 |
| C | 12154 | 11476 | 0 | 0 | 0.00% | 0.00% |  |
| D | 12154 | 11476 | 64 | 64 | 0.53% | 0.56% | 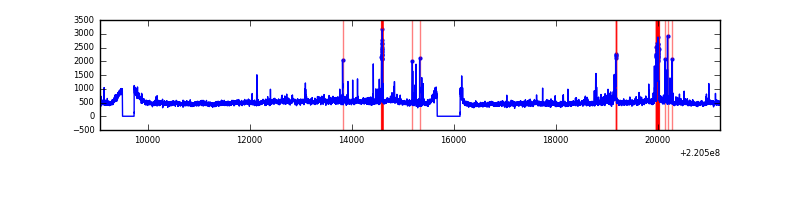 |
Top three noisy pixels from each quadrant. If the there are fewer than three noisy pixels in the level2.evt file, extra rows are filled as -1
| Pixel properties | Quadrant properties | ||||||
|---|---|---|---|---|---|---|---|
| Quadrant | DetID | PixID | Counts | Sigma | Mean | Median | Sigma |
| A | 4 | 2 | 682769 | 2538.61 | 1312 | 1282 | 268.4 |
| A | 14 | 111 | 165804 | 612.86 | 1312 | 1282 | 268.4 |
| A | 13 | 248 | 121390 | 447.42 | 1312 | 1282 | 268.4 |
| B | 4 | 81 | 156856 | 596.81 | 1336 | 1302 | 260.6 |
| B | 0 | 214 | 82612 | 311.96 | 1336 | 1302 | 260.6 |
| B | 5 | 143 | 32826 | 120.95 | 1336 | 1302 | 260.6 |
| C | 9 | 247 | 24451 | 76.44 | 1291 | 1293 | 303.0 |
| C | 13 | 61 | 10077 | 28.99 | 1291 | 1293 | 303.0 |
| C | 12 | 4 | 7099 | 19.16 | 1291 | 1293 | 303.0 |
| D | 8 | 195 | 693131 | 2178.66 | 1289 | 1247 | 317.6 |
| D | 2 | 33 | 243428 | 762.6 | 1289 | 1247 | 317.6 |
| D | 2 | 63 | 108202 | 336.79 | 1289 | 1247 | 317.6 |
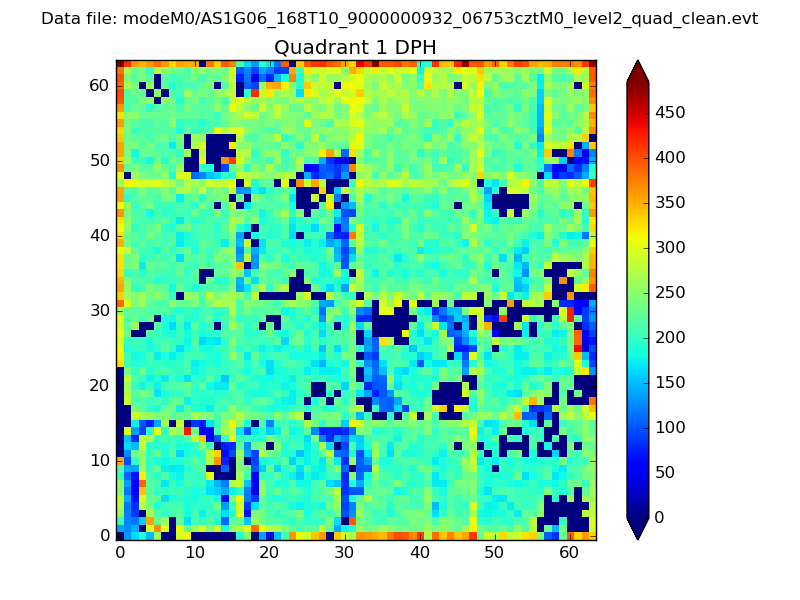
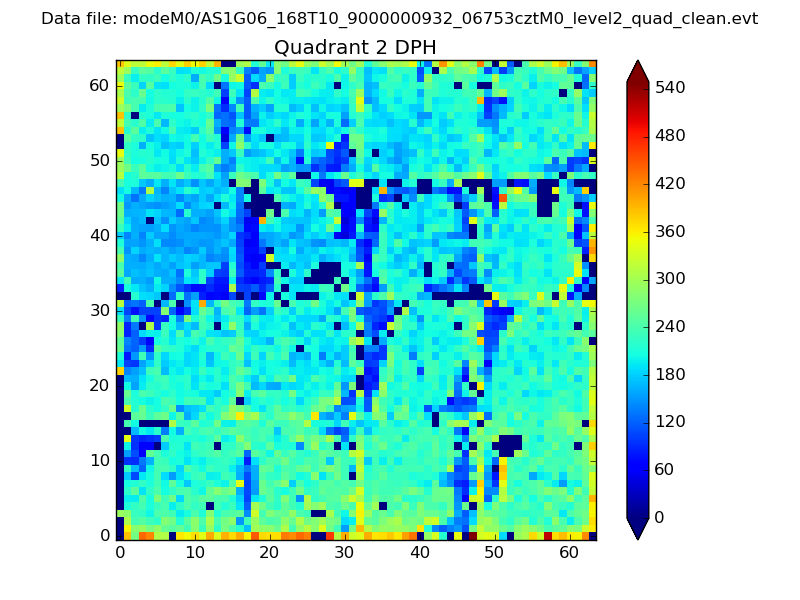
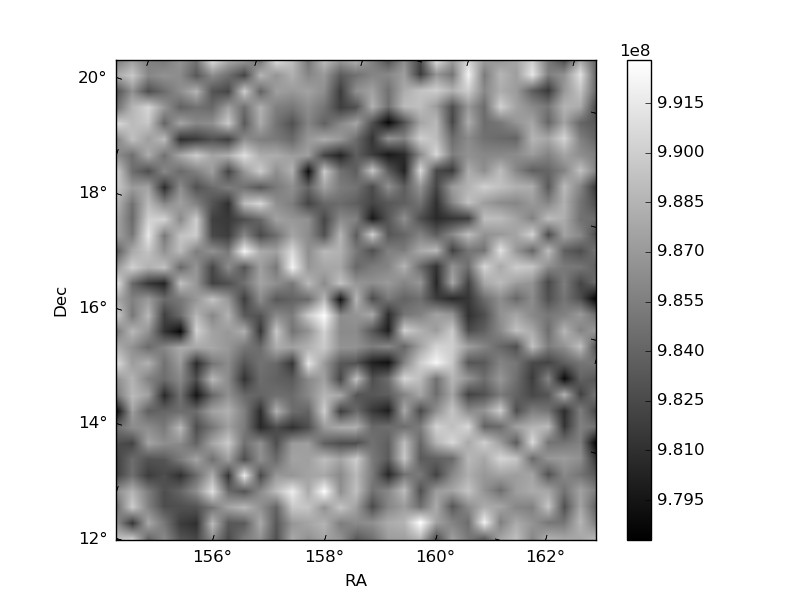
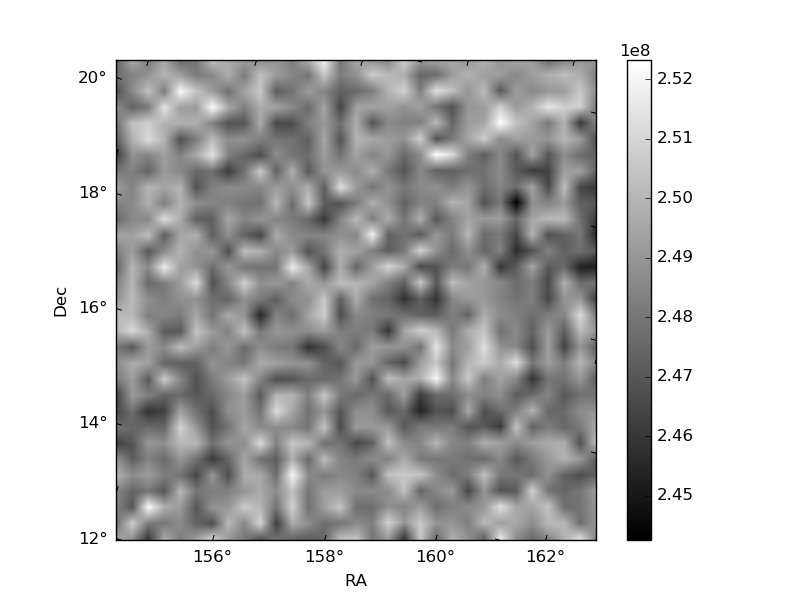
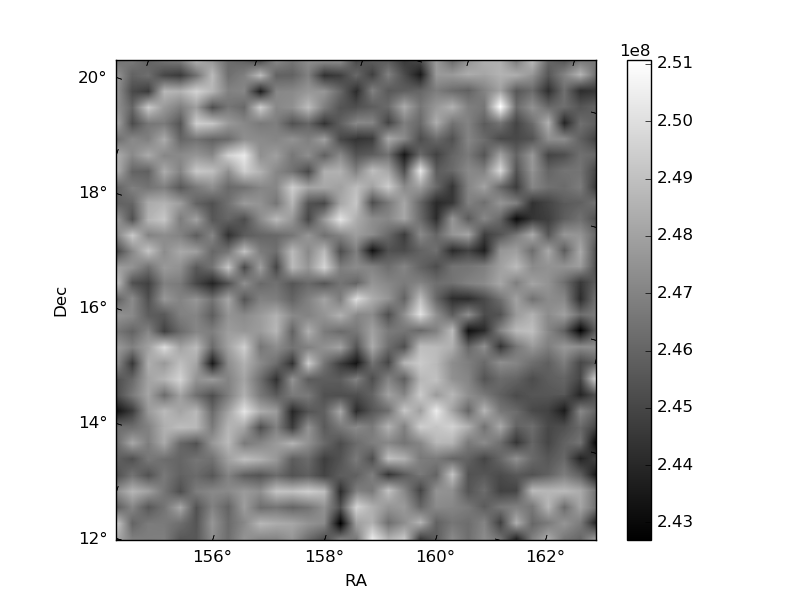
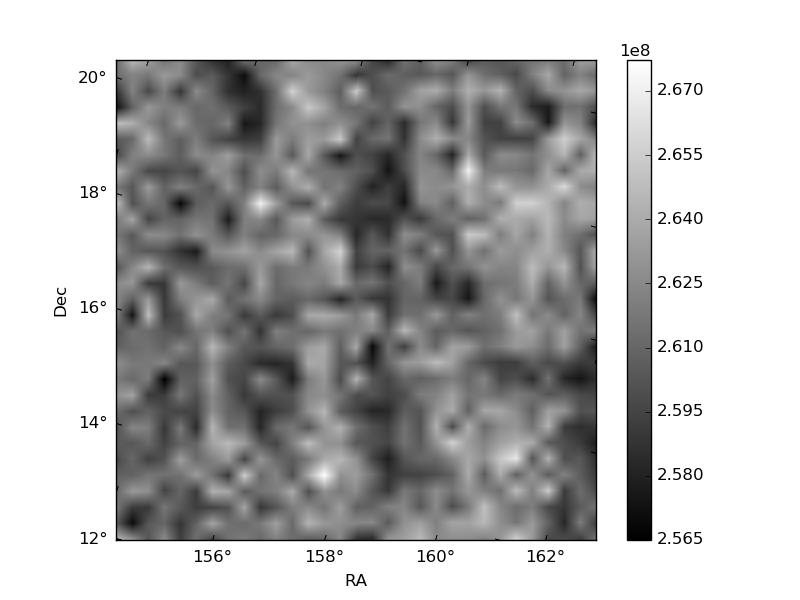
Histogram calculated using DETX and DETY for each event in the final _common_clean file
| Quadrant A | 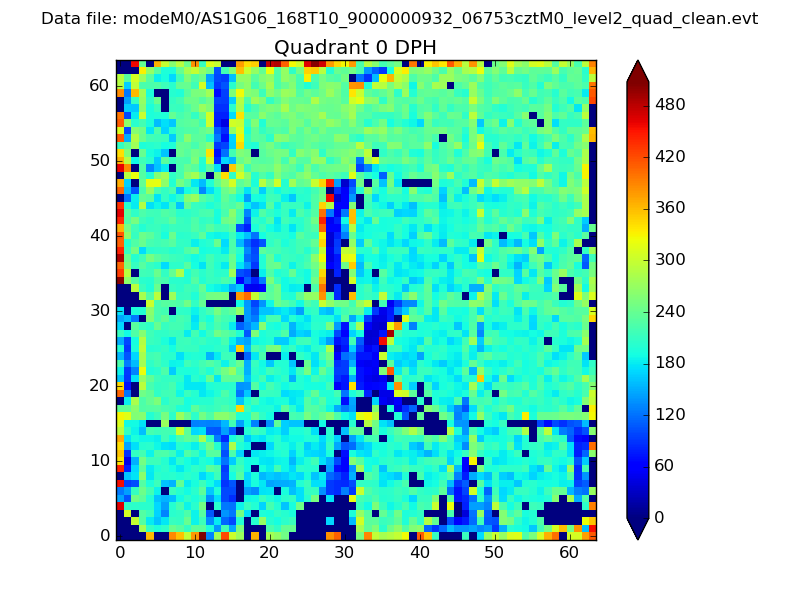 |
 |
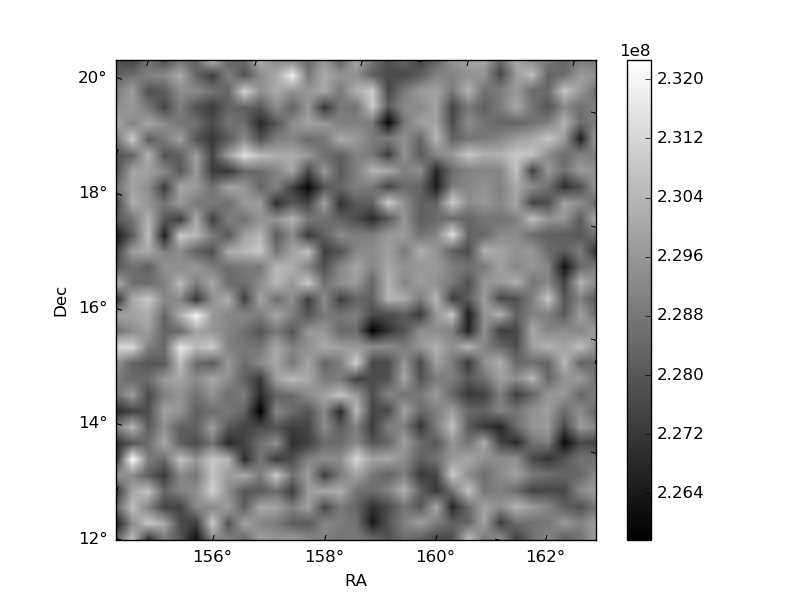
Quadrant B |
|---|---|---|---|
| Quadrant D | 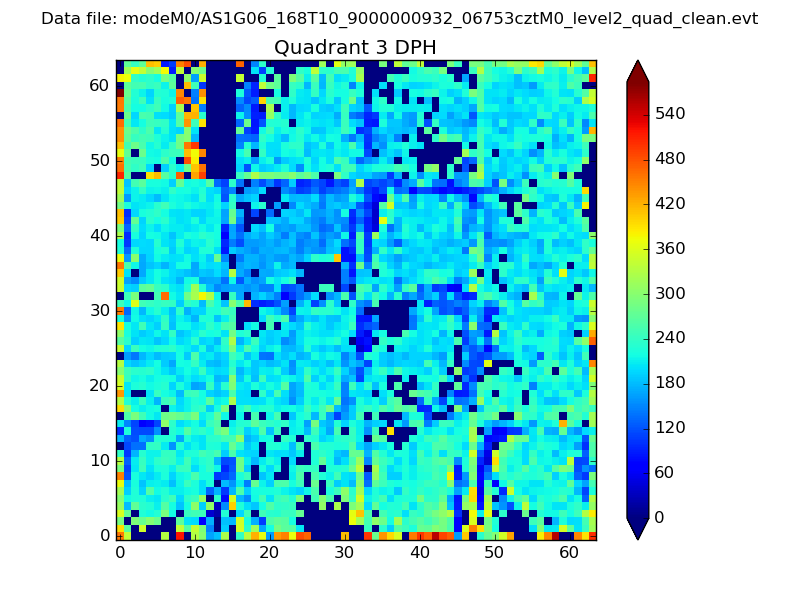 |
 |
Quadrant C |
| Plot type | Count rate plots | Images |
|---|---|---|
| Comparison with Poisson distribution Blue bars denote a histogram of data divided into 1 sec bins. Red curve is a Poisson curve with rate = median count rate of data. |
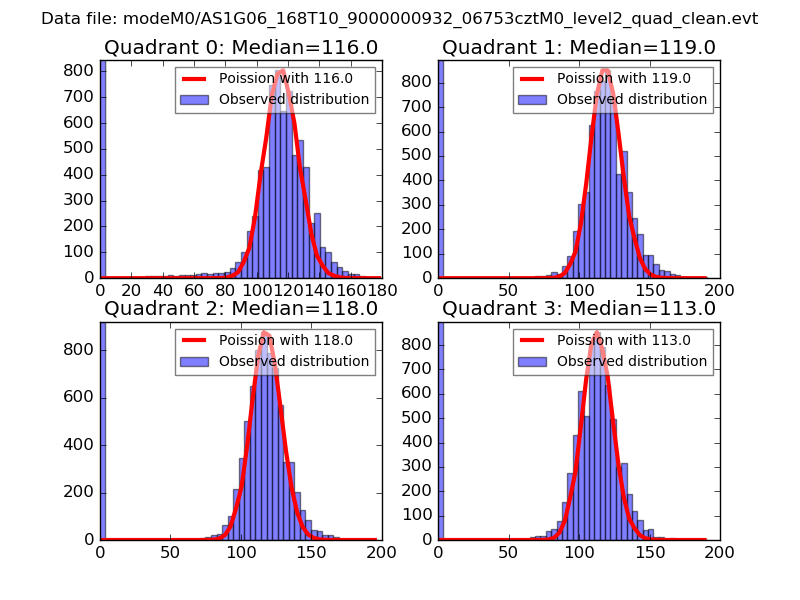 |
 |
| Quadrant-wise count rates Data is divided into 100 sec bins |
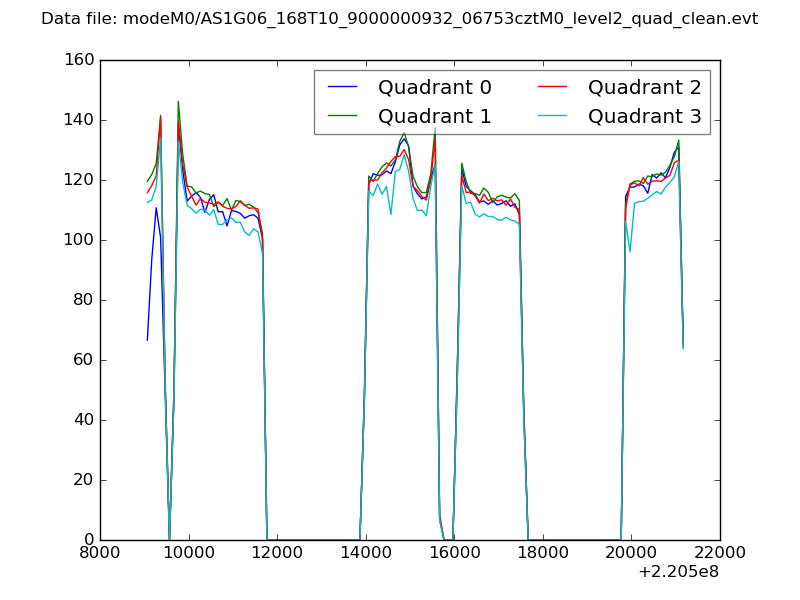 |
|
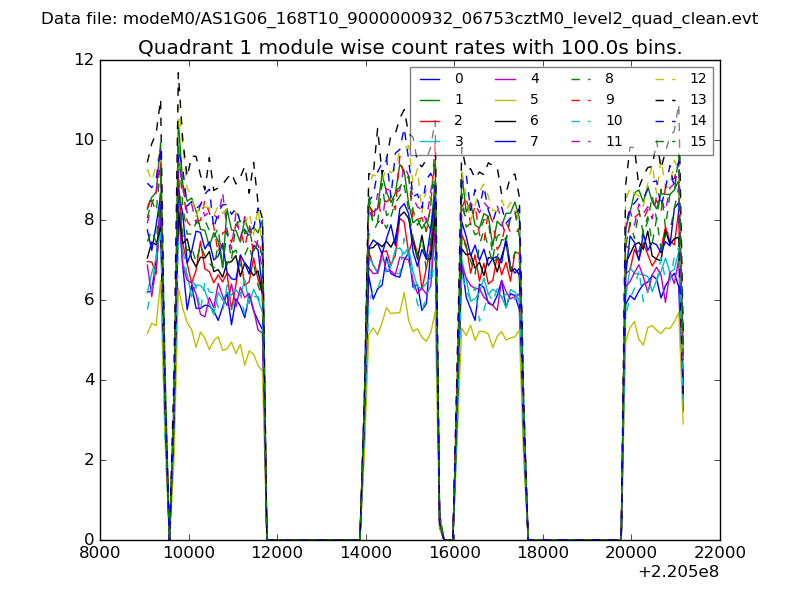
| Module-wise count rates for Quadrant A Data is divided into 100 sec bins |
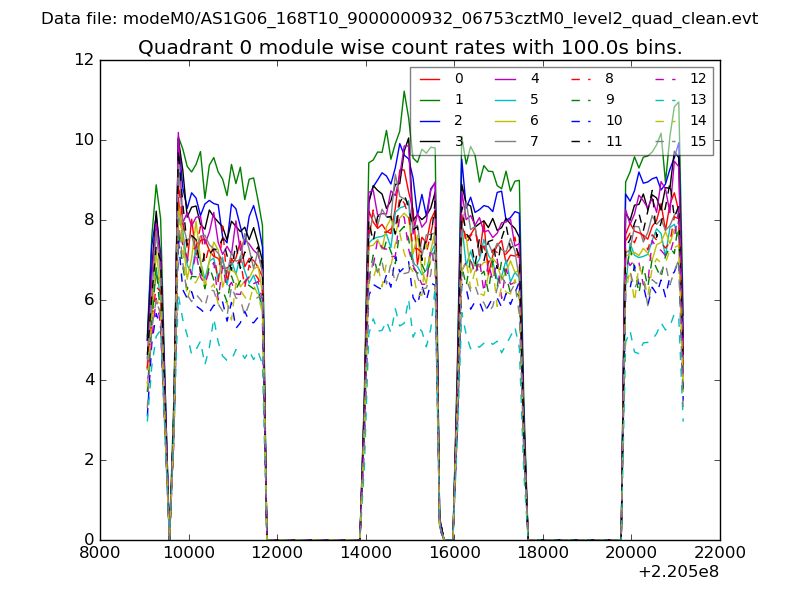 |
 |
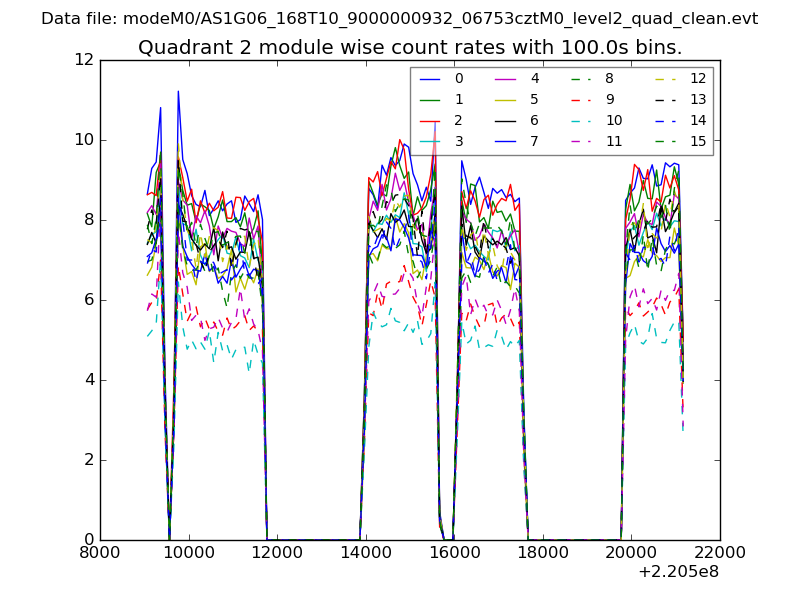
| Module-wise count rates for Quadrant B Data is divided into 100 sec bins |
 |
 |
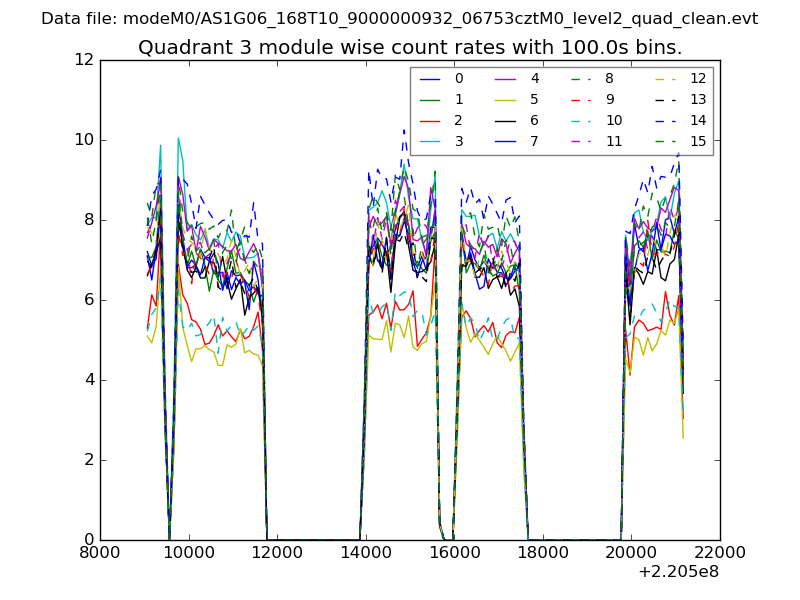
| Module-wise count rates for Quadrant C Data is divided into 100 sec bins |
 |
 |
| Module-wise count rates for Quadrant D Data is divided into 100 sec bins |
 |
 |
| Parameter | Plot |
|---|---|
| CZT HV Monitor | 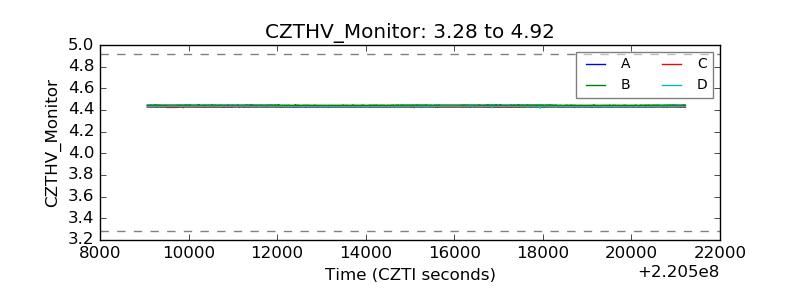 |
| D_VDD | 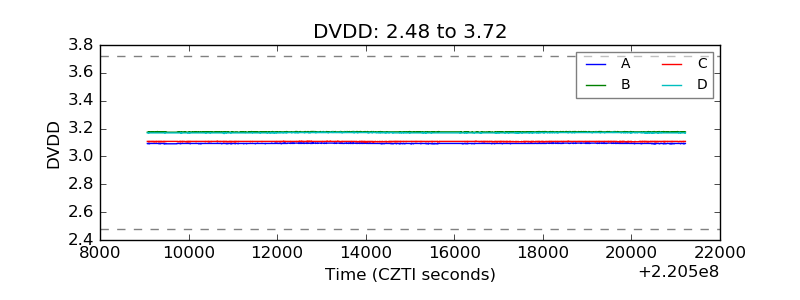 |
| Temperature 1 | 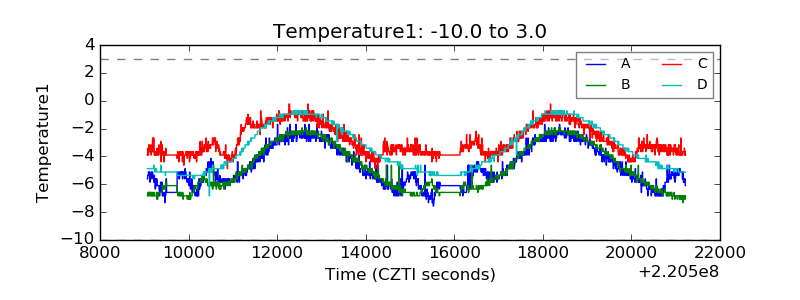 |
| Veto HV Monitor | 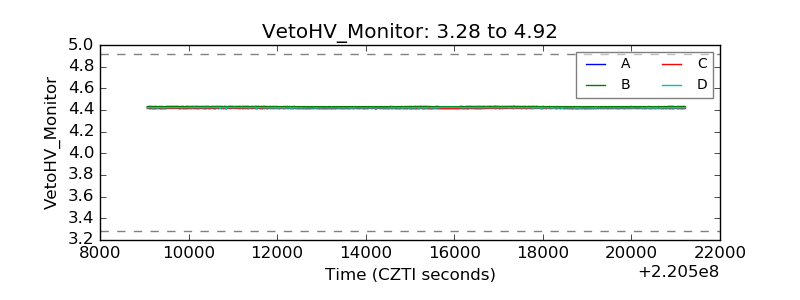 |
| Veto LLD | 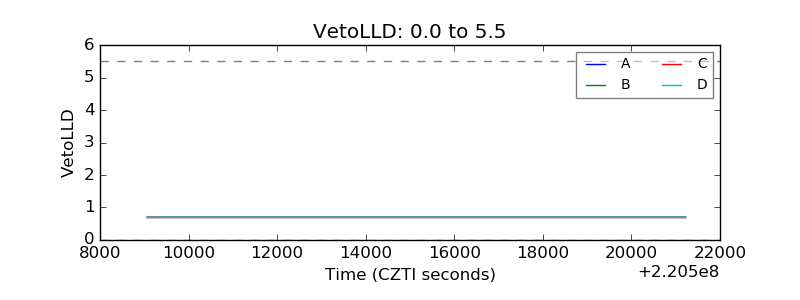 |
| Alpha Counter | 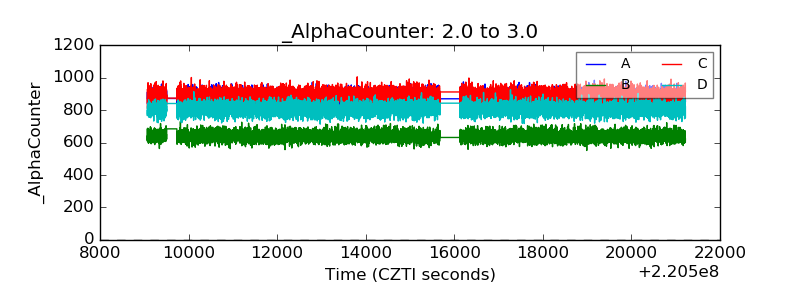 |
| _CPM_Rate | 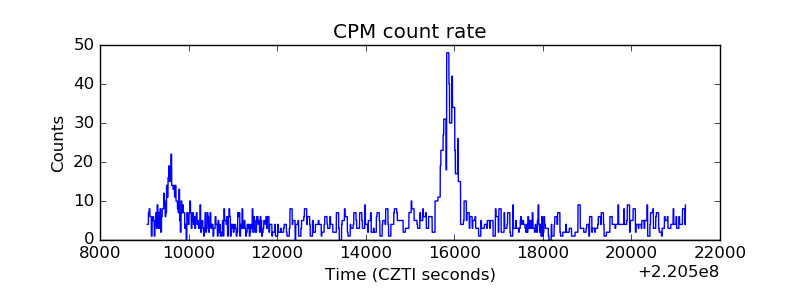 |
| CZT Counter |  |
| +2.5 Volts monitor |  |
| +5 Volts monitor |  |
| _ROLL_ROT | 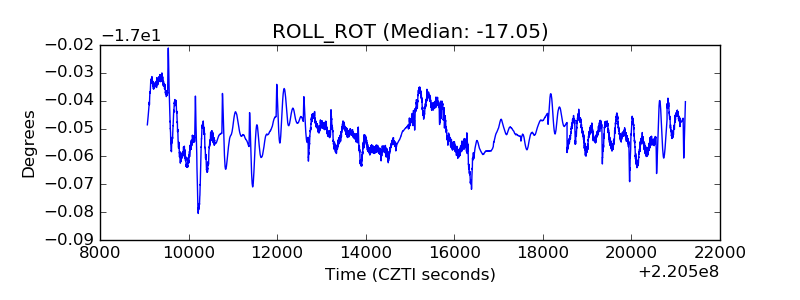 |
| _Roll_DEC | 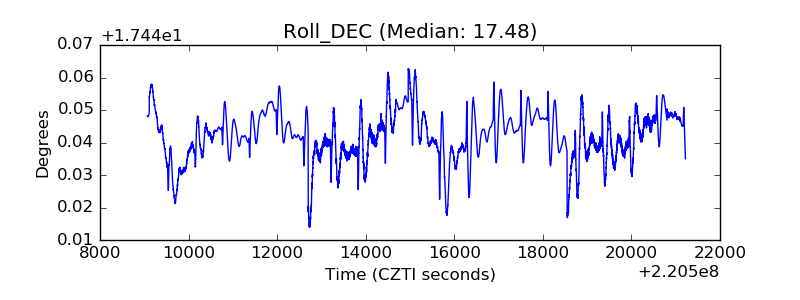 |
| _Roll_RA | 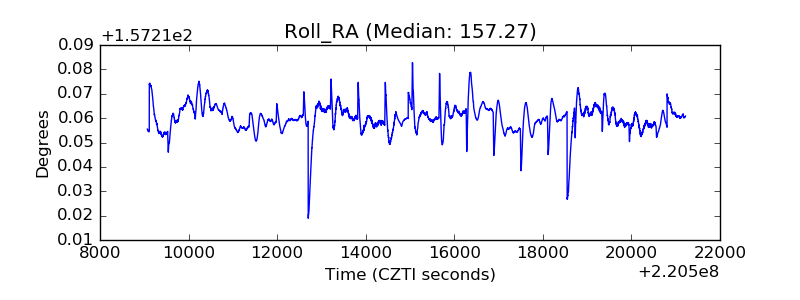 |
| Veto Counter | 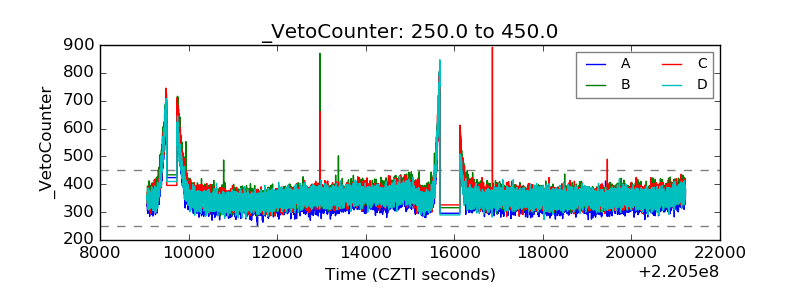 |