| Param | Original file | Final file |
|---|---|---|
| Filename | modeM0/AS1A02_006T01_9000000934cztM0_level2.fits | modeM0/AS1A02_006T01_9000000934cztM0_level2_quad_clean.evt |
| Size (bytes) | 627,851,520 | 617,618,880 |
| Size | 598.8 MB | 589.0 MB |
| Events in quadrant A | 3,781,880 | 3,697,736 |
| Events in quadrant B | 3,665,802 | 3,672,149 |
| Events in quadrant C | 3,718,600 | 3,497,960 |
| Events in quadrant D | 3,098,506 | 3,088,374 |
| Mode M9 | |||
|---|---|---|---|
| Quadrant | BADHDUFLAG | Total packets | Discarded packets |
| A | 0 | 106 | 0 |
| B | 0 | 106 | 0 |
| C | 0 | 106 | 0 |
| D | 0 | 106 | 0 |
| Mode M0 | |||
|---|---|---|---|
| Quadrant | BADHDUFLAG | Total packets | Discarded packets |
| A | 0 | 143999 | 0 |
| B | 0 | 147137 | 0 |
| C | 0 | 141591 | 0 |
| D | 0 | 208947 | 0 |
| Mode SS | |||
|---|---|---|---|
| Quadrant | BADHDUFLAG | Total packets | Discarded packets |
| A | 0 | 1408 | 0 |
| B | 0 | 1408 | 0 |
| C | 0 | 1408 | 0 |
| D | 0 | 1408 | 0 |
| Quadrant | Total seconds | Saturated seconds | Saturation percentage |
|---|---|---|---|
| A | 69246 | 639 | 0.922797% |
| B | 69248 | 1234 | 1.782001% |
| C | 69248 | 441 | 0.636841% |
| D | 69226 | 3720 | 5.373704% |
Noise dominated data is calculated using 1-second bins in cleaned event files. If a bin has >2000 counts, and if more than 50% of those come from <1% of pixels, then it is considered to be noise-dominated and hence unusable.
| Quadrant | # 1 sec bins | Bins with >0 counts | Bins with >2000 counts | High rate bins dominated by noise | Noise dominated (total time) | Noise dominated (detector-on time) | Marked lightcurve |
|---|---|---|---|---|---|---|---|
| A | 79770 | 69255 | 0 | 0 | 0.00% | 0.00% |  |
| B | 79770 | 69256 | 0 | 0 | 0.00% | 0.00% |  |
| C | 79770 | 69254 | 0 | 0 | 0.00% | 0.00% |  |
| D | 79770 | 69215 | 0 | 0 | 0.00% | 0.00% |  |
Top three noisy pixels from each quadrant. If the there are fewer than three noisy pixels in the level2.evt file, extra rows are filled as -1
| Pixel properties | Quadrant properties | ||||||
|---|---|---|---|---|---|---|---|
| Quadrant | DetID | PixID | Counts | Sigma | Mean | Median | Sigma |
| A | 0 | 29 | 3772 | 11.26 | 983 | 914 | 253.8 |
| A | 7 | 110 | 3234 | 9.14 | 983 | 914 | 253.8 |
| A | 0 | 30 | 2971 | 8.11 | 983 | 914 | 253.8 |
| B | 2 | 9 | 3188 | 11.56 | 966 | 916 | 196.5 |
| B | 14 | 254 | 2528 | 8.21 | 966 | 916 | 196.5 |
| B | 12 | 226 | 2506 | 8.09 | 966 | 916 | 196.5 |
| C | 1 | 80 | 2773 | 7.26 | 981 | 904 | 257.5 |
| C | 1 | 81 | 2759 | 7.2 | 981 | 904 | 257.5 |
| C | 1 | 65 | 2552 | 6.4 | 981 | 904 | 257.5 |
| D | 11 | 82 | 2298 | 6.29 | 885 | 805 | 237.2 |
| D | 7 | 5 | 2259 | 6.13 | 885 | 805 | 237.2 |
| D | 6 | 231 | 2236 | 6.03 | 885 | 805 | 237.2 |
Histogram calculated using DETX and DETY for each event in the final _common_clean file
| Quadrant A |  |
 |
Quadrant B |
|---|---|---|---|
| Quadrant D | 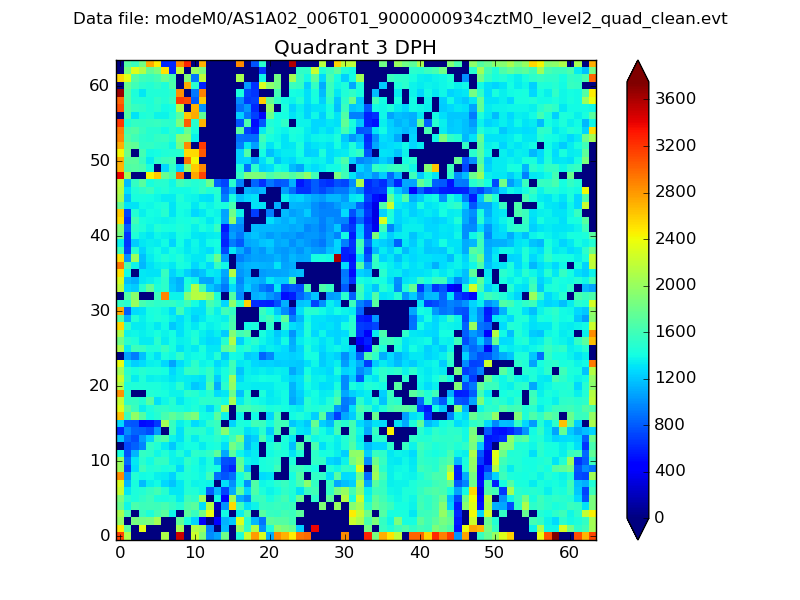 |
 |
Quadrant C |
| Plot type | Count rate plots | Images |
|---|---|---|
| Comparison with Poisson distribution Blue bars denote a histogram of data divided into 1 sec bins. Red curve is a Poisson curve with rate = median count rate of data. |
 |
 |
| Quadrant-wise count rates Data is divided into 100 sec bins |
 |
|
| Module-wise count rates for Quadrant A Data is divided into 100 sec bins |
 |
 |
| Module-wise count rates for Quadrant B Data is divided into 100 sec bins |
 |
 |
| Module-wise count rates for Quadrant C Data is divided into 100 sec bins |
 |
 |
| Module-wise count rates for Quadrant D Data is divided into 100 sec bins |
 |
 |
| Parameter | Plot |
|---|---|
| CZT HV Monitor |  |
| D_VDD |  |
| Temperature 1 |  |
| Veto HV Monitor |  |
| Veto LLD |  |
| Alpha Counter |  |
| _CPM_Rate |  |
| CZT Counter |  |
| +2.5 Volts monitor |  |
| +5 Volts monitor |  |
| _ROLL_ROT |  |
| _Roll_DEC |  |
| _Roll_RA |  |
| Veto Counter |  |