| Param | Original file | Final file |
|---|---|---|
| Filename | modeM0/AS1A02_006T01_9000000934_06753cztM0_level2.evt | modeM0/AS1A02_006T01_9000000934_06753cztM0_level2_quad_clean.evt |
| Size (bytes) | 485,357,760 | 80,942,400 |
| Size | 462.9 MB | 77.2 MB |
| Events in quadrant A | 3,254,442 | 494,776 |
| Events in quadrant B | 4,450,811 | 490,271 |
| Events in quadrant C | 3,107,045 | 495,748 |
| Events in quadrant D | 3,409,277 | 480,829 |
| Mode M9 | |||
|---|---|---|---|
| Quadrant | BADHDUFLAG | Total packets | Discarded packets |
| A | 0 | 8 | 0 |
| B | 0 | 8 | 0 |
| C | 0 | 8 | 0 |
| D | 0 | 8 | 0 |
| Mode M0 | |||
|---|---|---|---|
| Quadrant | BADHDUFLAG | Total packets | Discarded packets |
| A | 0 | 14496 | 3 |
| B | 0 | 18007 | 2 |
| C | 0 | 14248 | 2 |
| D | 0 | 14621 | 4 |
| Mode SS | |||
|---|---|---|---|
| Quadrant | BADHDUFLAG | Total packets | Discarded packets |
| A | 0 | 144 | 0 |
| B | 0 | 144 | 0 |
| C | 0 | 144 | 0 |
| D | 0 | 144 | 0 |
| Quadrant | Total seconds | Saturated seconds | Saturation percentage |
|---|---|---|---|
| A | 7021 | 70 | 0.997009% |
| B | 7021 | 616 | 8.773679% |
| C | 7021 | 51 | 0.726392% |
| D | 7020 | 56 | 0.797721% |
Noise dominated data is calculated using 1-second bins in cleaned event files. If a bin has >2000 counts, and if more than 50% of those come from <1% of pixels, then it is considered to be noise-dominated and hence unusable.
| Quadrant | # 1 sec bins | Bins with >0 counts | Bins with >2000 counts | High rate bins dominated by noise | Noise dominated (total time) | Noise dominated (detector-on time) | Marked lightcurve |
|---|---|---|---|---|---|---|---|
| A | 7811 | 7022 | 4 | 4 | 0.05% | 0.06% | 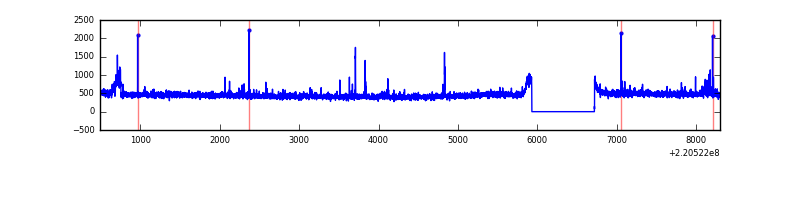 |
| B | 7811 | 7022 | 305 | 305 | 3.90% | 4.34% | 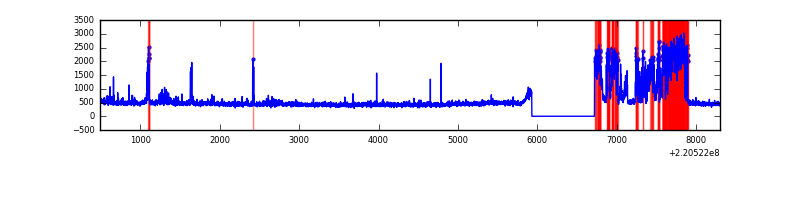 |
| C | 7811 | 7022 | 0 | 0 | 0.00% | 0.00% | 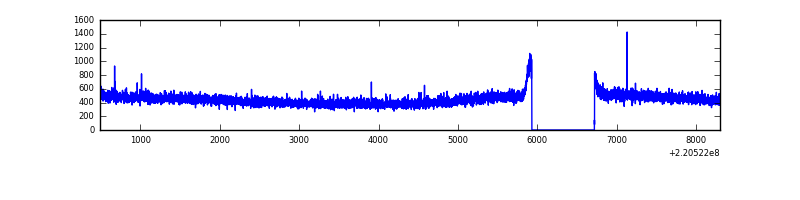 |
| D | 7811 | 7022 | 3 | 3 | 0.04% | 0.04% | 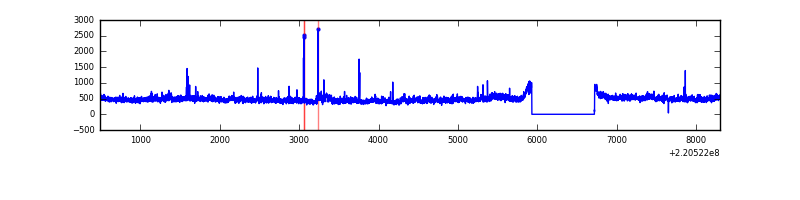 |
Top three noisy pixels from each quadrant. If the there are fewer than three noisy pixels in the level2.evt file, extra rows are filled as -1
| Pixel properties | Quadrant properties | ||||||
|---|---|---|---|---|---|---|---|
| Quadrant | DetID | PixID | Counts | Sigma | Mean | Median | Sigma |
| A | 13 | 251 | 57967 | 344.48 | 812 | 794 | 166.0 |
| A | 8 | 15 | 29460 | 172.72 | 812 | 794 | 166.0 |
| A | 13 | 248 | 25939 | 151.5 | 812 | 794 | 166.0 |
| B | 3 | 220 | 1265107 | 8277.93 | 790 | 768 | 152.7 |
| B | 4 | 81 | 76144 | 493.5 | 790 | 768 | 152.7 |
| B | 0 | 214 | 24270 | 153.87 | 790 | 768 | 152.7 |
| C | 13 | 61 | 6115 | 28.69 | 792 | 796 | 185.4 |
| C | 9 | 247 | 6005 | 28.09 | 792 | 796 | 185.4 |
| C | 12 | 16 | 4738 | 21.26 | 792 | 796 | 185.4 |
| D | 8 | 195 | 315023 | 1607.32 | 793 | 767 | 195.5 |
| D | 2 | 152 | 30919 | 154.22 | 793 | 767 | 195.5 |
| D | 2 | 16 | 25058 | 124.24 | 793 | 767 | 195.5 |
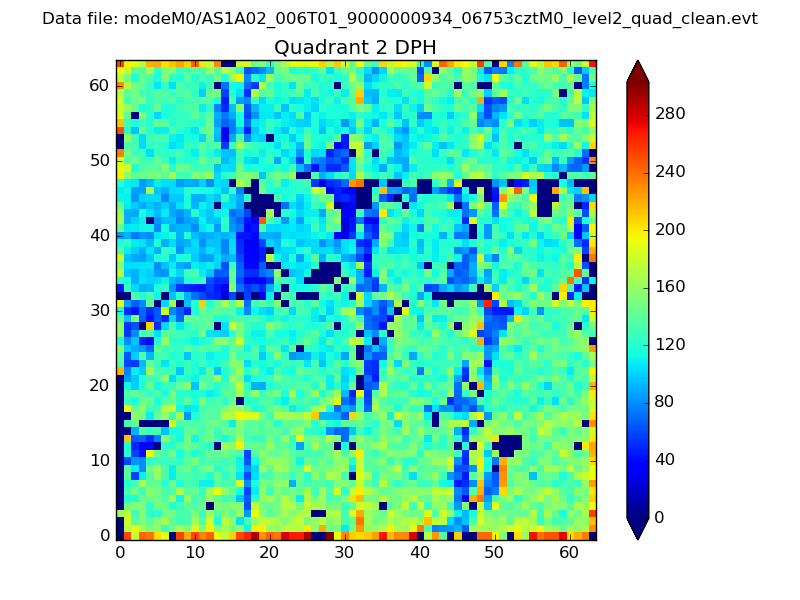
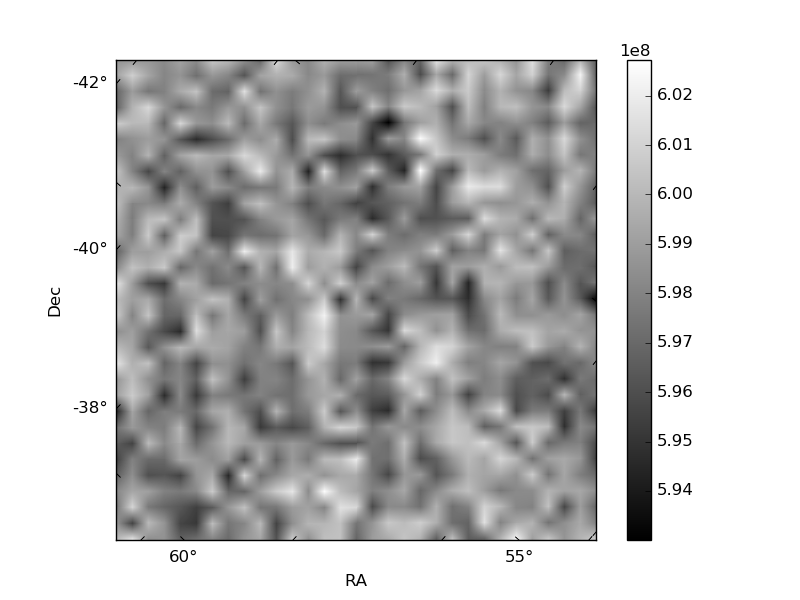
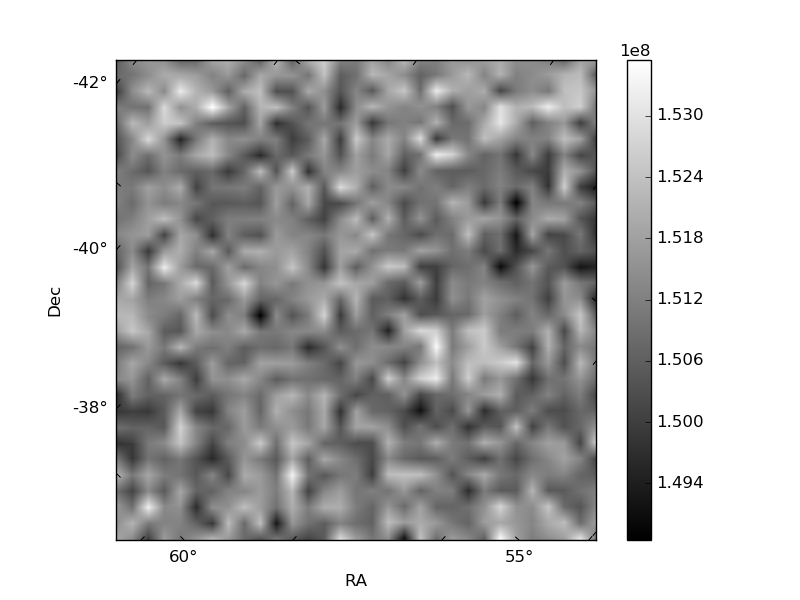
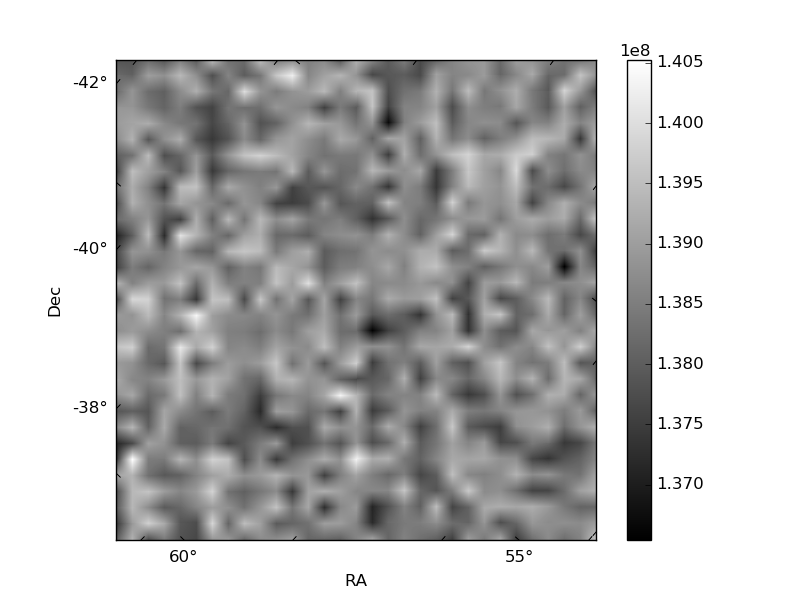
Histogram calculated using DETX and DETY for each event in the final _common_clean file
| Quadrant A | 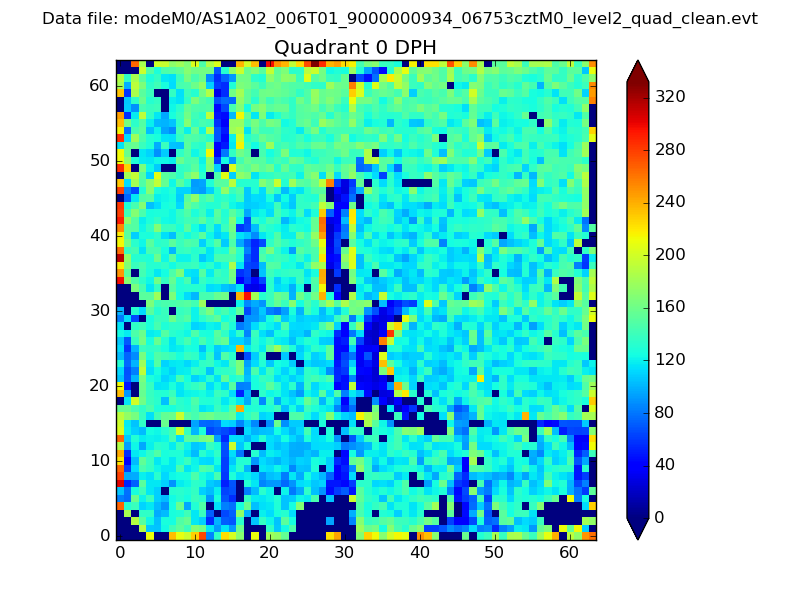 |
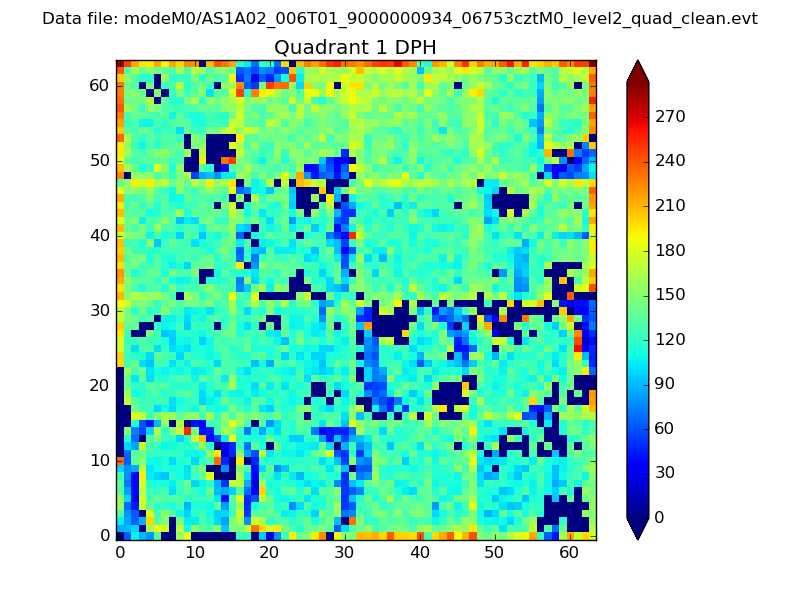 |
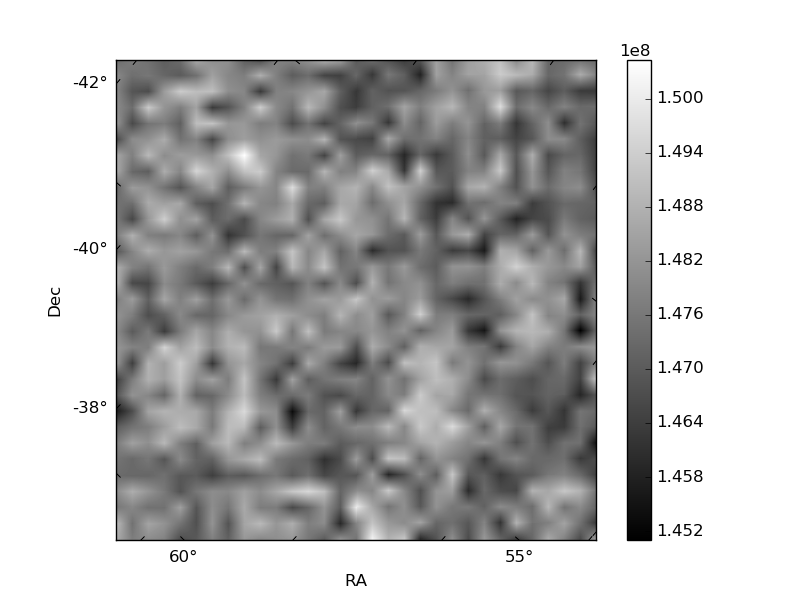
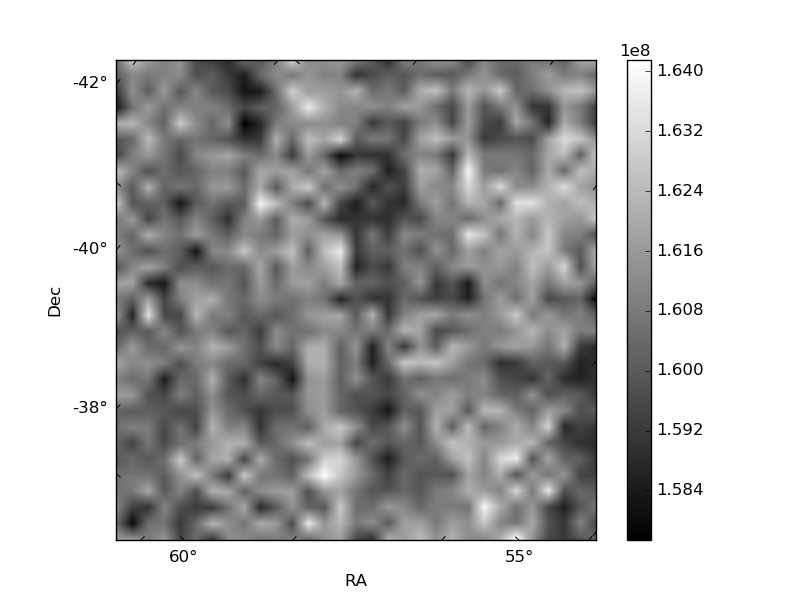
Quadrant B |
|---|---|---|---|
| Quadrant D | 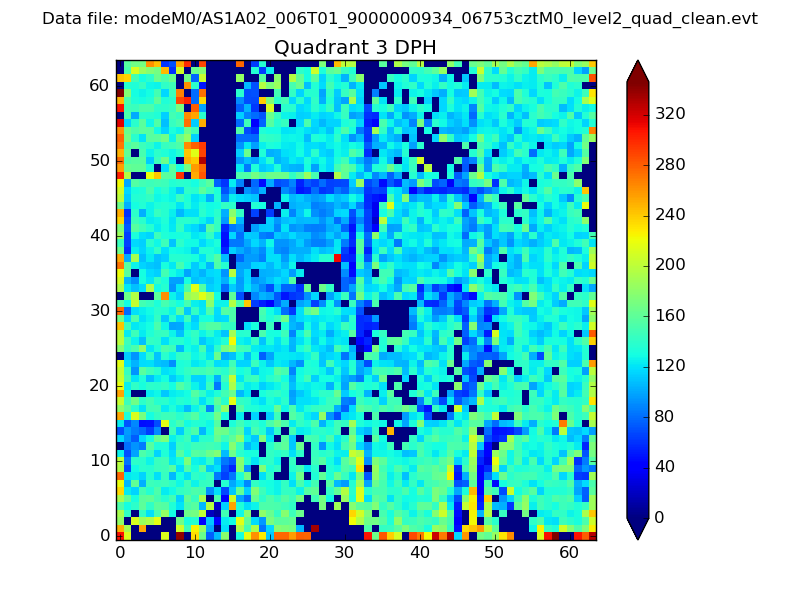 |
 |
Quadrant C |
| Plot type | Count rate plots | Images |
|---|---|---|
| Comparison with Poisson distribution Blue bars denote a histogram of data divided into 1 sec bins. Red curve is a Poisson curve with rate = median count rate of data. |
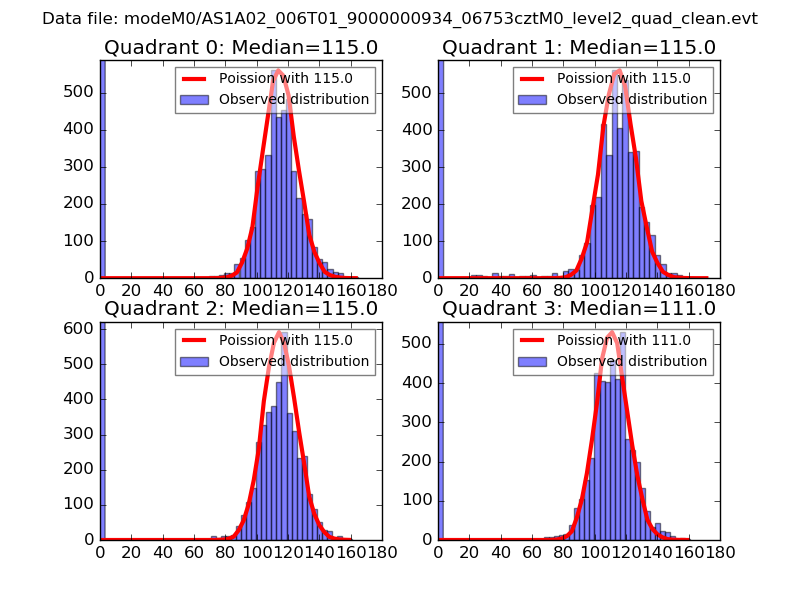 |
 |
| Quadrant-wise count rates Data is divided into 100 sec bins |
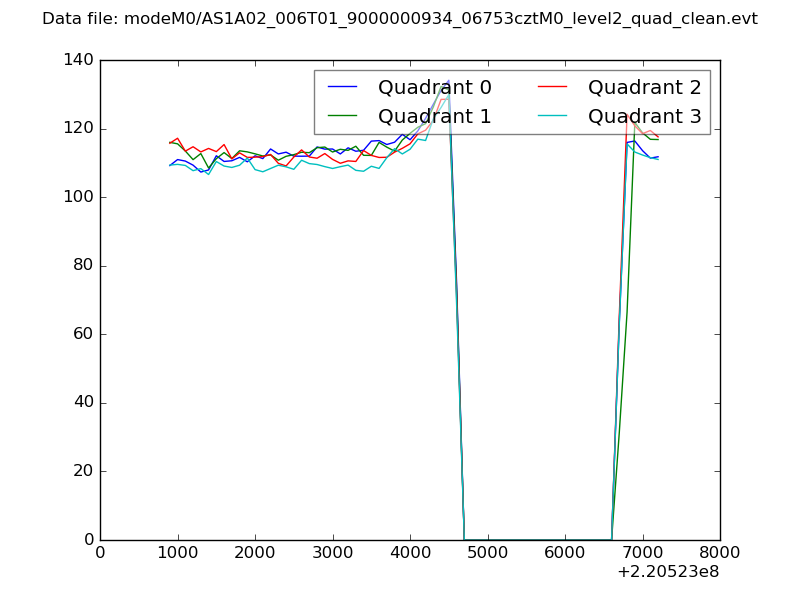 |
|
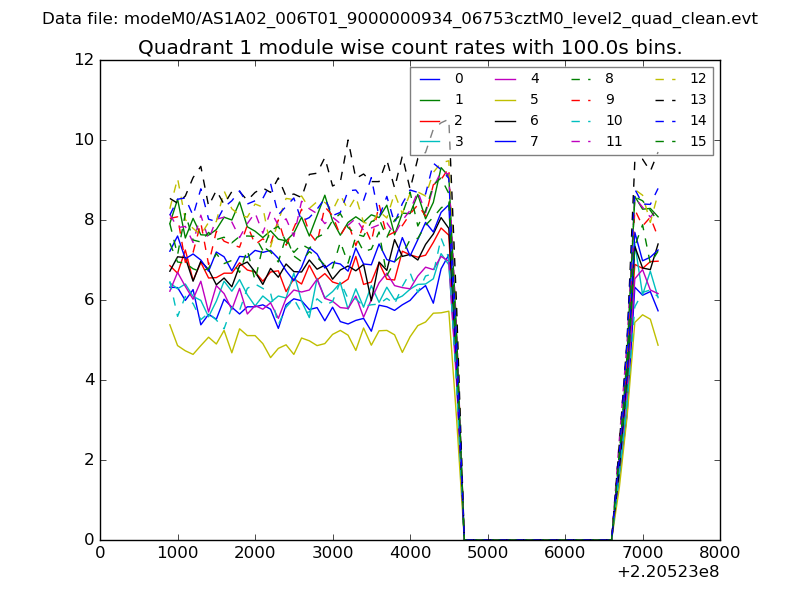
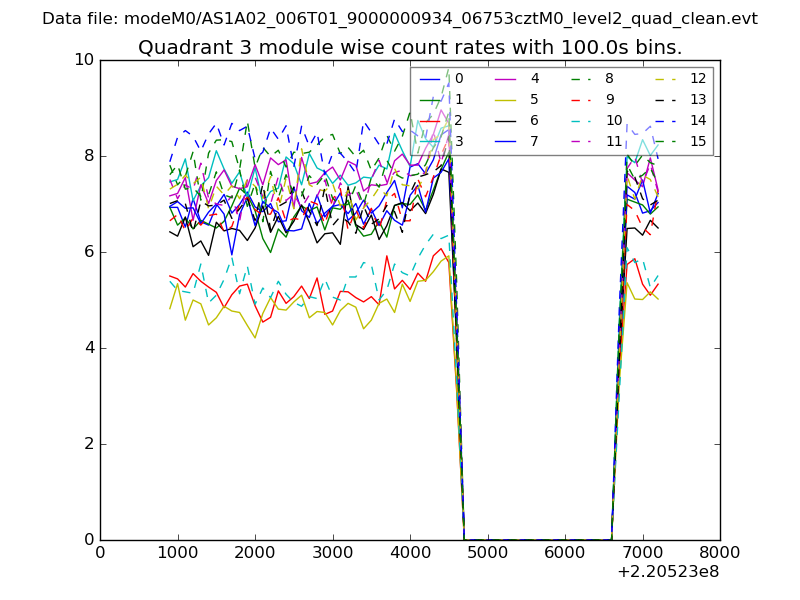
| Module-wise count rates for Quadrant A Data is divided into 100 sec bins |
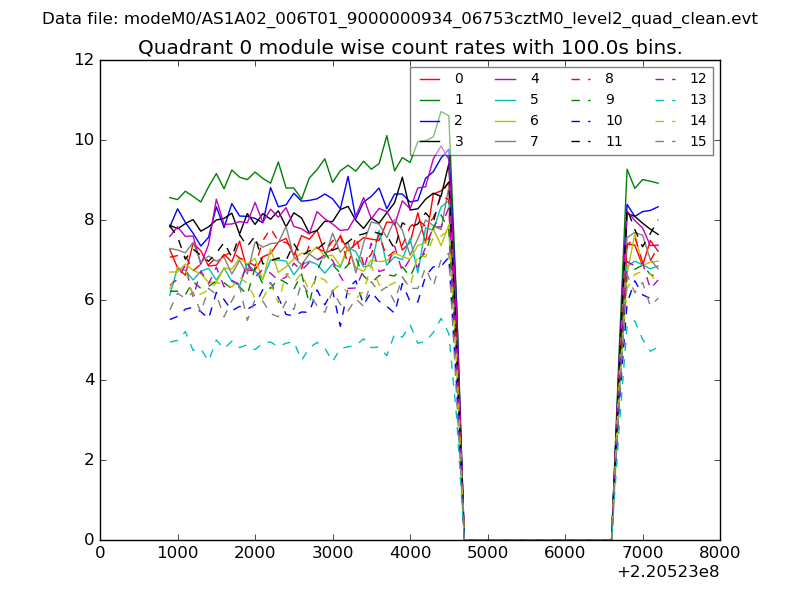 |
 |
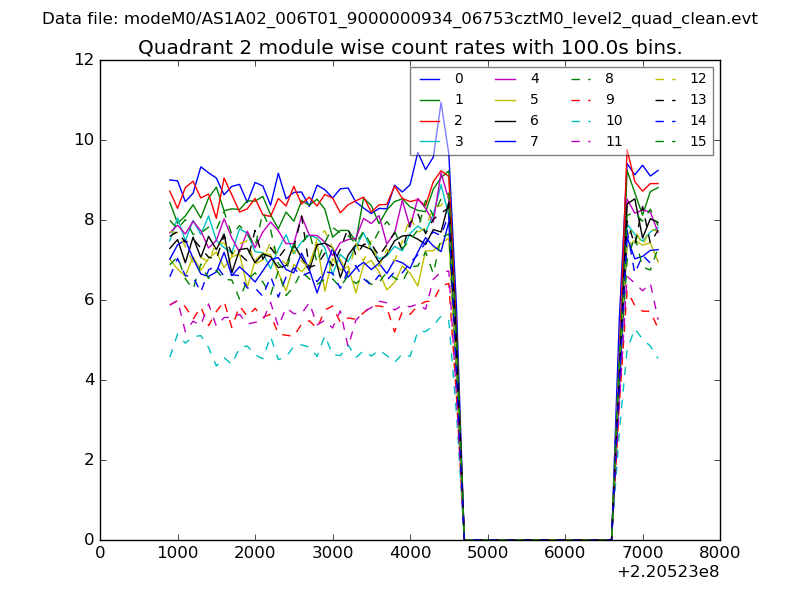
| Module-wise count rates for Quadrant B Data is divided into 100 sec bins |
 |
 |
| Module-wise count rates for Quadrant C Data is divided into 100 sec bins |
 |
 |
| Module-wise count rates for Quadrant D Data is divided into 100 sec bins |
 |
 |
| Parameter | Plot |
|---|---|
| CZT HV Monitor | 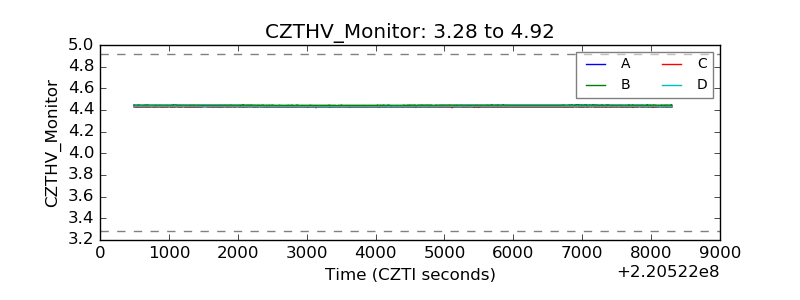 |
| D_VDD | 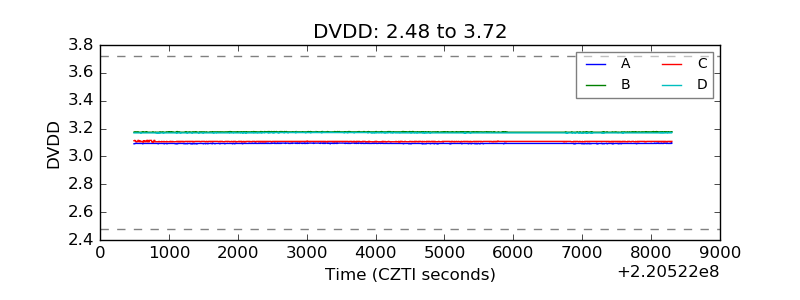 |
| Temperature 1 | 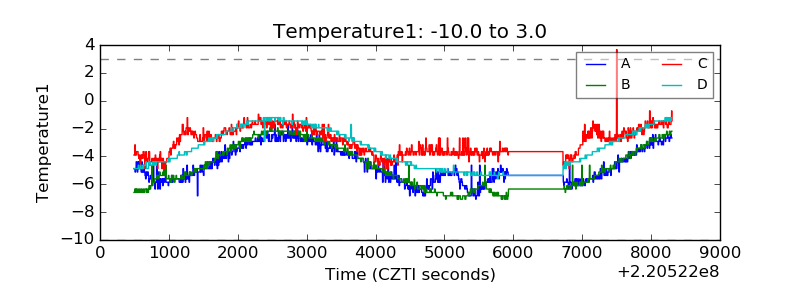 |
| Veto HV Monitor | 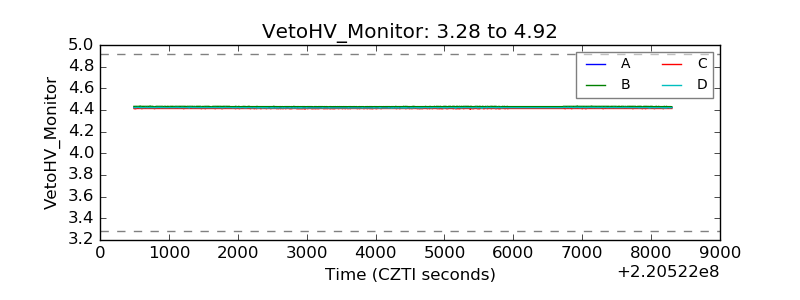 |
| Veto LLD | 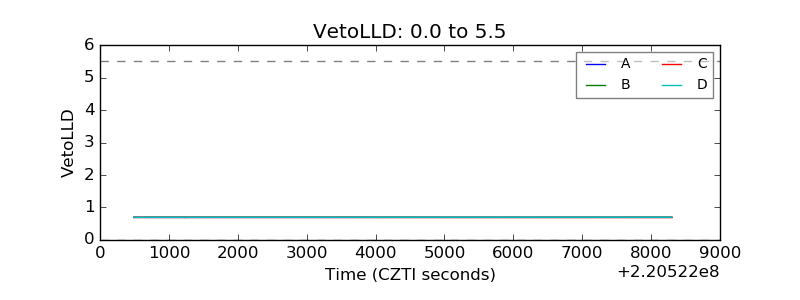 |
| Alpha Counter | 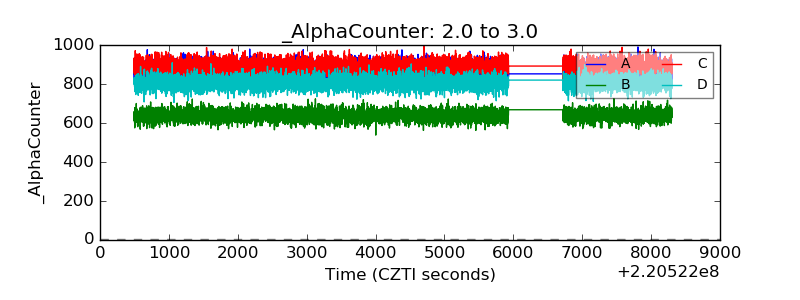 |
| _CPM_Rate | 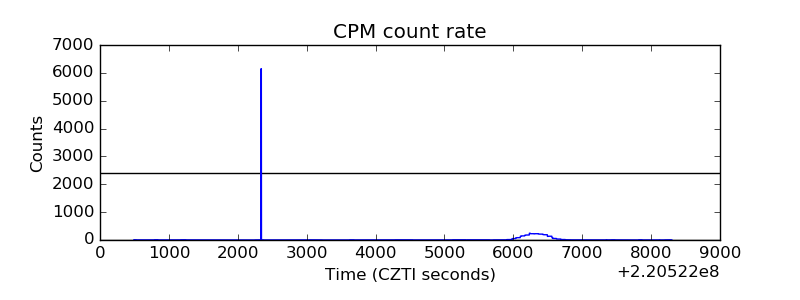 |
| CZT Counter | 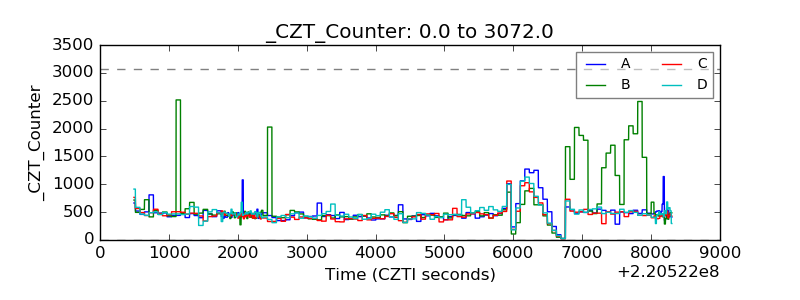 |
| +2.5 Volts monitor |  |
| +5 Volts monitor |  |
| _ROLL_ROT | 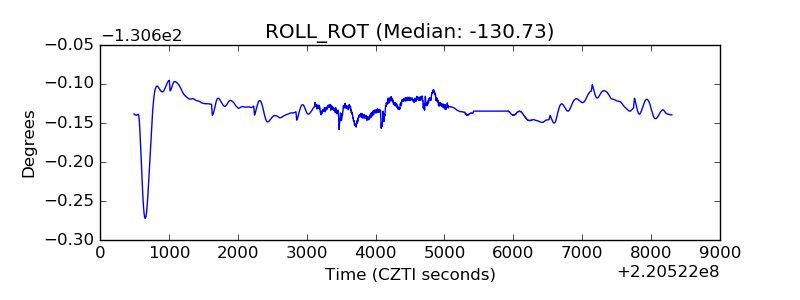 |
| _Roll_DEC | 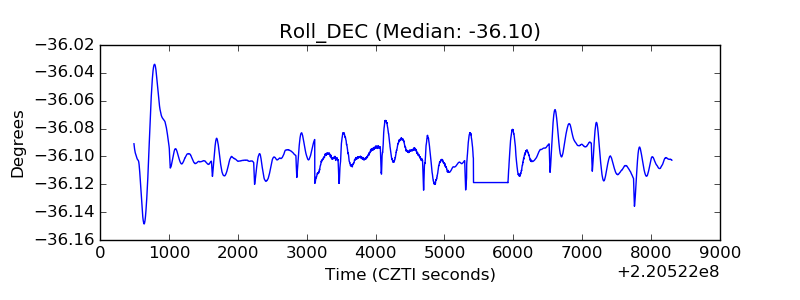 |
| _Roll_RA | 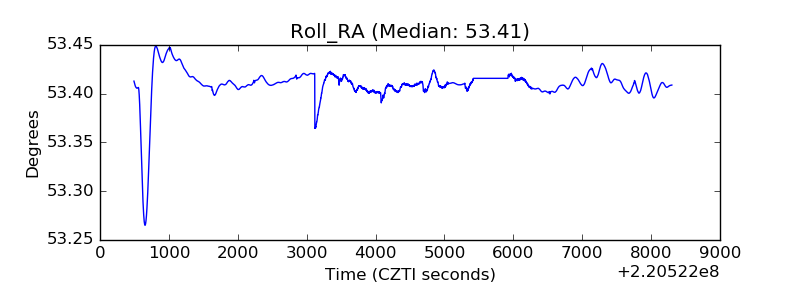 |
| Veto Counter | 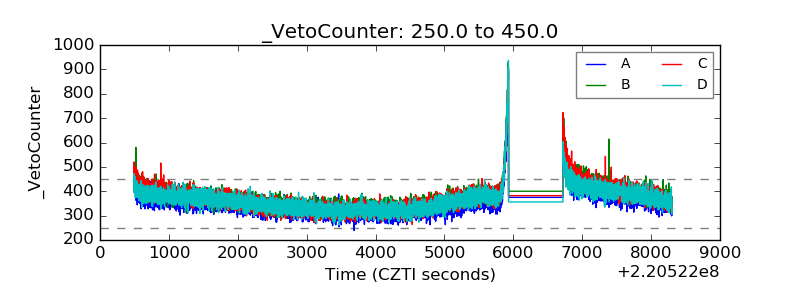 |