| Param | Original file | Final file |
|---|---|---|
| Filename | modeM0/AS1A02_006T01_9000000934_06754cztM0_level2.evt | modeM0/AS1A02_006T01_9000000934_06754cztM0_level2_quad_clean.evt |
| Size (bytes) | 509,342,400 | 86,716,800 |
| Size | 485.7 MB | 82.7 MB |
| Events in quadrant A | 3,355,071 | 543,398 |
| Events in quadrant B | 4,300,458 | 540,960 |
| Events in quadrant C | 3,072,526 | 544,493 |
| Events in quadrant D | 4,232,771 | 520,312 |
| Mode M9 | |||
|---|---|---|---|
| Quadrant | BADHDUFLAG | Total packets | Discarded packets |
| A | 0 | 18 | 0 |
| B | 0 | 18 | 0 |
| C | 0 | 18 | 0 |
| D | 0 | 18 | 0 |
| Mode M0 | |||
|---|---|---|---|
| Quadrant | BADHDUFLAG | Total packets | Discarded packets |
| A | 0 | 14510 | 3 |
| B | 0 | 17491 | 2 |
| C | 0 | 13986 | 2 |
| D | 0 | 17296 | 2 |
| Mode SS | |||
|---|---|---|---|
| Quadrant | BADHDUFLAG | Total packets | Discarded packets |
| A | 0 | 140 | 0 |
| B | 0 | 140 | 0 |
| C | 0 | 140 | 0 |
| D | 0 | 140 | 0 |
| Quadrant | Total seconds | Saturated seconds | Saturation percentage |
|---|---|---|---|
| A | 6846 | 88 | 1.285422% |
| B | 6846 | 609 | 8.895706% |
| C | 6846 | 60 | 0.876424% |
| D | 6846 | 72 | 1.051709% |
Noise dominated data is calculated using 1-second bins in cleaned event files. If a bin has >2000 counts, and if more than 50% of those come from <1% of pixels, then it is considered to be noise-dominated and hence unusable.
| Quadrant | # 1 sec bins | Bins with >0 counts | Bins with >2000 counts | High rate bins dominated by noise | Noise dominated (total time) | Noise dominated (detector-on time) | Marked lightcurve |
|---|---|---|---|---|---|---|---|
| A | 8591 | 6848 | 11 | 11 | 0.13% | 0.16% | 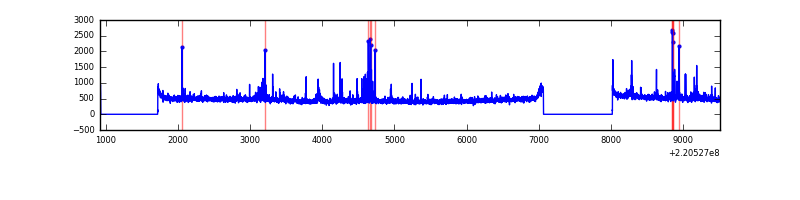 |
| B | 8591 | 6848 | 300 | 300 | 3.49% | 4.38% | 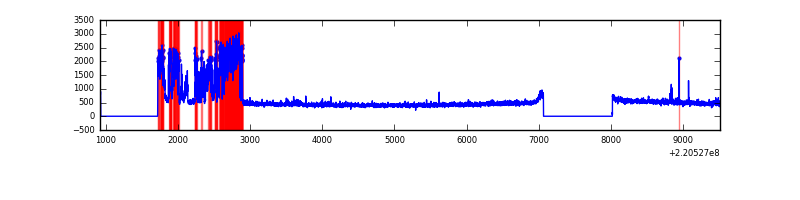 |
| C | 8591 | 6848 | 0 | 0 | 0.00% | 0.00% | 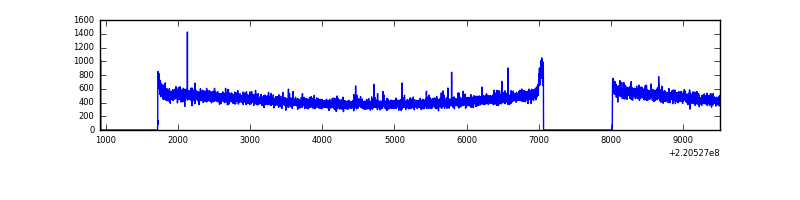 |
| D | 8591 | 6848 | 9 | 9 | 0.10% | 0.13% | 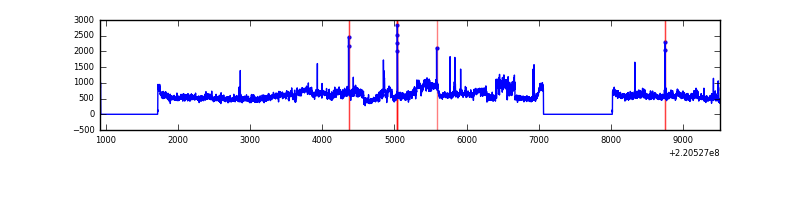 |
Top three noisy pixels from each quadrant. If the there are fewer than three noisy pixels in the level2.evt file, extra rows are filled as -1
| Pixel properties | Quadrant properties | ||||||
|---|---|---|---|---|---|---|---|
| Quadrant | DetID | PixID | Counts | Sigma | Mean | Median | Sigma |
| A | 4 | 2 | 73427 | 437.87 | 808 | 790 | 165.9 |
| A | 13 | 248 | 63519 | 378.14 | 808 | 790 | 165.9 |
| A | 13 | 251 | 47076 | 279.02 | 808 | 790 | 165.9 |
| B | 3 | 220 | 1223096 | 7999.18 | 787 | 769 | 152.8 |
| B | 12 | 111 | 15414 | 95.84 | 787 | 769 | 152.8 |
| B | 0 | 214 | 14853 | 92.17 | 787 | 769 | 152.8 |
| C | 13 | 61 | 6188 | 29.48 | 784 | 786 | 183.2 |
| C | 12 | 16 | 5625 | 26.41 | 784 | 786 | 183.2 |
| C | 9 | 247 | 3867 | 16.81 | 784 | 786 | 183.2 |
| D | 2 | 16 | 832778 | 4318.29 | 786 | 758 | 192.7 |
| D | 8 | 195 | 345995 | 1791.83 | 786 | 758 | 192.7 |
| D | 2 | 14 | 32175 | 163.06 | 786 | 758 | 192.7 |
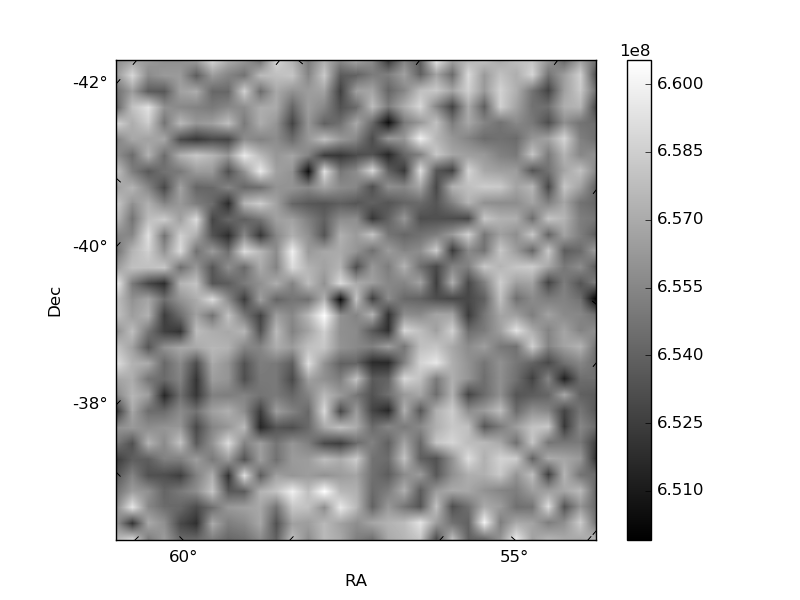
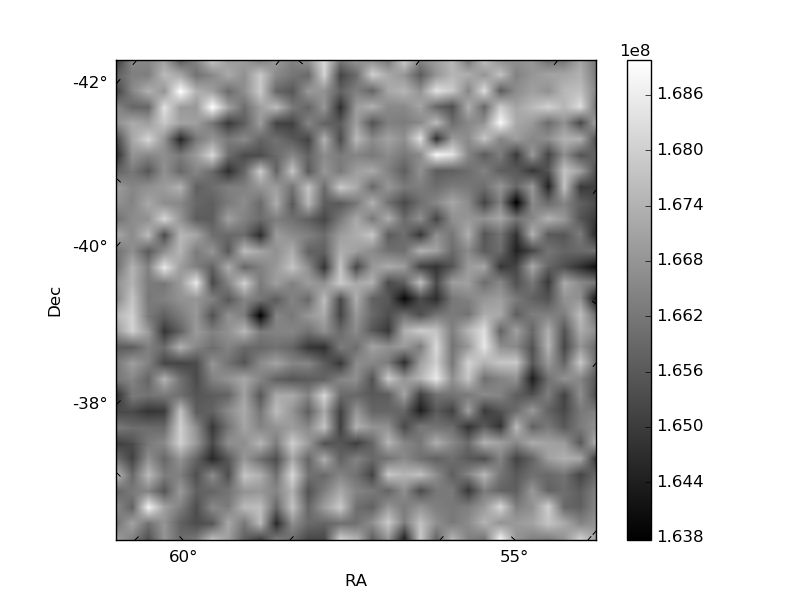
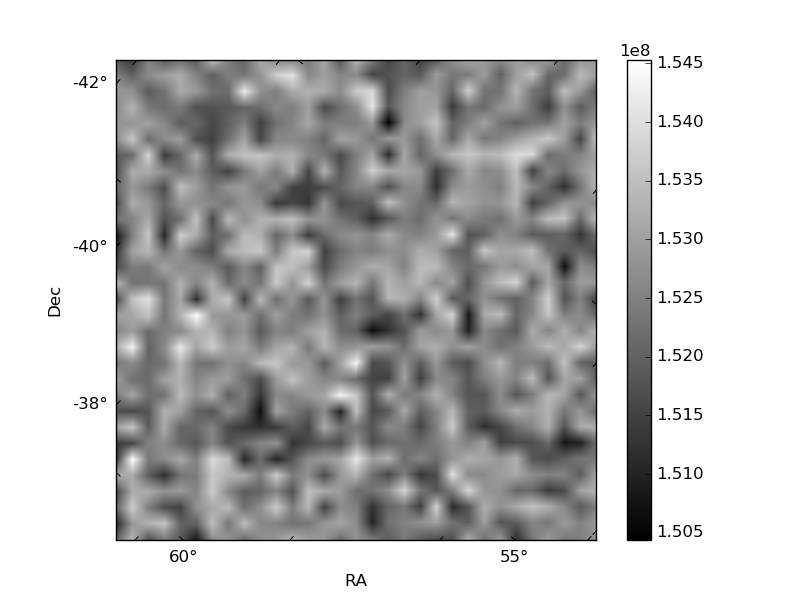
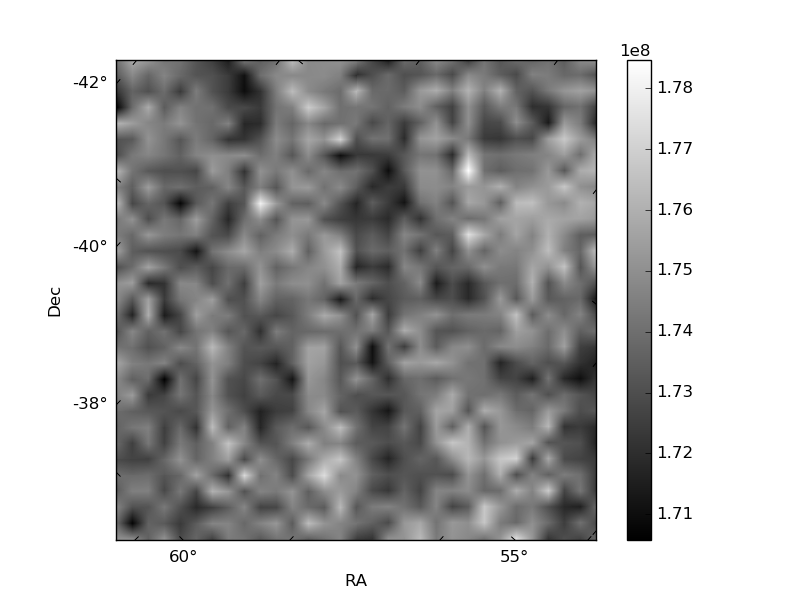
Histogram calculated using DETX and DETY for each event in the final _common_clean file
| Quadrant A | 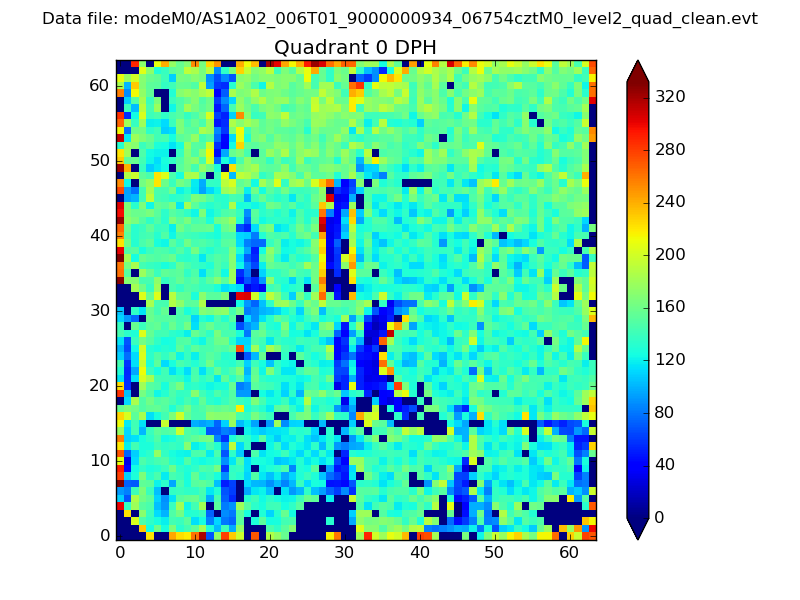 |
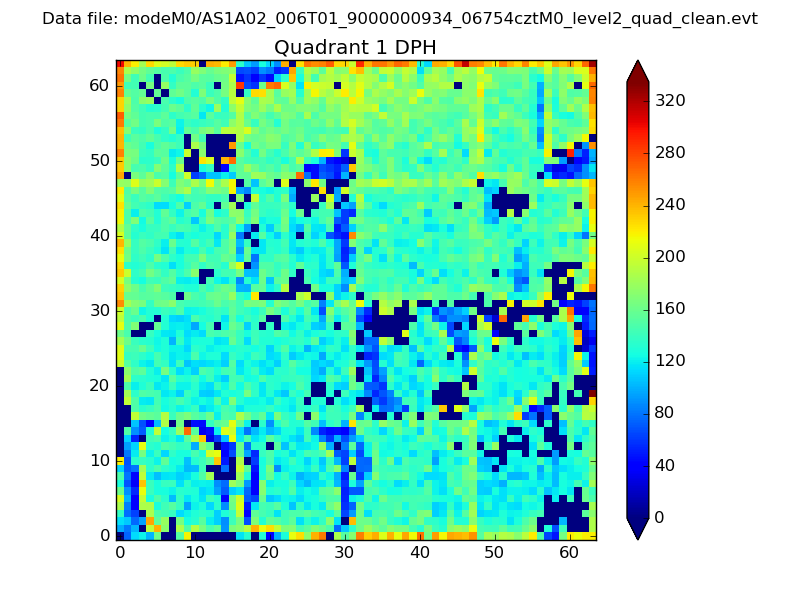 |
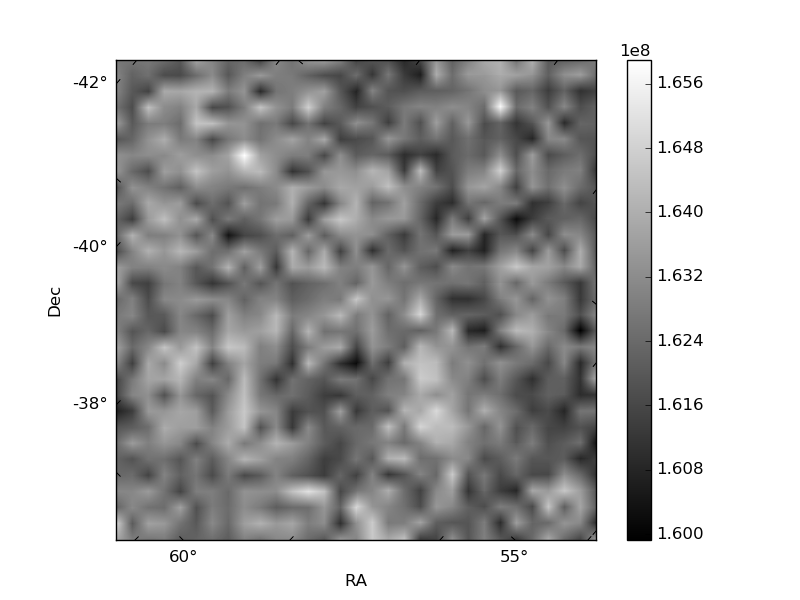
Quadrant B |
|---|---|---|---|
| Quadrant D | 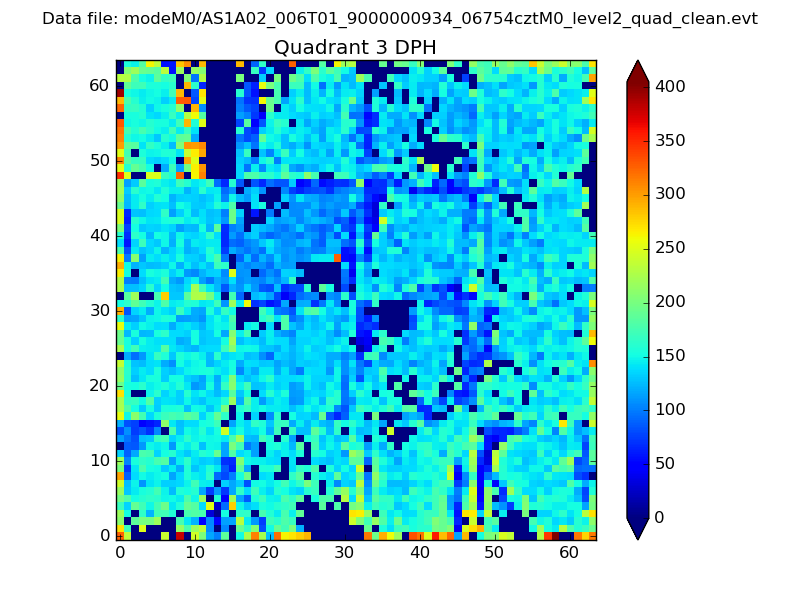 |
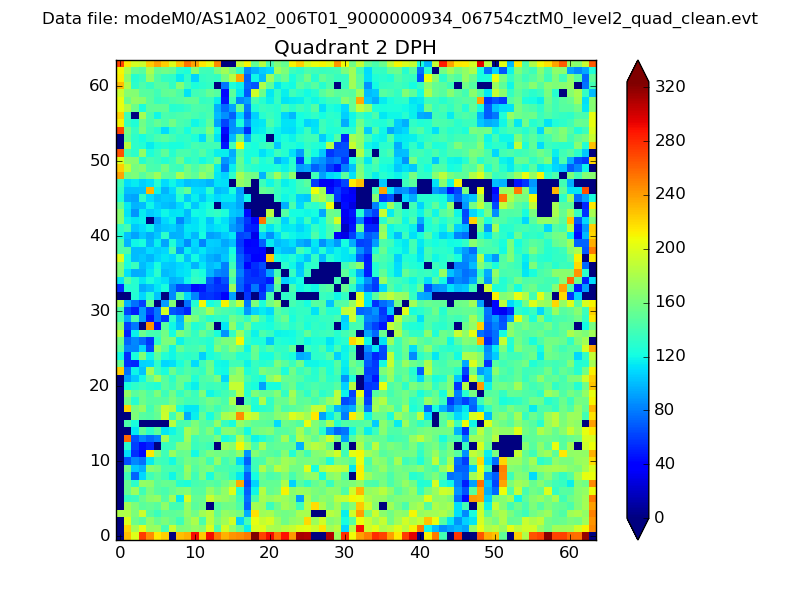 |
Quadrant C |
| Plot type | Count rate plots | Images |
|---|---|---|
| Comparison with Poisson distribution Blue bars denote a histogram of data divided into 1 sec bins. Red curve is a Poisson curve with rate = median count rate of data. |
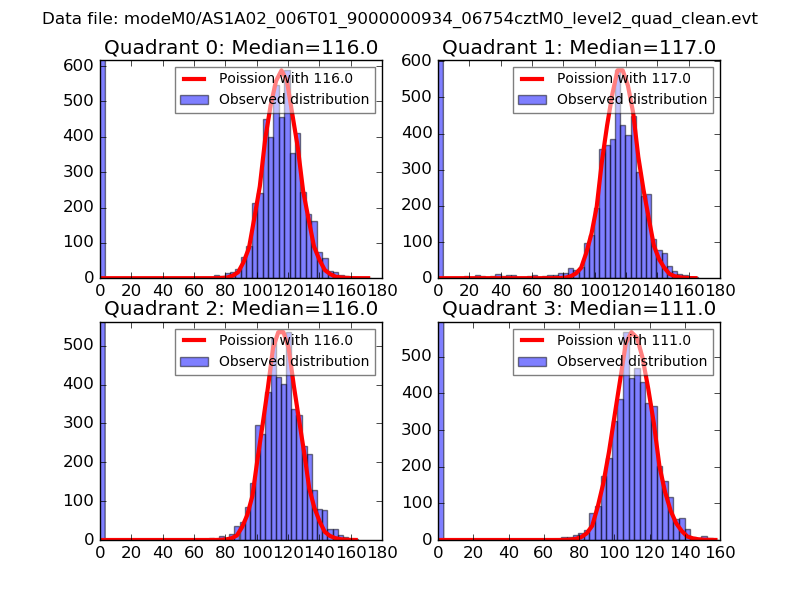 |
 |
| Quadrant-wise count rates Data is divided into 100 sec bins |
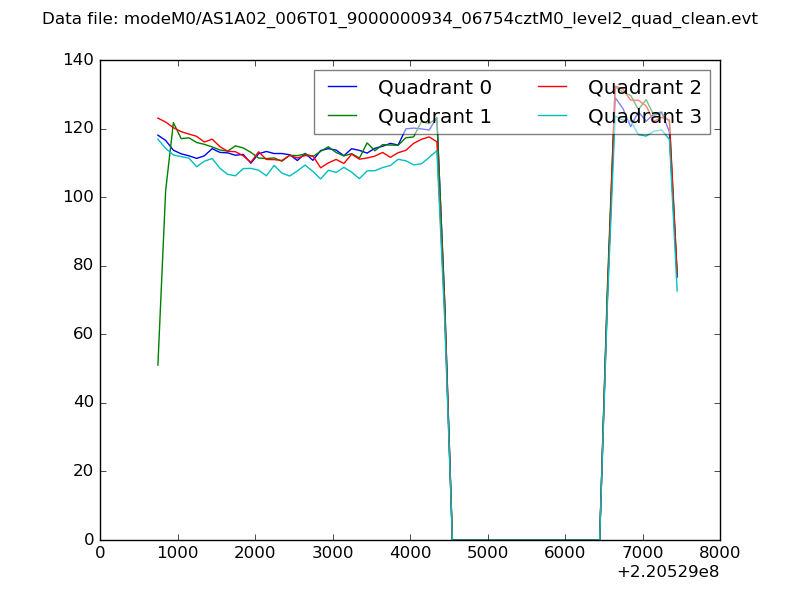 |
|
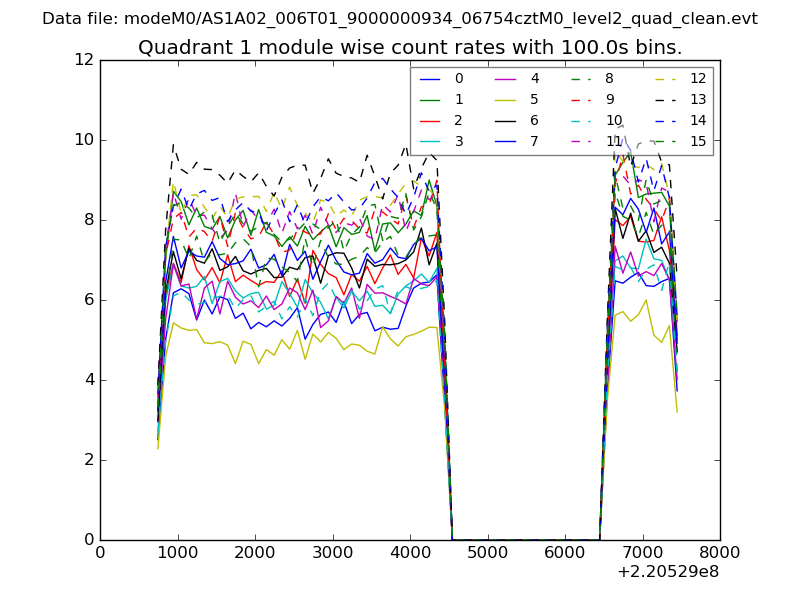
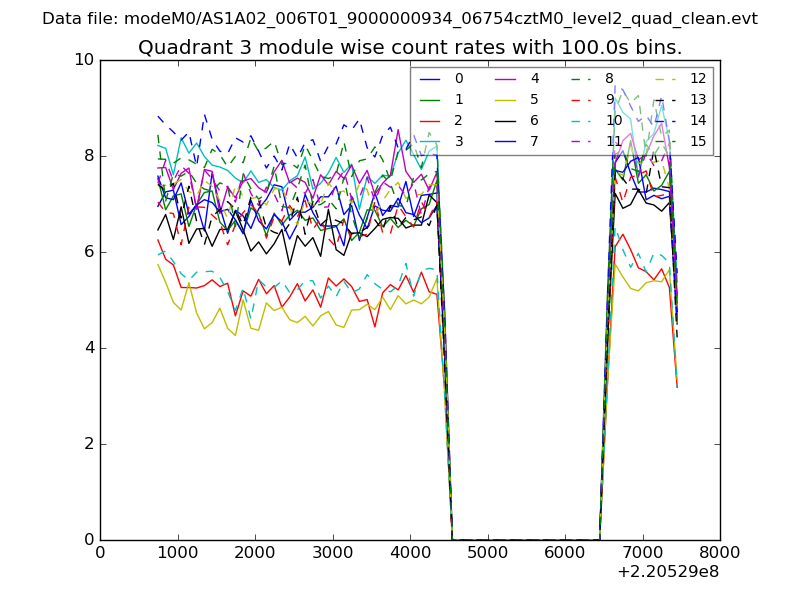
| Module-wise count rates for Quadrant A Data is divided into 100 sec bins |
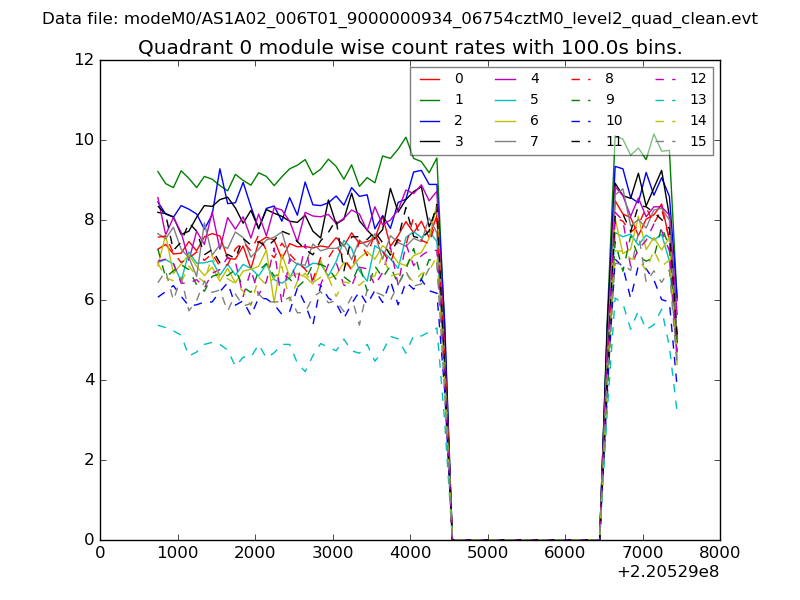 |
 |
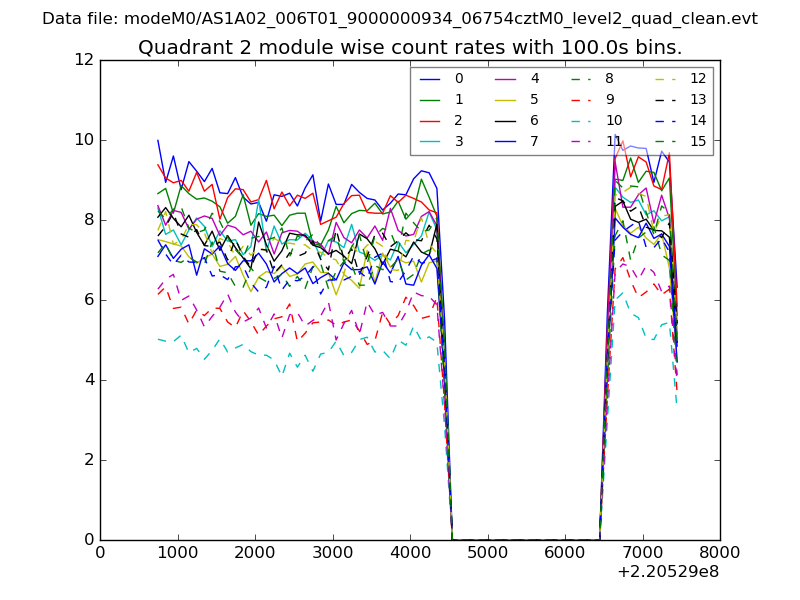
| Module-wise count rates for Quadrant B Data is divided into 100 sec bins |
 |
 |
| Module-wise count rates for Quadrant C Data is divided into 100 sec bins |
 |
 |
| Module-wise count rates for Quadrant D Data is divided into 100 sec bins |
 |
 |
| Parameter | Plot |
|---|---|
| CZT HV Monitor | 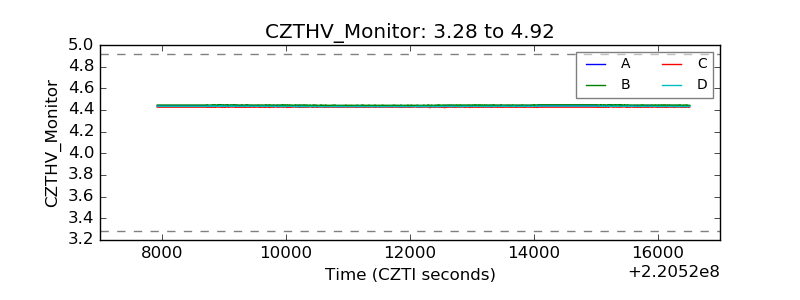 |
| D_VDD | 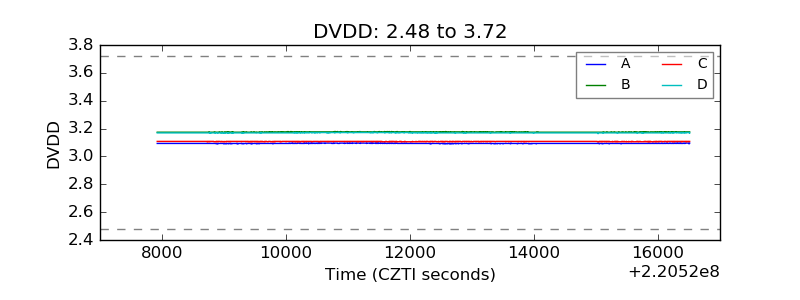 |
| Temperature 1 | 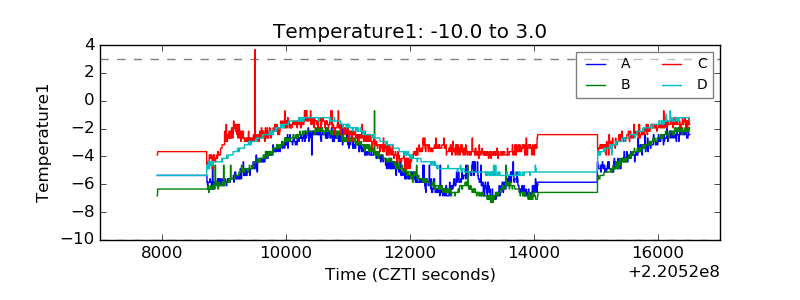 |
| Veto HV Monitor | 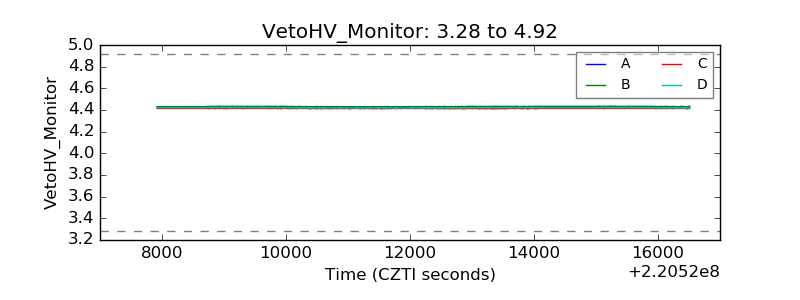 |
| Veto LLD |  |
| Alpha Counter | 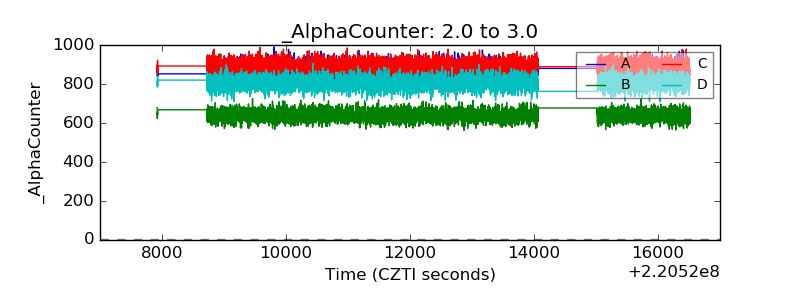 |
| _CPM_Rate | 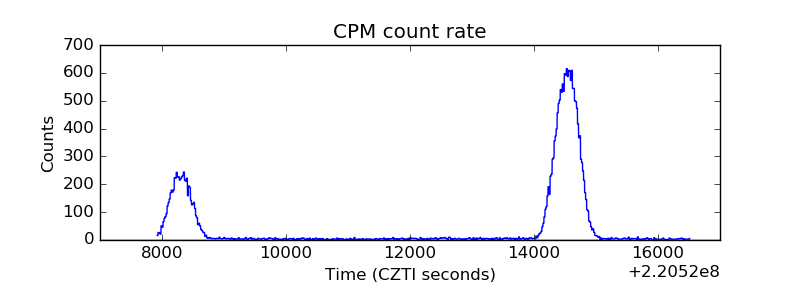 |
| CZT Counter | 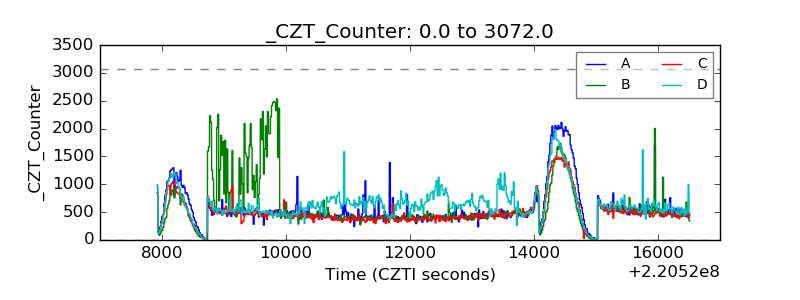 |
| +2.5 Volts monitor |  |
| +5 Volts monitor |  |
| _ROLL_ROT |  |
| _Roll_DEC | 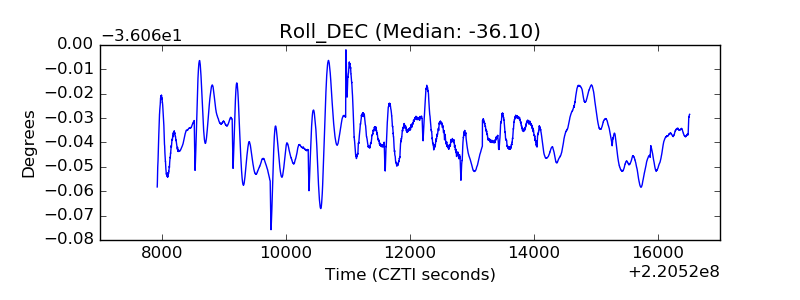 |
| _Roll_RA | 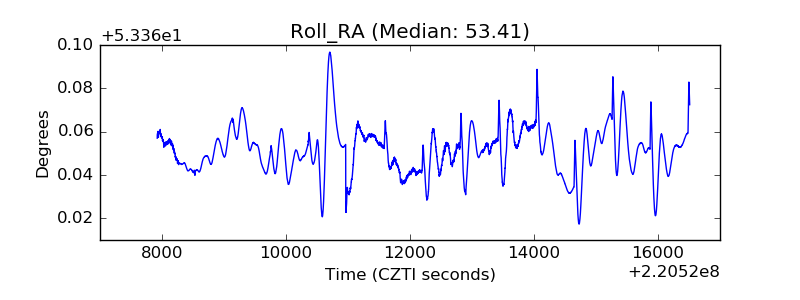 |
| Veto Counter | 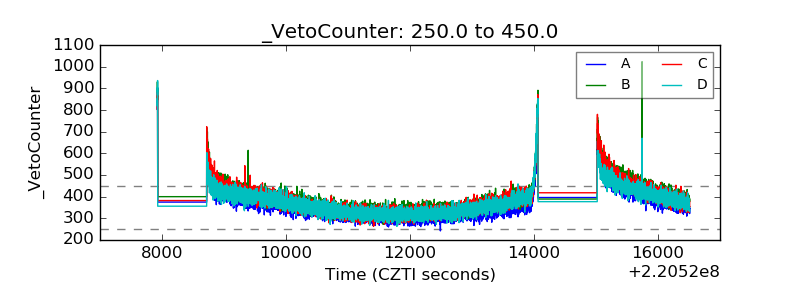 |