| Param | Original file | Final file |
|---|---|---|
| Filename | modeM0/AS1A02_006T01_9000000934_06757cztM0_level2.evt | modeM0/AS1A02_006T01_9000000934_06757cztM0_level2_quad_clean.evt |
| Size (bytes) | 420,318,720 | 97,784,640 |
| Size | 400.8 MB | 93.3 MB |
| Events in quadrant A | 3,069,308 | 643,682 |
| Events in quadrant B | 2,959,362 | 653,117 |
| Events in quadrant C | 2,726,805 | 630,546 |
| Events in quadrant D | 3,554,914 | 604,051 |
| Mode M9 | |||
|---|---|---|---|
| Quadrant | BADHDUFLAG | Total packets | Discarded packets |
| A | 0 | 12 | 0 |
| B | 0 | 12 | 0 |
| C | 0 | 12 | 0 |
| D | 0 | 12 | 0 |
| Mode M0 | |||
|---|---|---|---|
| Quadrant | BADHDUFLAG | Total packets | Discarded packets |
| A | 0 | 13311 | 2 |
| B | 0 | 13017 | 1 |
| C | 0 | 12554 | 1 |
| D | 0 | 14817 | 1 |
| Mode SS | |||
|---|---|---|---|
| Quadrant | BADHDUFLAG | Total packets | Discarded packets |
| A | 0 | 126 | 0 |
| B | 0 | 126 | 0 |
| C | 0 | 126 | 0 |
| D | 0 | 126 | 0 |
| Quadrant | Total seconds | Saturated seconds | Saturation percentage |
|---|---|---|---|
| A | 6157 | 93 | 1.510476% |
| B | 6157 | 58 | 0.942017% |
| C | 6157 | 32 | 0.519734% |
| D | 6157 | 141 | 2.290076% |
Noise dominated data is calculated using 1-second bins in cleaned event files. If a bin has >2000 counts, and if more than 50% of those come from <1% of pixels, then it is considered to be noise-dominated and hence unusable.
| Quadrant | # 1 sec bins | Bins with >0 counts | Bins with >2000 counts | High rate bins dominated by noise | Noise dominated (total time) | Noise dominated (detector-on time) | Marked lightcurve |
|---|---|---|---|---|---|---|---|
| A | 7357 | 6158 | 24 | 24 | 0.33% | 0.39% | 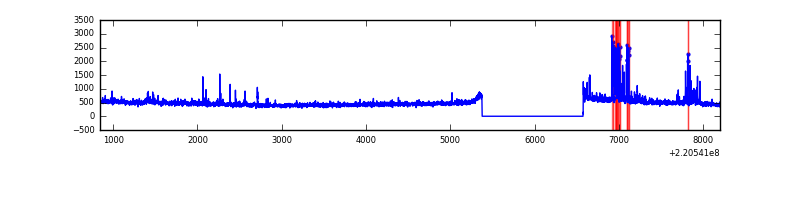 |
| B | 7357 | 6158 | 2 | 2 | 0.03% | 0.03% | 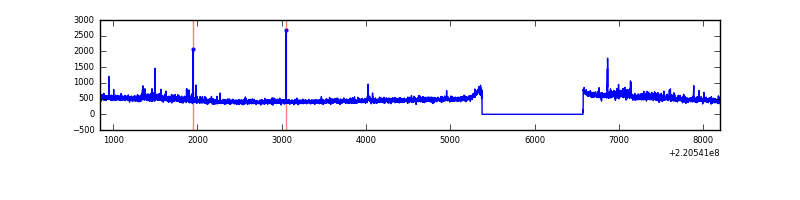 |
| C | 7357 | 6158 | 0 | 0 | 0.00% | 0.00% | 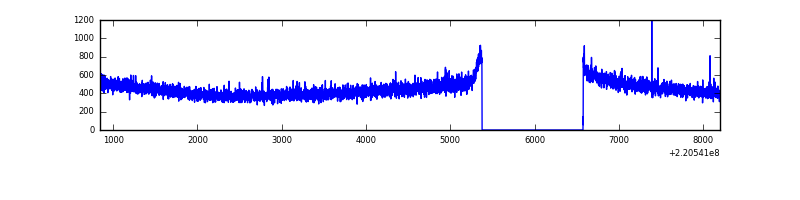 |
| D | 7357 | 6158 | 88 | 88 | 1.20% | 1.43% | 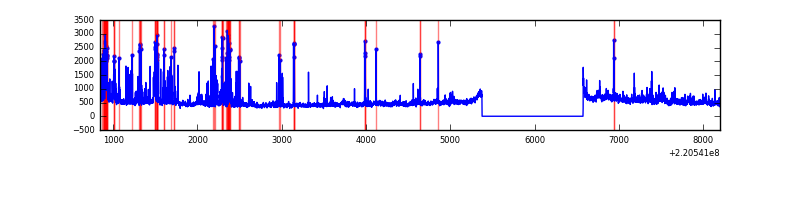 |
Top three noisy pixels from each quadrant. If the there are fewer than three noisy pixels in the level2.evt file, extra rows are filled as -1
| Pixel properties | Quadrant properties | ||||||
|---|---|---|---|---|---|---|---|
| Quadrant | DetID | PixID | Counts | Sigma | Mean | Median | Sigma |
| A | 4 | 2 | 127650 | 846.99 | 733 | 718 | 149.9 |
| A | 13 | 251 | 56899 | 374.88 | 733 | 718 | 149.9 |
| A | 15 | 234 | 39653 | 259.8 | 733 | 718 | 149.9 |
| B | 0 | 214 | 83878 | 587.15 | 737 | 720 | 141.6 |
| B | 0 | 189 | 14352 | 96.25 | 737 | 720 | 141.6 |
| B | 12 | 111 | 13304 | 88.85 | 737 | 720 | 141.6 |
| C | 13 | 61 | 5502 | 29.69 | 697 | 702 | 161.7 |
| C | 12 | 4 | 3115 | 14.93 | 697 | 702 | 161.7 |
| C | 1 | 3 | 2732 | 12.56 | 697 | 702 | 161.7 |
| D | 2 | 216 | 453207 | 2647.36 | 697 | 675 | 170.9 |
| D | 8 | 195 | 221039 | 1289.15 | 697 | 675 | 170.9 |
| D | 12 | 220 | 84142 | 488.29 | 697 | 675 | 170.9 |
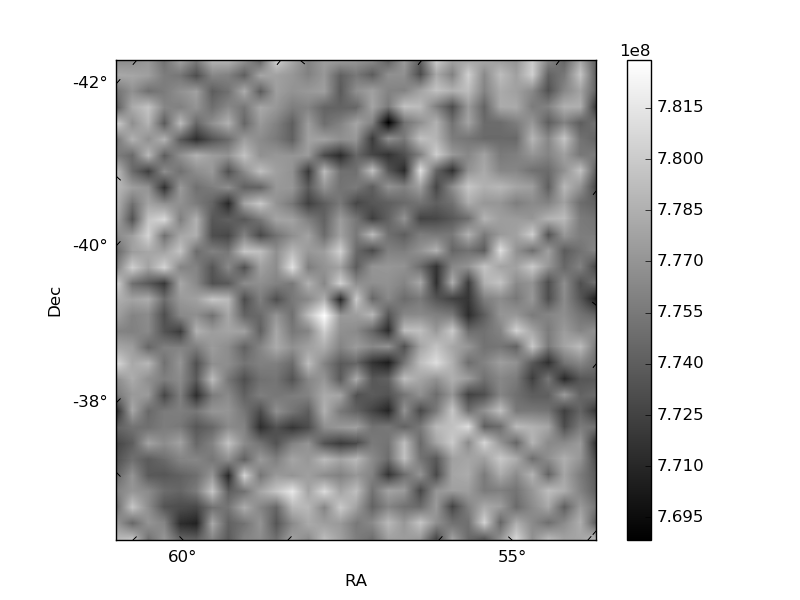
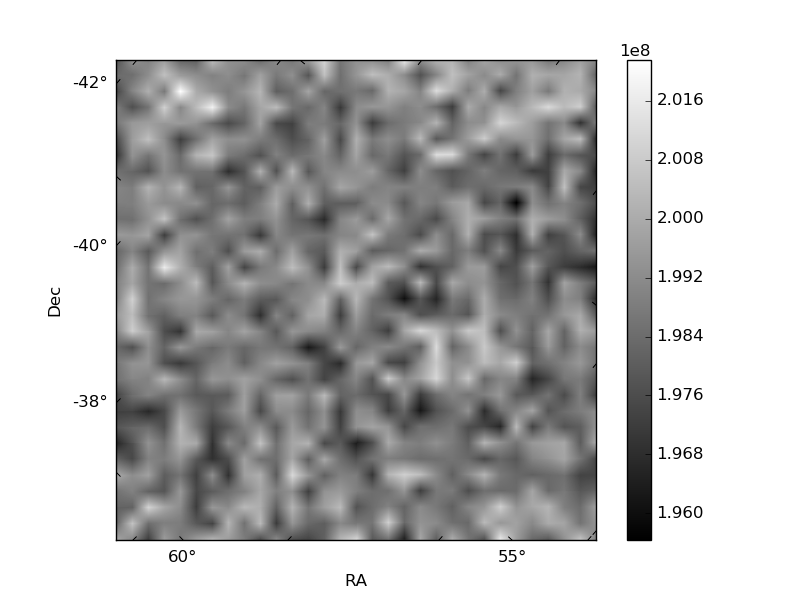
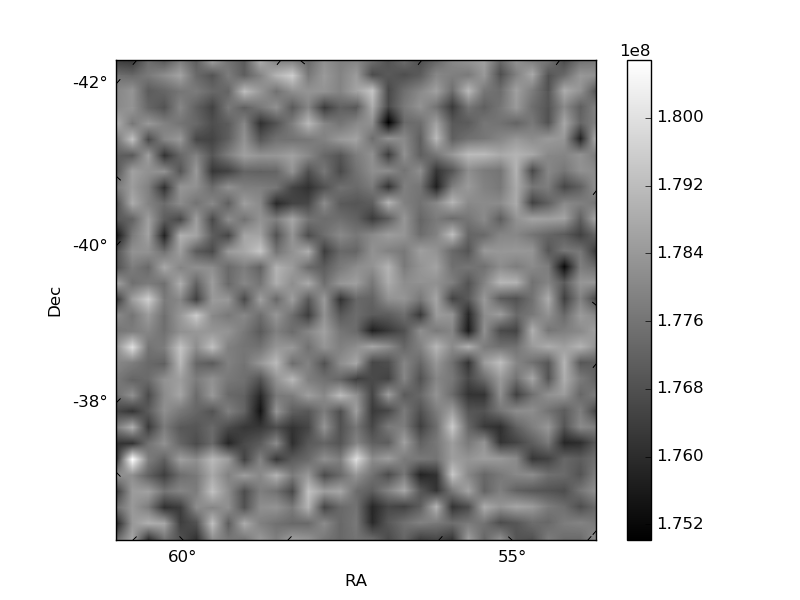
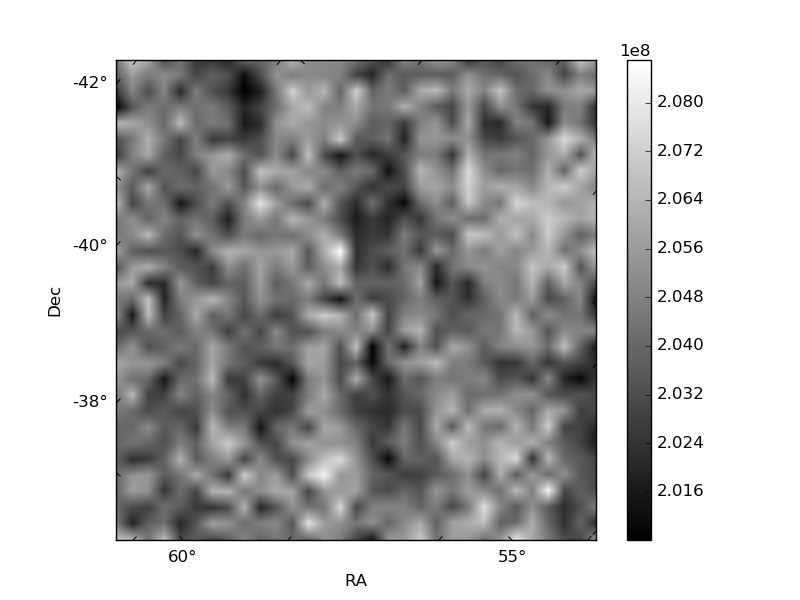
Histogram calculated using DETX and DETY for each event in the final _common_clean file
| Quadrant A | 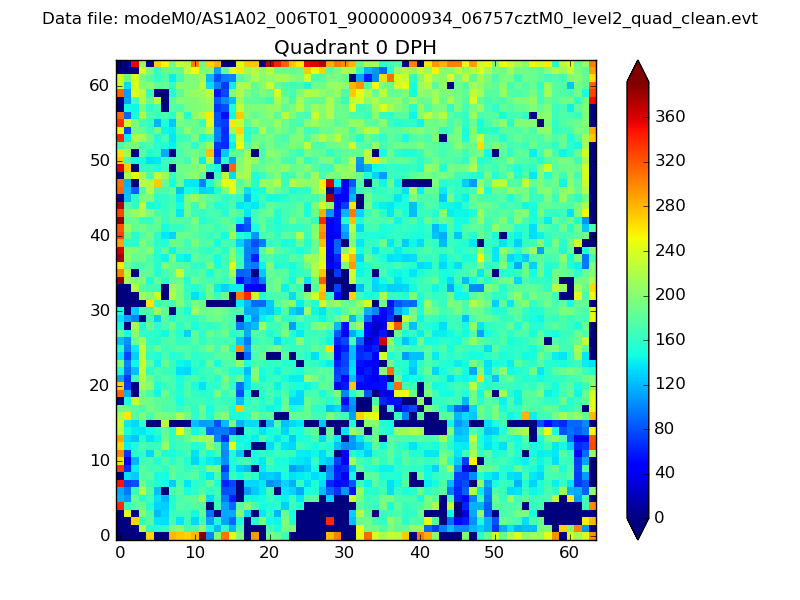 |
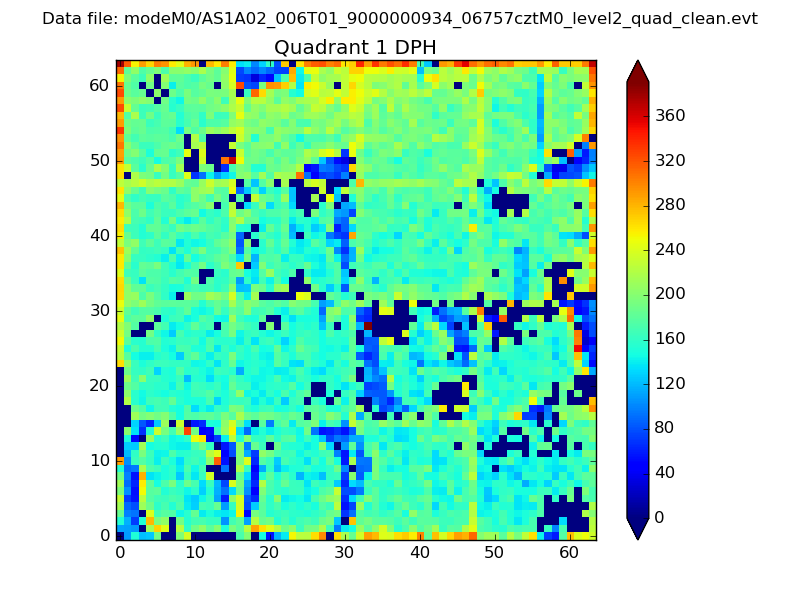 |
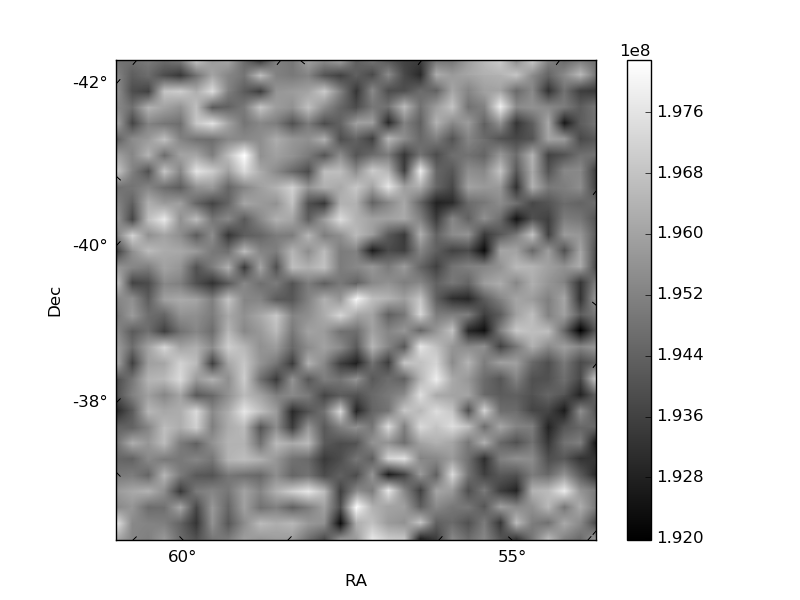
Quadrant B |
|---|---|---|---|
| Quadrant D | 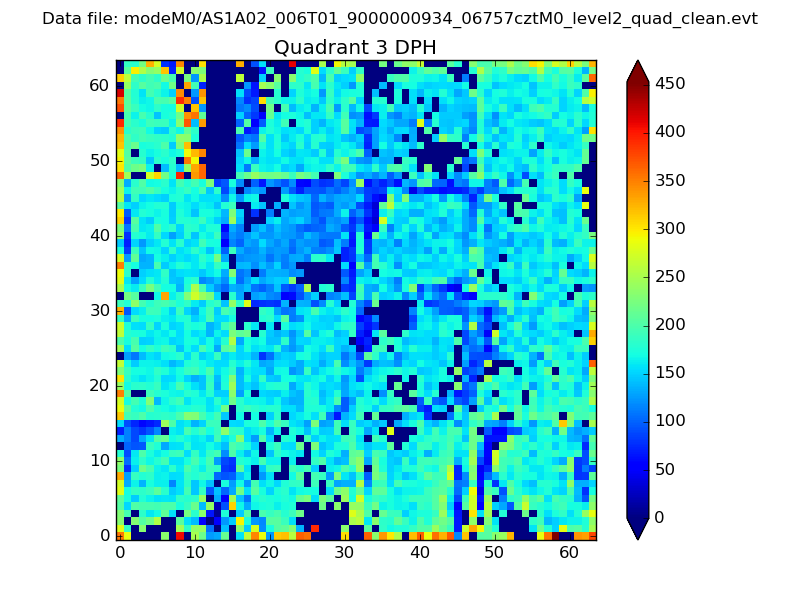 |
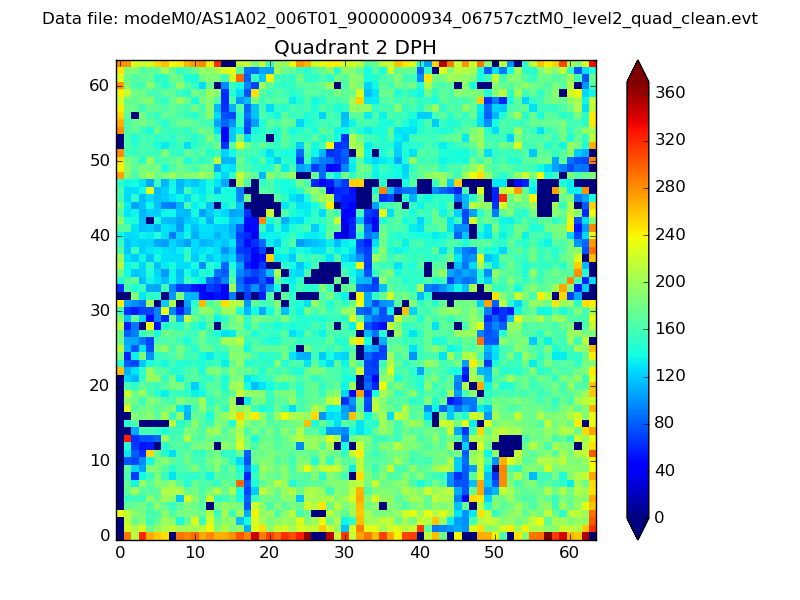 |
Quadrant C |
| Plot type | Count rate plots | Images |
|---|---|---|
| Comparison with Poisson distribution Blue bars denote a histogram of data divided into 1 sec bins. Red curve is a Poisson curve with rate = median count rate of data. |
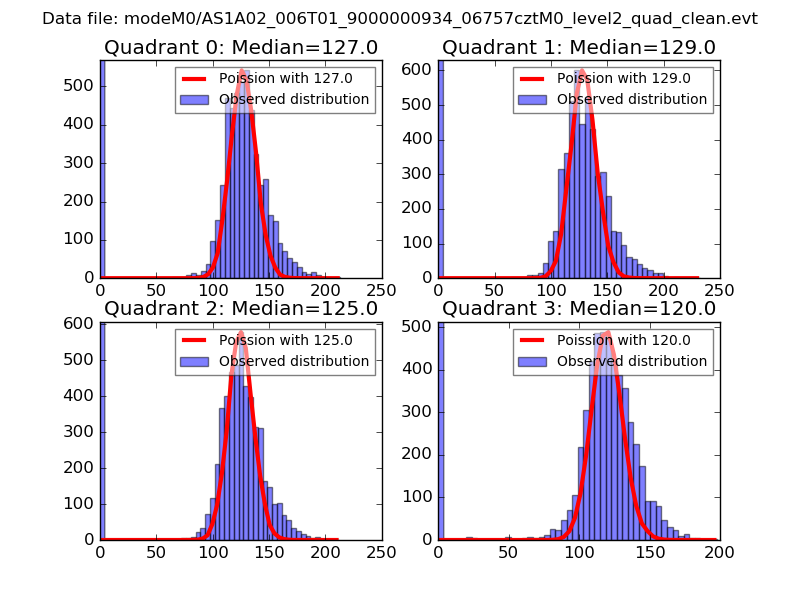 |
 |
| Quadrant-wise count rates Data is divided into 100 sec bins |
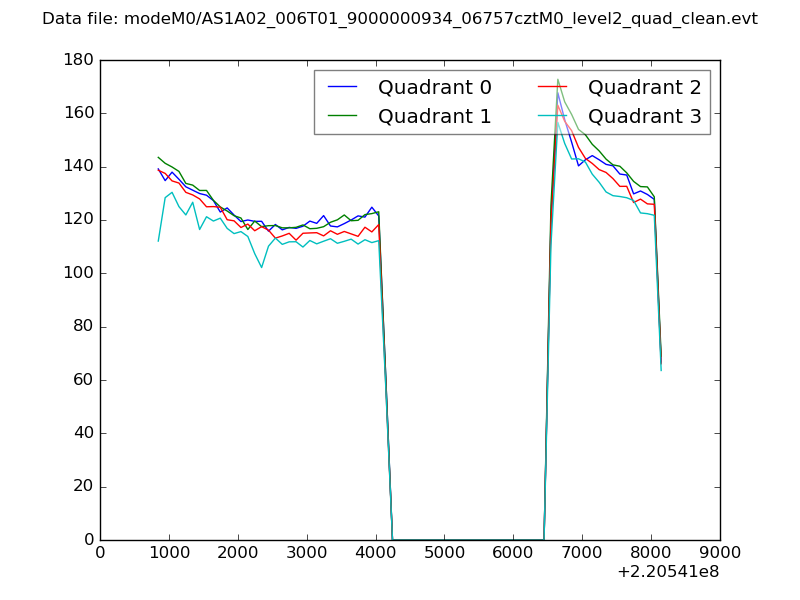 |
|
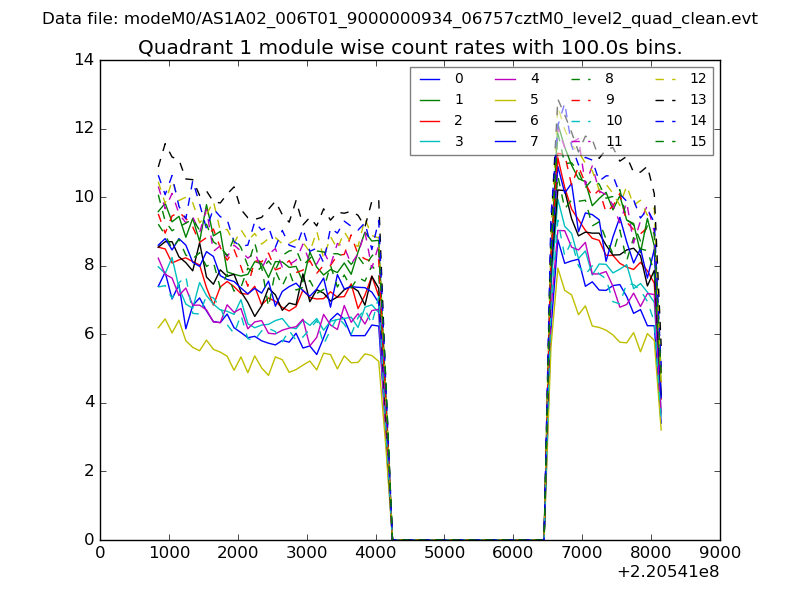
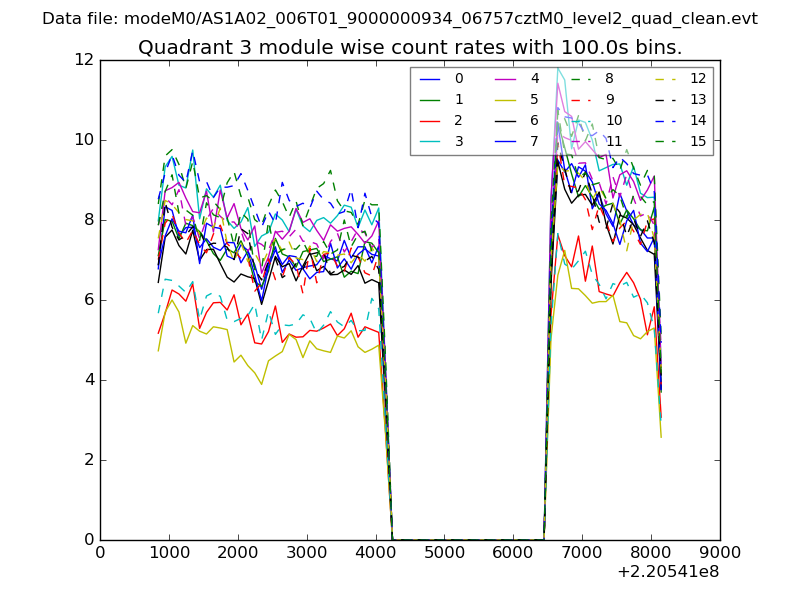
| Module-wise count rates for Quadrant A Data is divided into 100 sec bins |
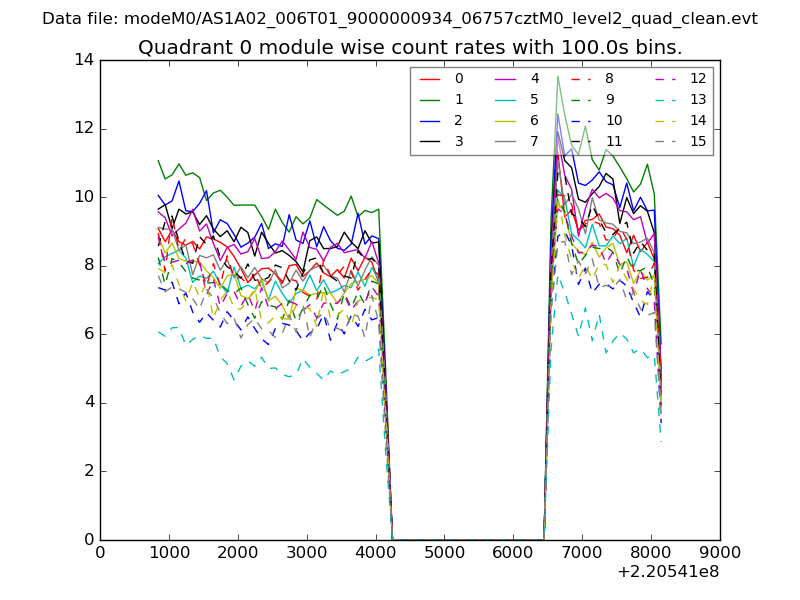 |
 |
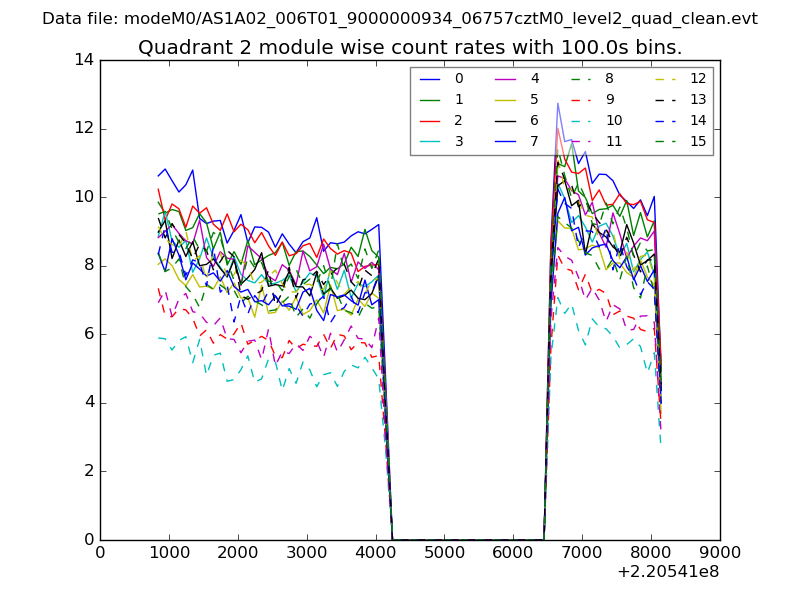
| Module-wise count rates for Quadrant B Data is divided into 100 sec bins |
 |
 |
| Module-wise count rates for Quadrant C Data is divided into 100 sec bins |
 |
 |
| Module-wise count rates for Quadrant D Data is divided into 100 sec bins |
 |
 |
| Parameter | Plot |
|---|---|
| CZT HV Monitor | 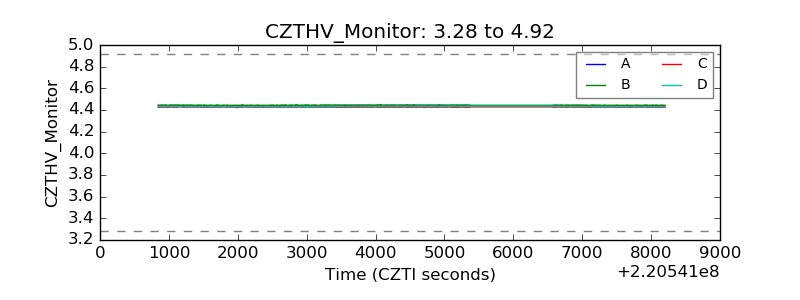 |
| D_VDD | 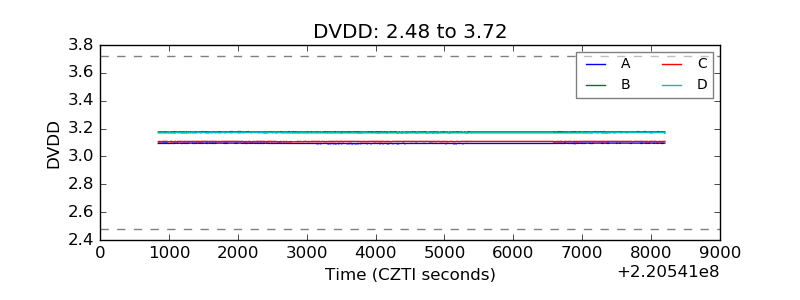 |
| Temperature 1 | 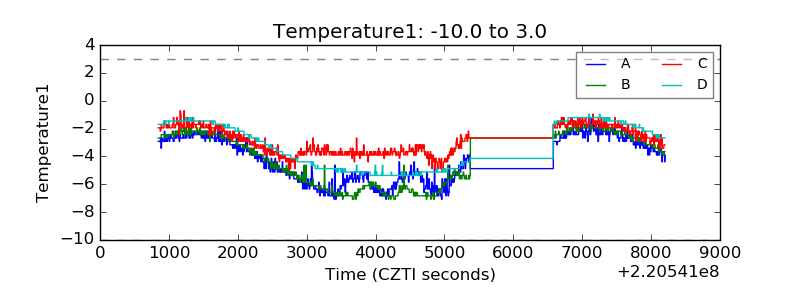 |
| Veto HV Monitor | 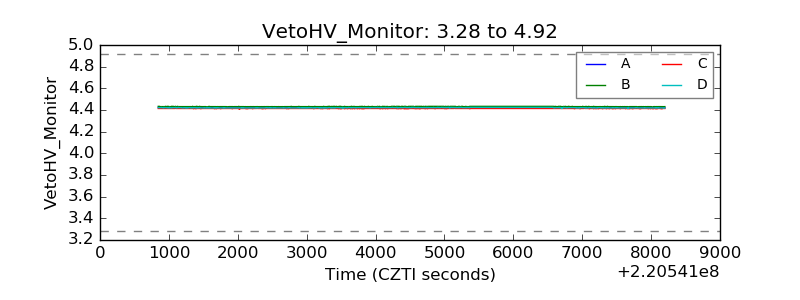 |
| Veto LLD | 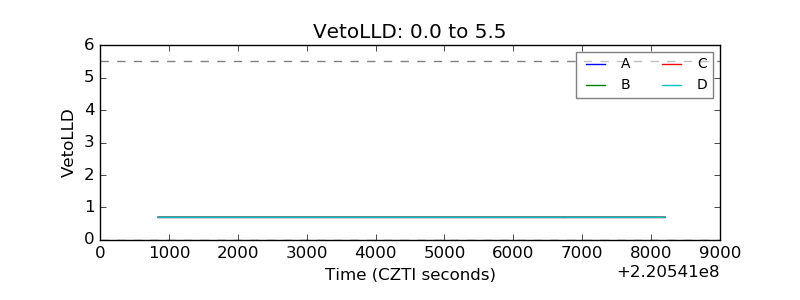 |
| Alpha Counter | 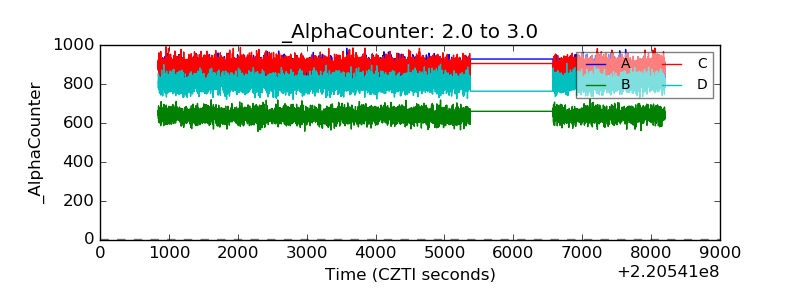 |
| _CPM_Rate | 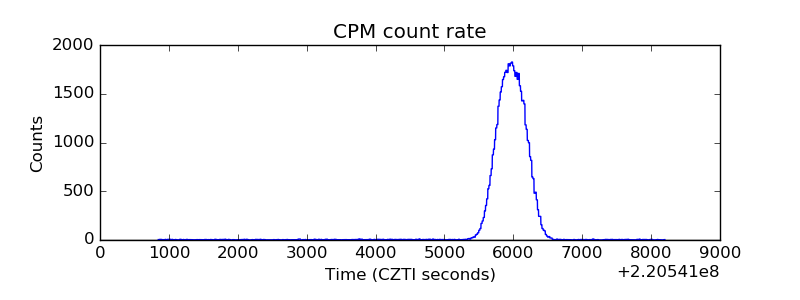 |
| CZT Counter | 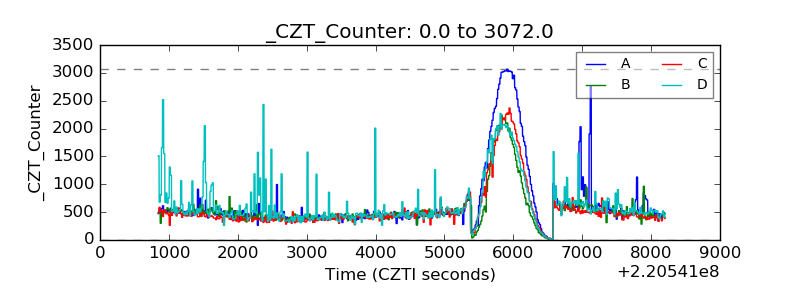 |
| +2.5 Volts monitor |  |
| +5 Volts monitor |  |
| _ROLL_ROT | 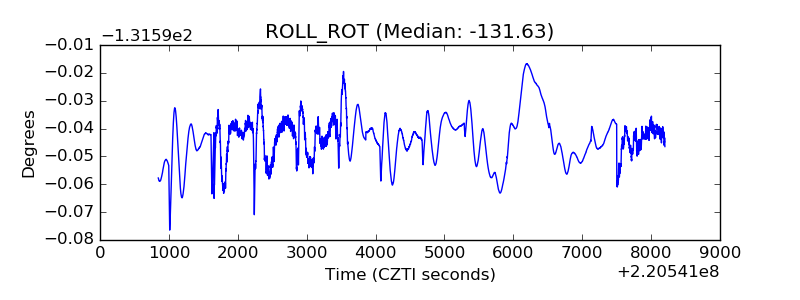 |
| _Roll_DEC | 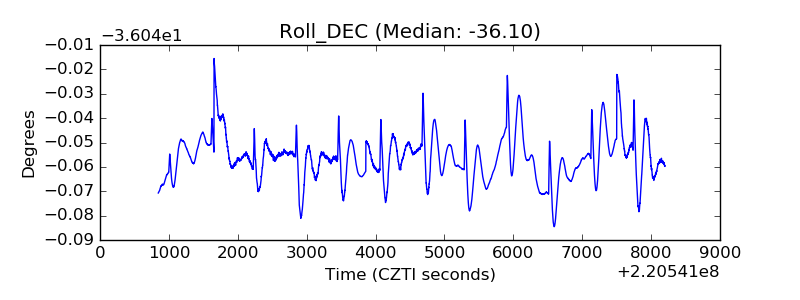 |
| _Roll_RA | 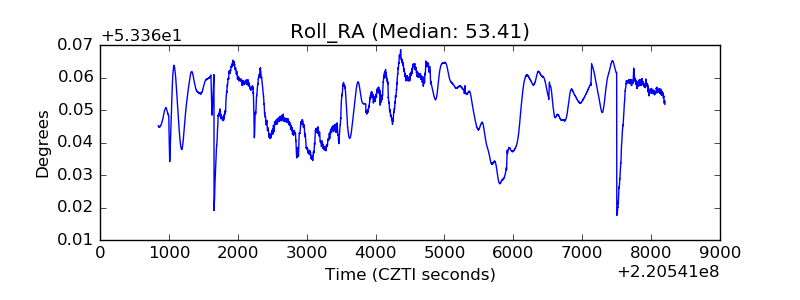 |
| Veto Counter | 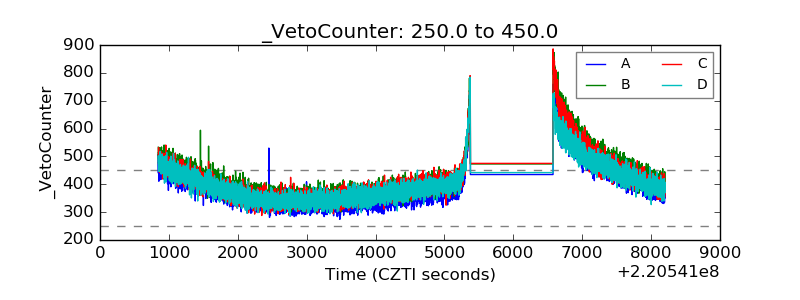 |