| Param | Original file | Final file |
|---|---|---|
| Filename | modeM0/AS1A02_006T01_9000000934_06758cztM0_level2.evt | modeM0/AS1A02_006T01_9000000934_06758cztM0_level2_quad_clean.evt |
| Size (bytes) | 770,918,400 | 171,351,360 |
| Size | 735.2 MB | 163.4 MB |
| Events in quadrant A | 5,467,221 | 1,126,872 |
| Events in quadrant B | 5,427,407 | 1,137,346 |
| Events in quadrant C | 5,025,194 | 1,095,340 |
| Events in quadrant D | 6,661,114 | 1,047,668 |
| Mode M9 | |||
|---|---|---|---|
| Quadrant | BADHDUFLAG | Total packets | Discarded packets |
| A | 0 | 25 | 0 |
| B | 0 | 25 | 0 |
| C | 0 | 25 | 0 |
| D | 0 | 25 | 0 |
| Mode M0 | |||
|---|---|---|---|
| Quadrant | BADHDUFLAG | Total packets | Discarded packets |
| A | 0 | 24052 | 3 |
| B | 0 | 23930 | 2 |
| C | 0 | 23101 | 2 |
| D | 0 | 27503 | 2 |
| Mode SS | |||
|---|---|---|---|
| Quadrant | BADHDUFLAG | Total packets | Discarded packets |
| A | 0 | 230 | 0 |
| B | 0 | 230 | 0 |
| C | 0 | 230 | 0 |
| D | 0 | 230 | 0 |
| Quadrant | Total seconds | Saturated seconds | Saturation percentage |
|---|---|---|---|
| A | 11312 | 145 | 1.281825% |
| B | 11312 | 131 | 1.158062% |
| C | 11312 | 51 | 0.450849% |
| D | 11312 | 207 | 1.829915% |
Noise dominated data is calculated using 1-second bins in cleaned event files. If a bin has >2000 counts, and if more than 50% of those come from <1% of pixels, then it is considered to be noise-dominated and hence unusable.
| Quadrant | # 1 sec bins | Bins with >0 counts | Bins with >2000 counts | High rate bins dominated by noise | Noise dominated (total time) | Noise dominated (detector-on time) | Marked lightcurve |
|---|---|---|---|---|---|---|---|
| A | 13772 | 11314 | 26 | 26 | 0.19% | 0.23% | 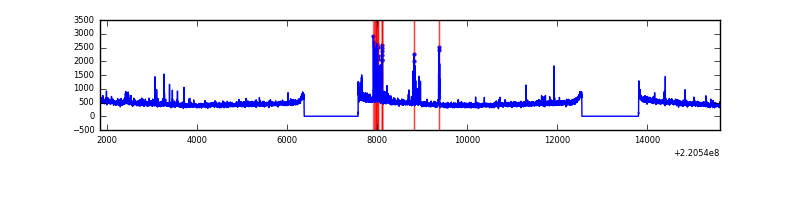 |
| B | 13772 | 11314 | 13 | 13 | 0.09% | 0.11% | 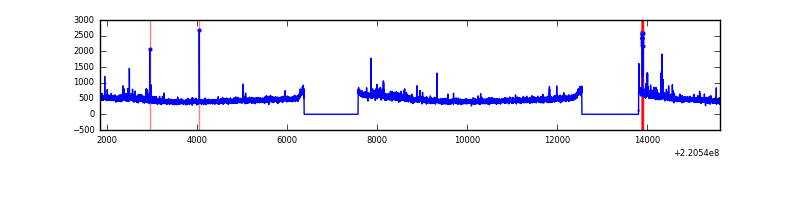 |
| C | 13772 | 11314 | 0 | 0 | 0.00% | 0.00% | 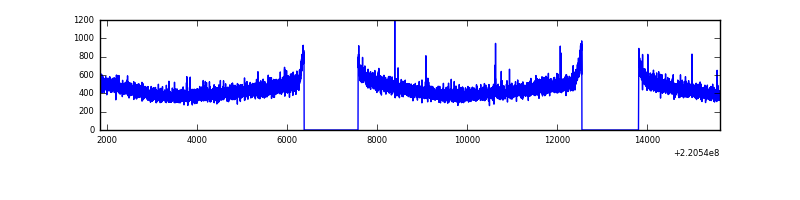 |
| D | 13772 | 11314 | 121 | 121 | 0.88% | 1.07% | 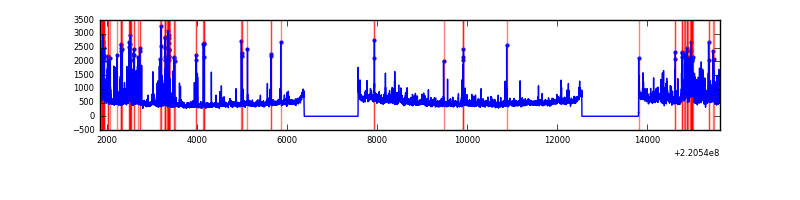 |
Top three noisy pixels from each quadrant. If the there are fewer than three noisy pixels in the level2.evt file, extra rows are filled as -1
| Pixel properties | Quadrant properties | ||||||
|---|---|---|---|---|---|---|---|
| Quadrant | DetID | PixID | Counts | Sigma | Mean | Median | Sigma |
| A | 4 | 2 | 158251 | 575.55 | 1346 | 1318 | 272.7 |
| A | 13 | 251 | 57632 | 206.53 | 1346 | 1318 | 272.7 |
| A | 15 | 234 | 40459 | 143.55 | 1346 | 1318 | 272.7 |
| B | 0 | 214 | 127257 | 489.8 | 1354 | 1324 | 257.1 |
| B | 4 | 173 | 32723 | 122.12 | 1354 | 1324 | 257.1 |
| B | 12 | 111 | 24405 | 89.77 | 1354 | 1324 | 257.1 |
| C | 13 | 61 | 10094 | 29.64 | 1284 | 1290 | 297.0 |
| C | 12 | 4 | 7721 | 21.65 | 1284 | 1290 | 297.0 |
| C | 1 | 3 | 4950 | 12.32 | 1284 | 1290 | 297.0 |
| D | 8 | 195 | 514541 | 1643.34 | 1279 | 1241 | 312.4 |
| D | 2 | 216 | 509730 | 1627.94 | 1279 | 1241 | 312.4 |
| D | 12 | 220 | 460040 | 1468.86 | 1279 | 1241 | 312.4 |
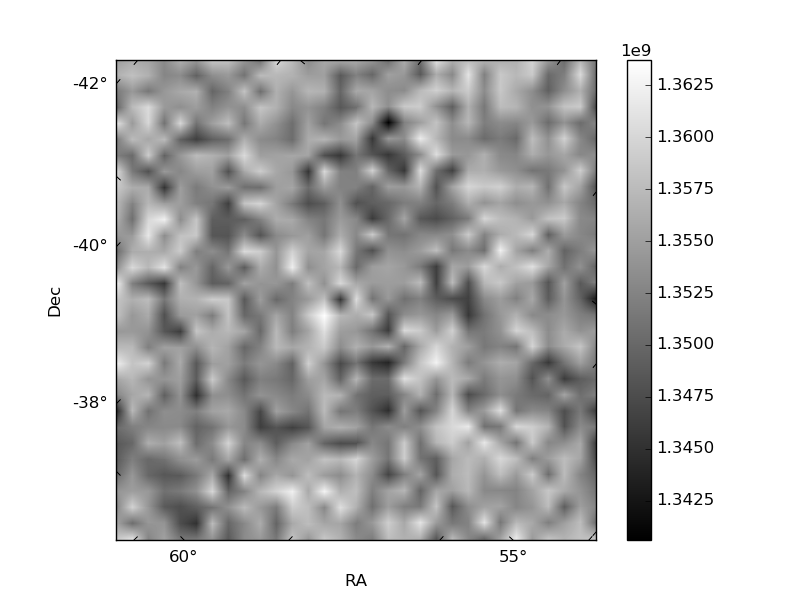
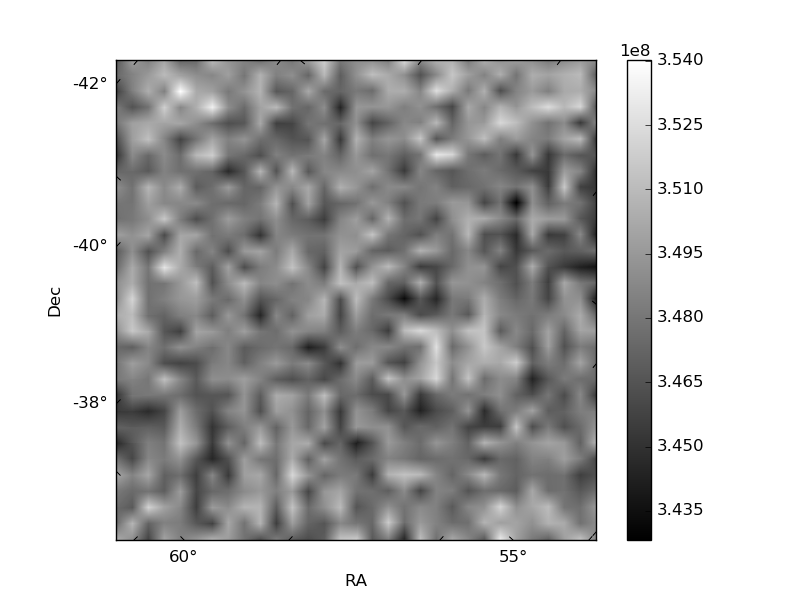
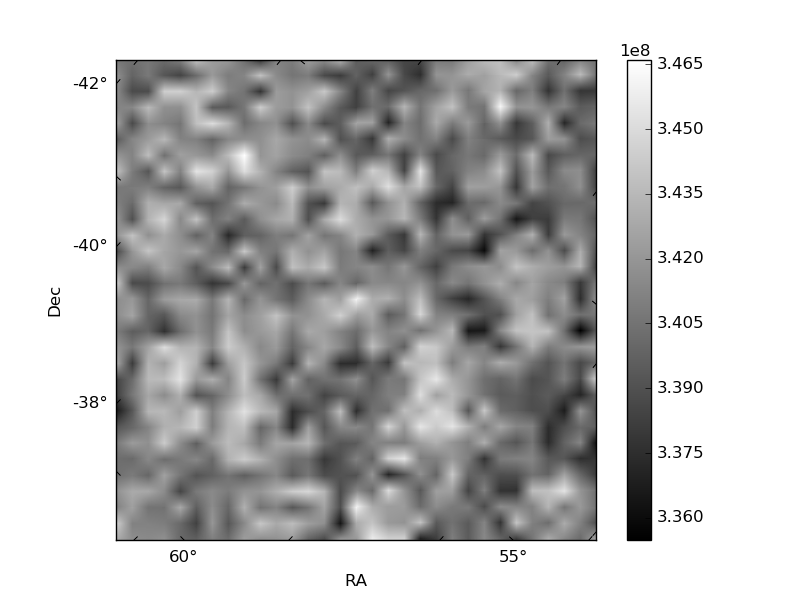
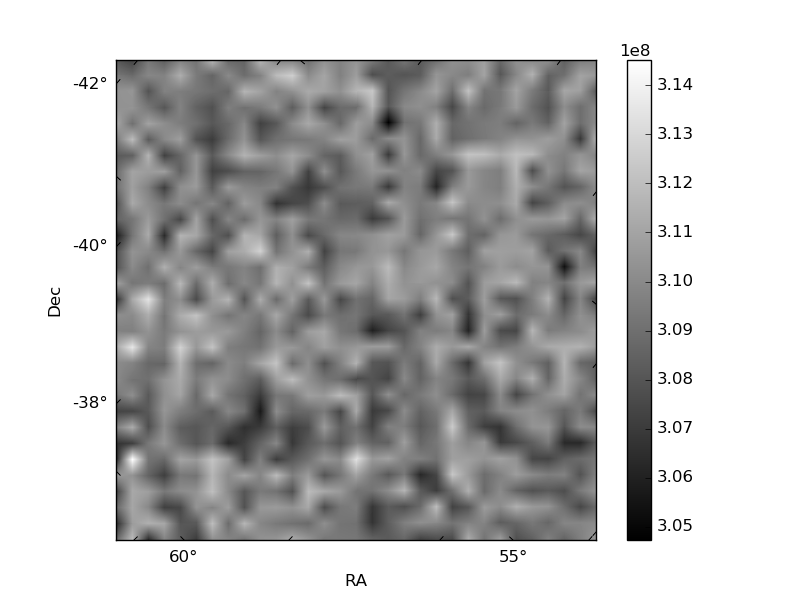
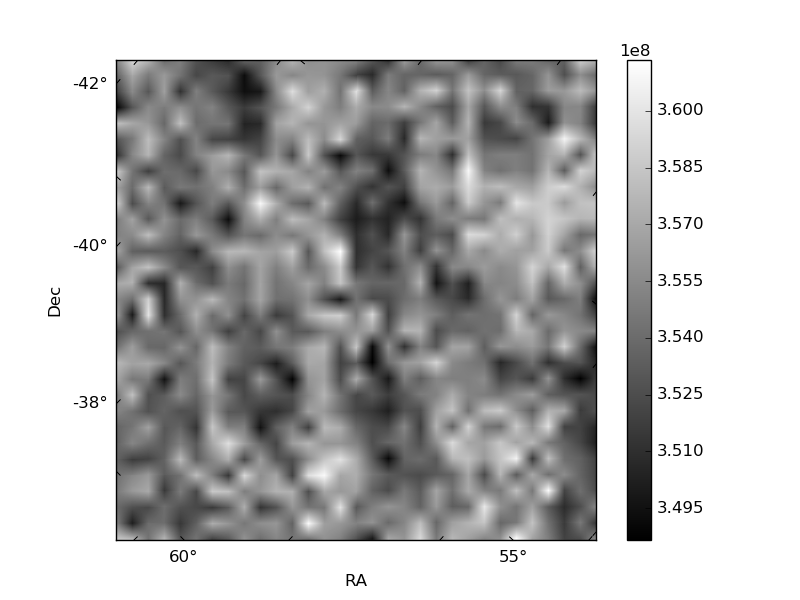
Histogram calculated using DETX and DETY for each event in the final _common_clean file
| Quadrant A | 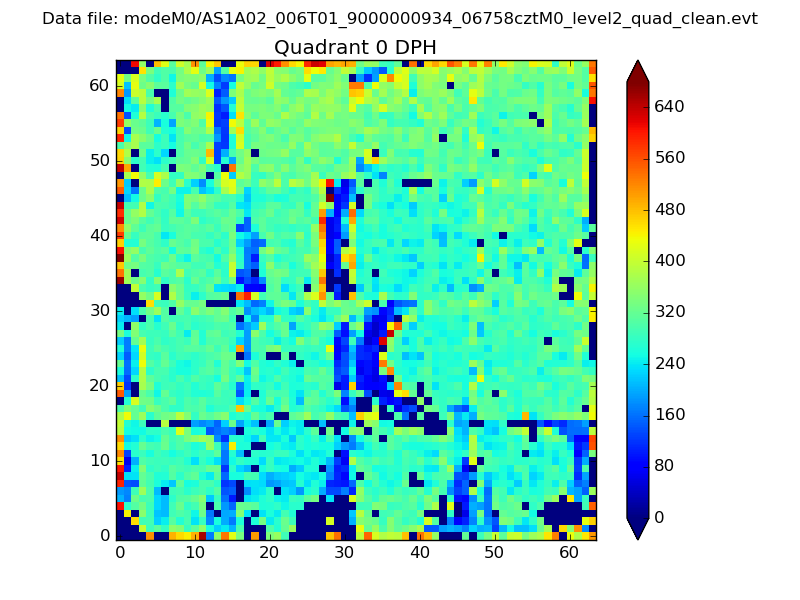 |
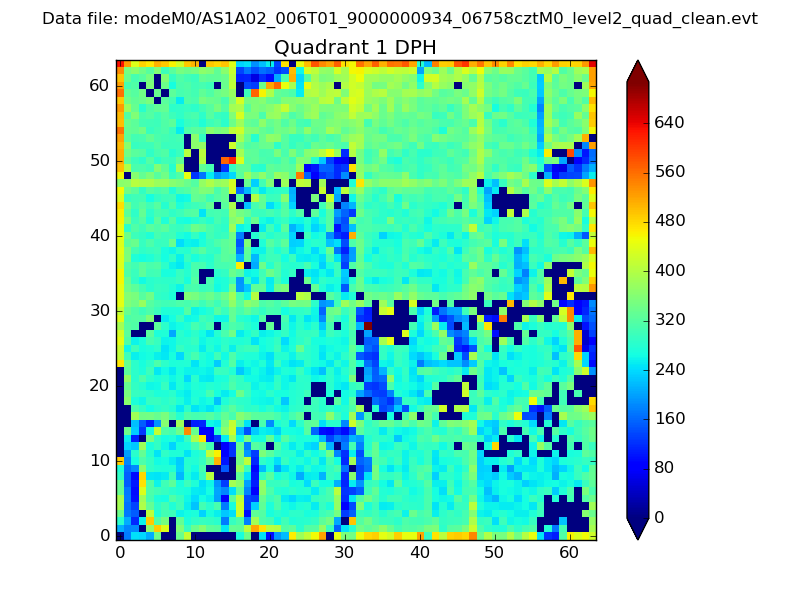 |
Quadrant B |
|---|---|---|---|
| Quadrant D | 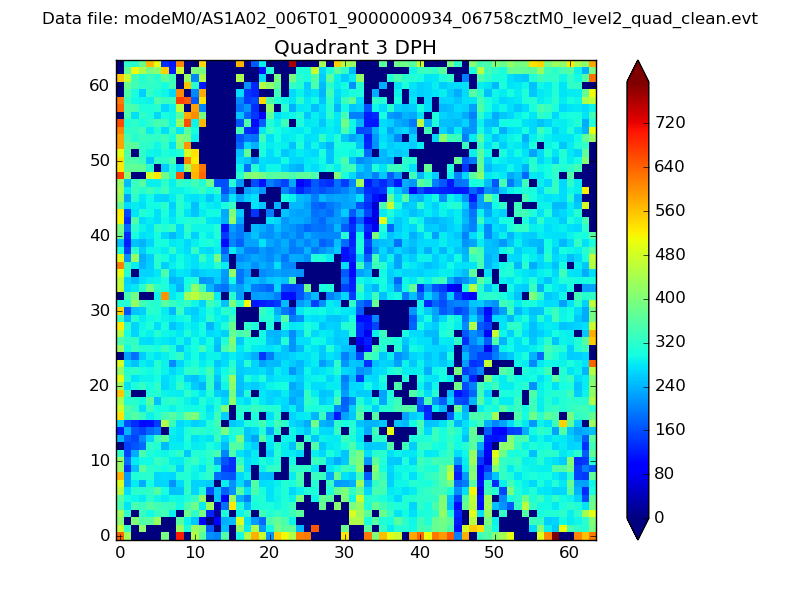 |
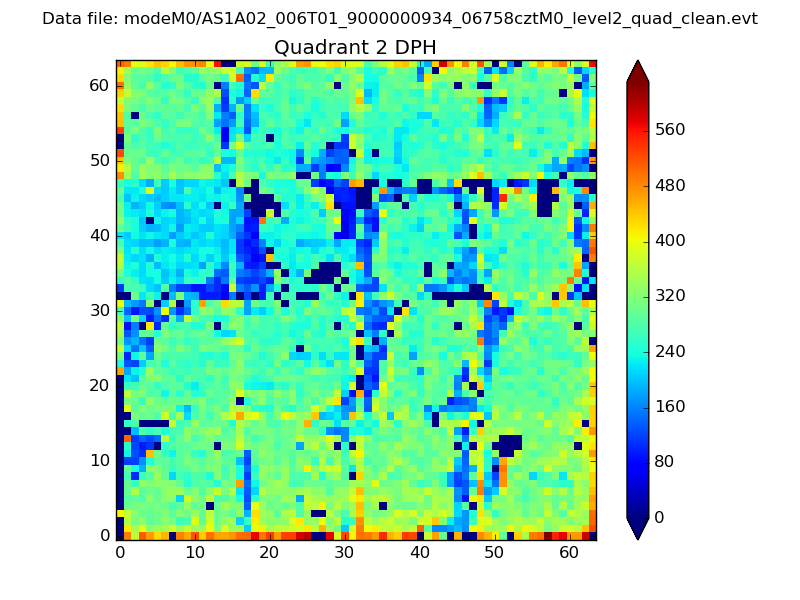 |
Quadrant C |
| Plot type | Count rate plots | Images |
|---|---|---|
| Comparison with Poisson distribution Blue bars denote a histogram of data divided into 1 sec bins. Red curve is a Poisson curve with rate = median count rate of data. |
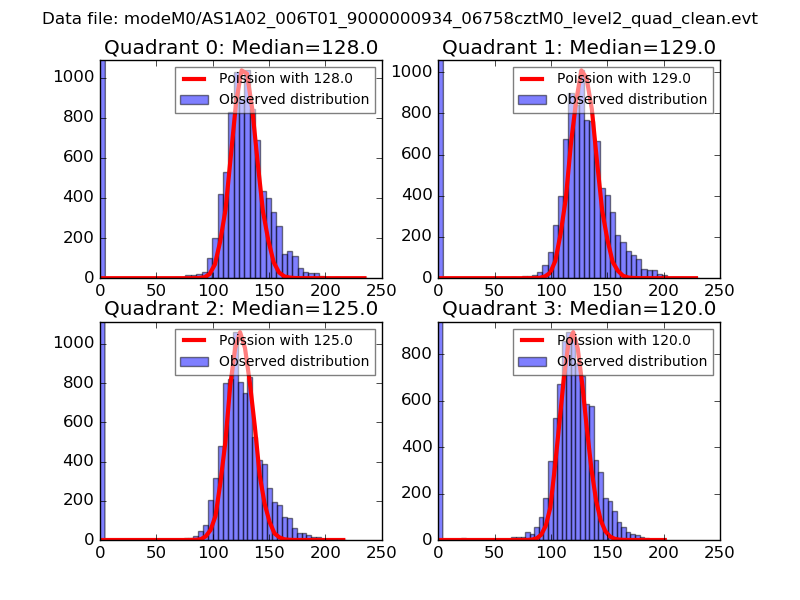 |
 |
| Quadrant-wise count rates Data is divided into 100 sec bins |
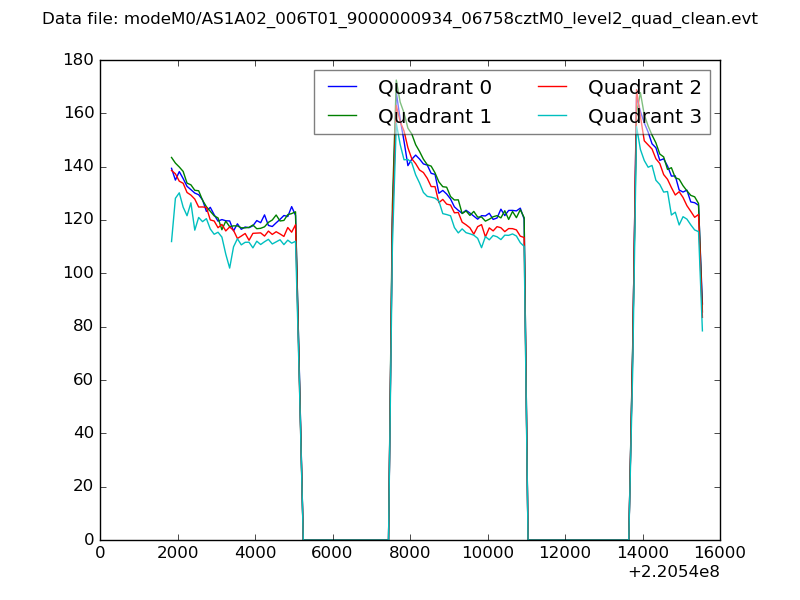 |
|
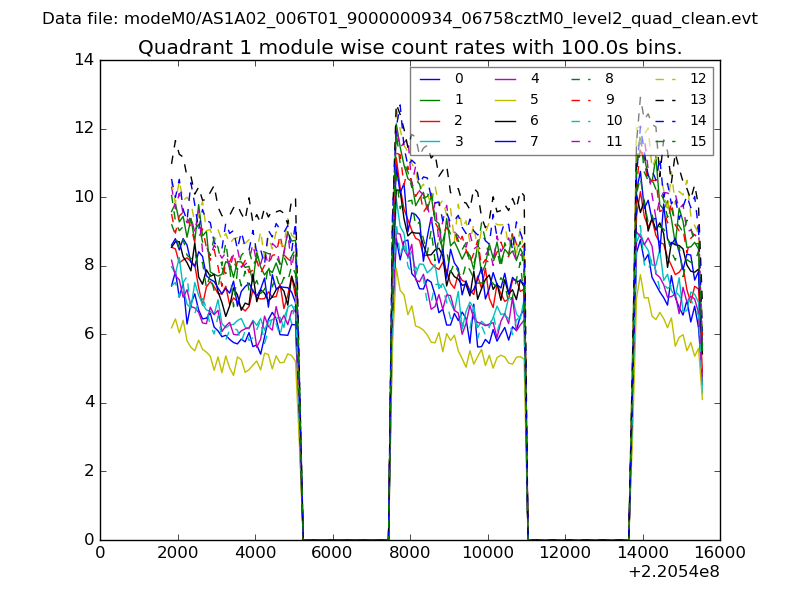
| Module-wise count rates for Quadrant A Data is divided into 100 sec bins |
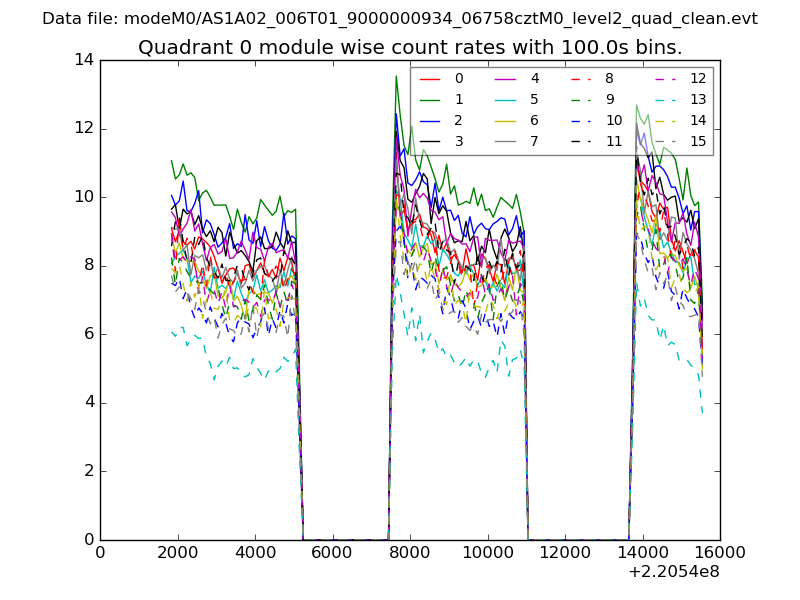 |
 |
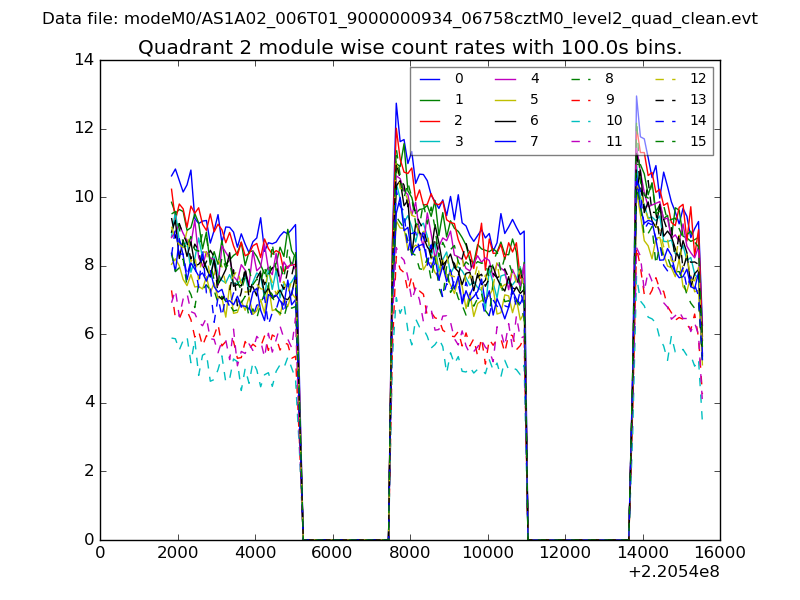
| Module-wise count rates for Quadrant B Data is divided into 100 sec bins |
 |
 |
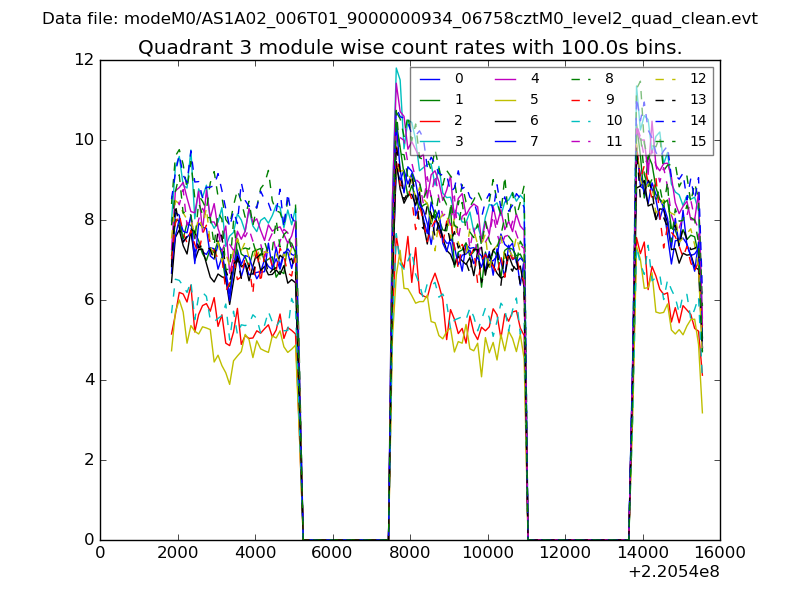
| Module-wise count rates for Quadrant C Data is divided into 100 sec bins |
 |
 |
| Module-wise count rates for Quadrant D Data is divided into 100 sec bins |
 |
 |
| Parameter | Plot |
|---|---|
| CZT HV Monitor | 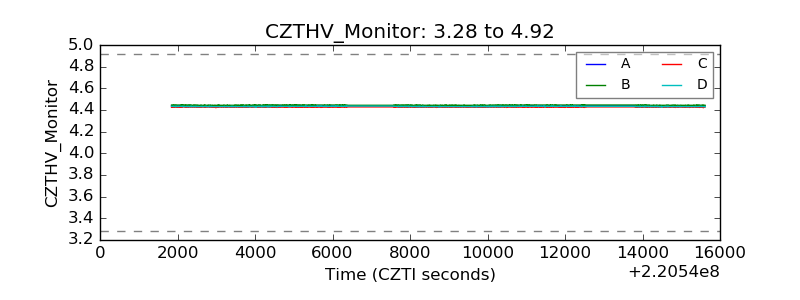 |
| D_VDD | 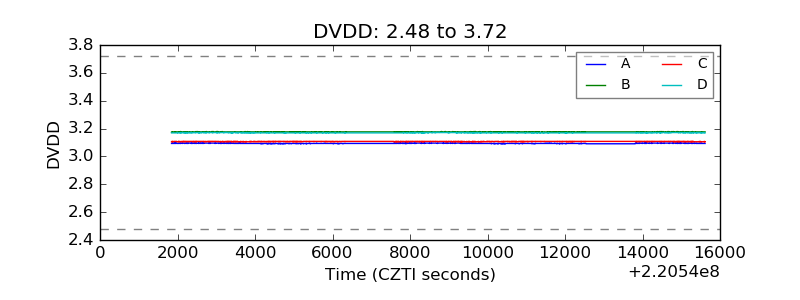 |
| Temperature 1 | 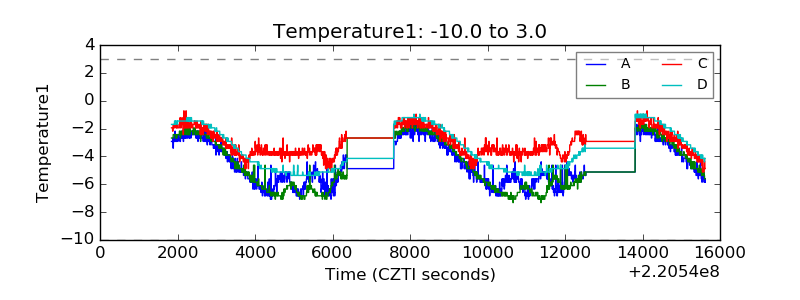 |
| Veto HV Monitor | 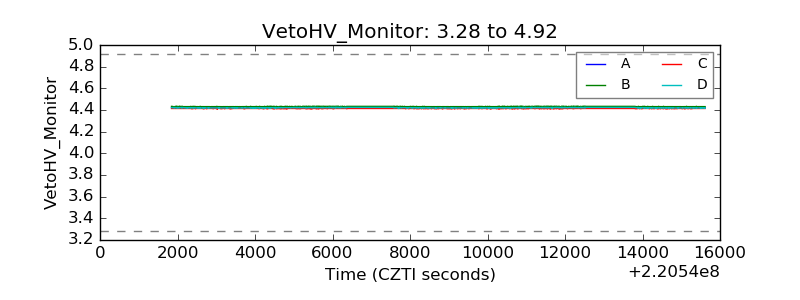 |
| Veto LLD | 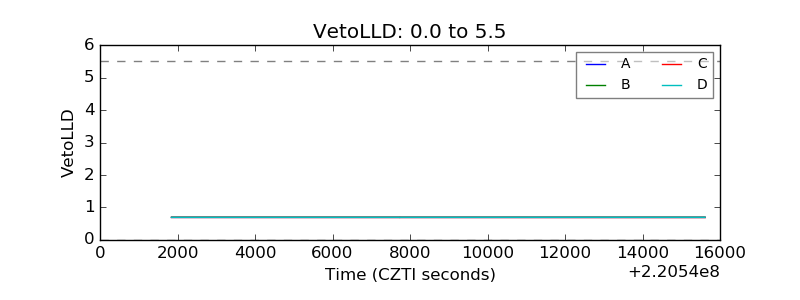 |
| Alpha Counter | 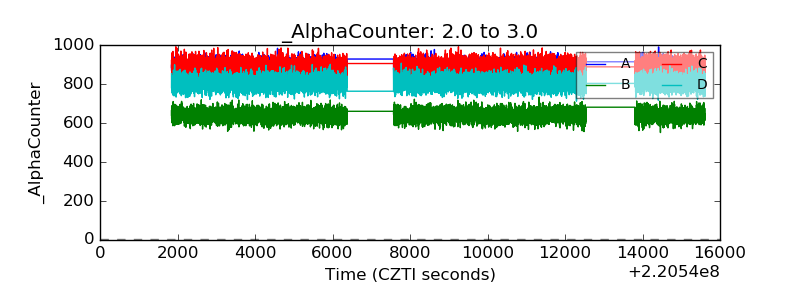 |
| _CPM_Rate | 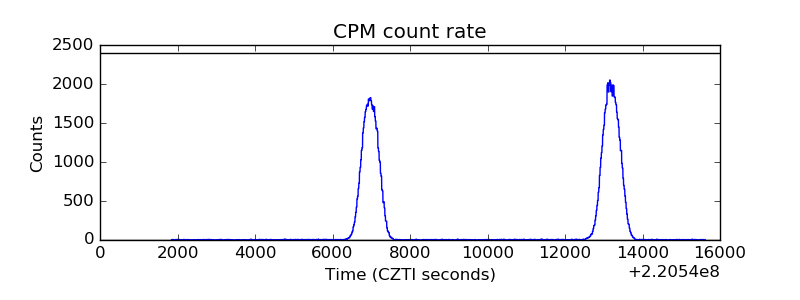 |
| CZT Counter | 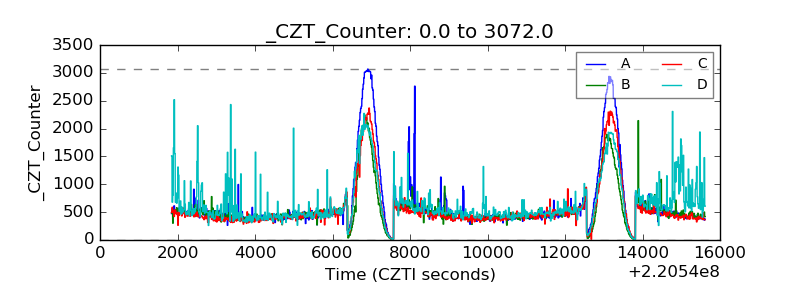 |
| +2.5 Volts monitor |  |
| +5 Volts monitor | 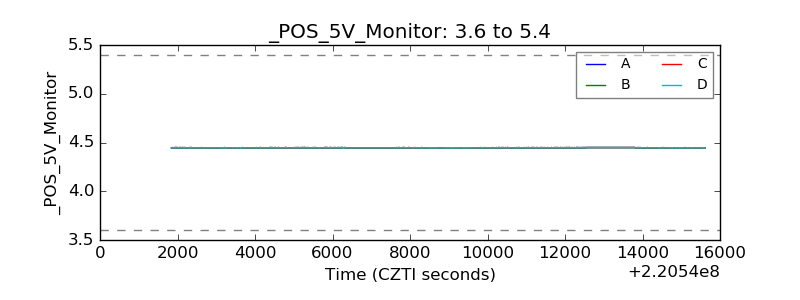 |
| _ROLL_ROT | 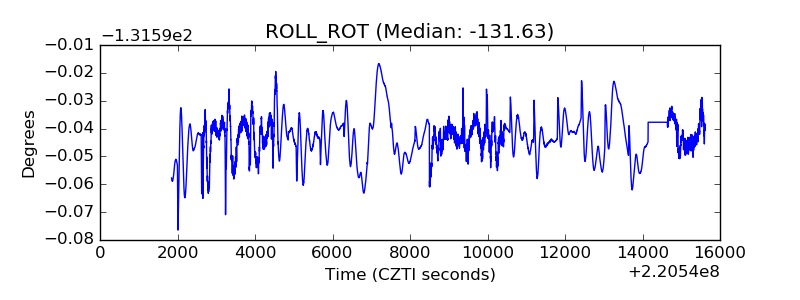 |
| _Roll_DEC | 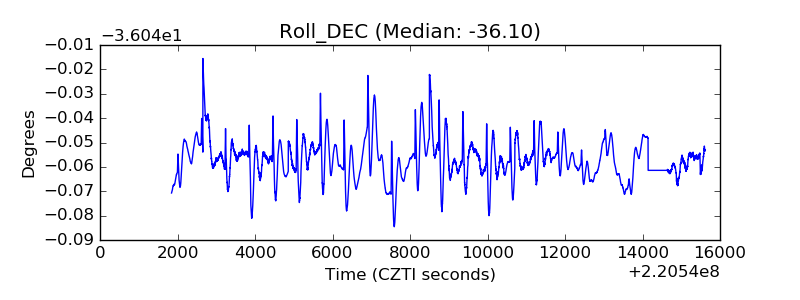 |
| _Roll_RA | 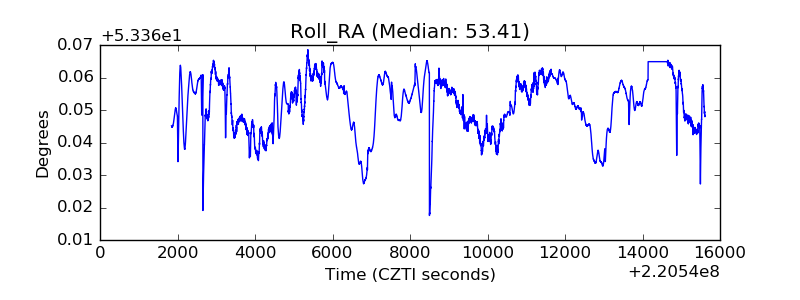 |
| Veto Counter | 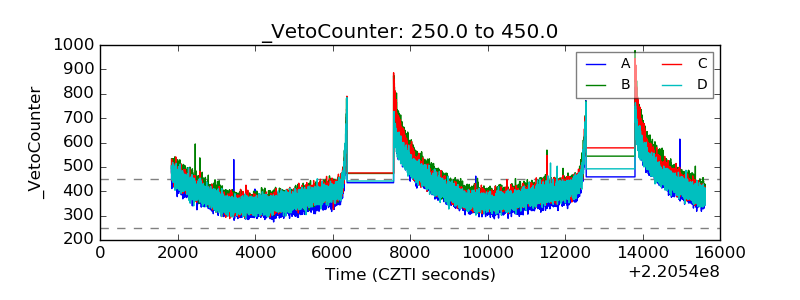 |