| Param | Original file | Final file |
|---|---|---|
| Filename | modeM0/AS1A02_006T01_9000000934_06760cztM0_level2.evt | modeM0/AS1A02_006T01_9000000934_06760cztM0_level2_quad_clean.evt |
| Size (bytes) | 508,610,880 | 86,627,520 |
| Size | 485.0 MB | 82.6 MB |
| Events in quadrant A | 2,999,815 | 558,792 |
| Events in quadrant B | 3,023,794 | 569,265 |
| Events in quadrant C | 2,855,980 | 550,476 |
| Events in quadrant D | 6,091,346 | 499,735 |
| Mode M9 | |||
|---|---|---|---|
| Quadrant | BADHDUFLAG | Total packets | Discarded packets |
| A | 0 | 17 | 0 |
| B | 0 | 17 | 0 |
| C | 0 | 17 | 0 |
| D | 0 | 18 | 0 |
| Mode M0 | |||
|---|---|---|---|
| Quadrant | BADHDUFLAG | Total packets | Discarded packets |
| A | 0 | 13305 | 3 |
| B | 0 | 13290 | 2 |
| C | 0 | 13099 | 2 |
| D | 0 | 22484 | 2 |
| Mode SS | |||
|---|---|---|---|
| Quadrant | BADHDUFLAG | Total packets | Discarded packets |
| A | 0 | 128 | 0 |
| B | 0 | 128 | 0 |
| C | 0 | 128 | 0 |
| D | 0 | 128 | 0 |
| Quadrant | Total seconds | Saturated seconds | Saturation percentage |
|---|---|---|---|
| A | 6381 | 36 | 0.564175% |
| B | 6381 | 38 | 0.595518% |
| C | 6381 | 14 | 0.219401% |
| D | 6381 | 415 | 6.503683% |
Noise dominated data is calculated using 1-second bins in cleaned event files. If a bin has >2000 counts, and if more than 50% of those come from <1% of pixels, then it is considered to be noise-dominated and hence unusable.
| Quadrant | # 1 sec bins | Bins with >0 counts | Bins with >2000 counts | High rate bins dominated by noise | Noise dominated (total time) | Noise dominated (detector-on time) | Marked lightcurve |
|---|---|---|---|---|---|---|---|
| A | 7636 | 6382 | 2 | 2 | 0.03% | 0.03% | 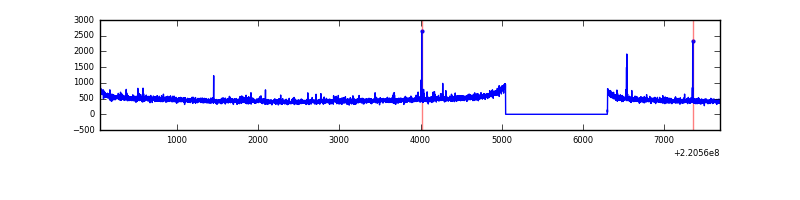 |
| B | 7636 | 6382 | 0 | 0 | 0.00% | 0.00% | 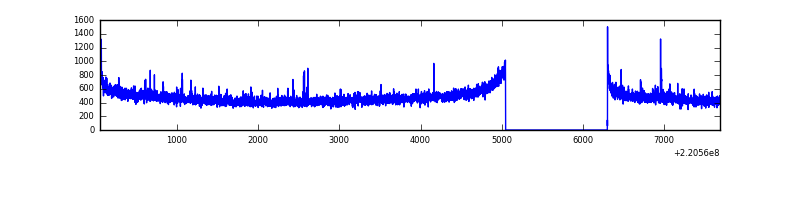 |
| C | 7636 | 6382 | 0 | 0 | 0.00% | 0.00% | 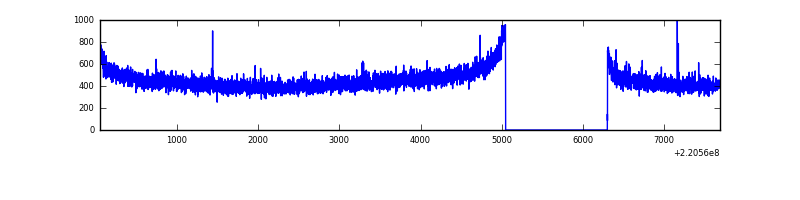 |
| D | 7636 | 6382 | 339 | 339 | 4.44% | 5.31% |  |
Top three noisy pixels from each quadrant. If the there are fewer than three noisy pixels in the level2.evt file, extra rows are filled as -1
| Pixel properties | Quadrant properties | ||||||
|---|---|---|---|---|---|---|---|
| Quadrant | DetID | PixID | Counts | Sigma | Mean | Median | Sigma |
| A | 13 | 251 | 56264 | 362.2 | 756 | 743 | 153.3 |
| A | 13 | 248 | 15400 | 95.62 | 756 | 743 | 153.3 |
| A | 8 | 15 | 11299 | 68.86 | 756 | 743 | 153.3 |
| B | 0 | 214 | 16486 | 107.65 | 768 | 752 | 146.2 |
| B | 12 | 111 | 14249 | 92.35 | 768 | 752 | 146.2 |
| B | 4 | 81 | 12941 | 83.4 | 768 | 752 | 146.2 |
| C | 13 | 61 | 5621 | 28.77 | 729 | 733 | 169.9 |
| C | 12 | 4 | 5325 | 27.03 | 729 | 733 | 169.9 |
| C | 14 | 67 | 2768 | 11.98 | 729 | 733 | 169.9 |
| D | 12 | 220 | 2665476 | 15302.86 | 709 | 685 | 174.1 |
| D | 2 | 152 | 370494 | 2123.67 | 709 | 685 | 174.1 |
| D | 8 | 195 | 192321 | 1100.49 | 709 | 685 | 174.1 |
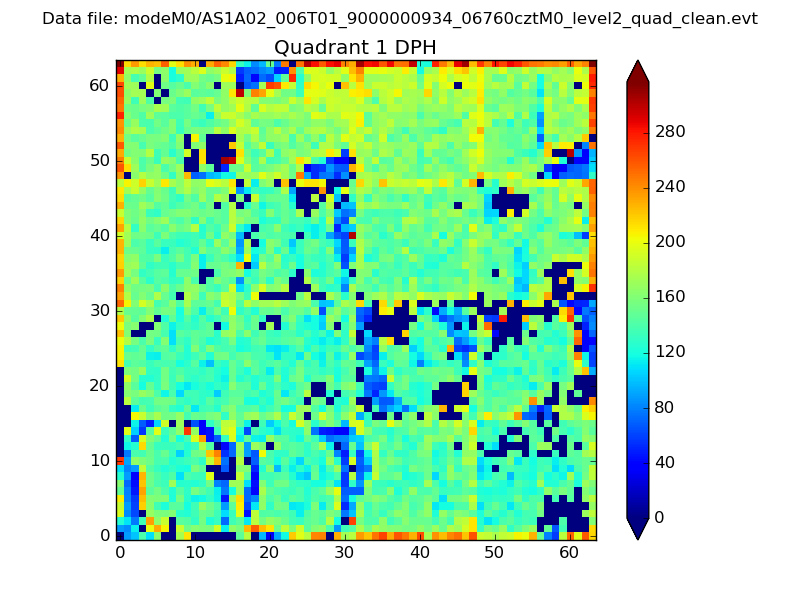
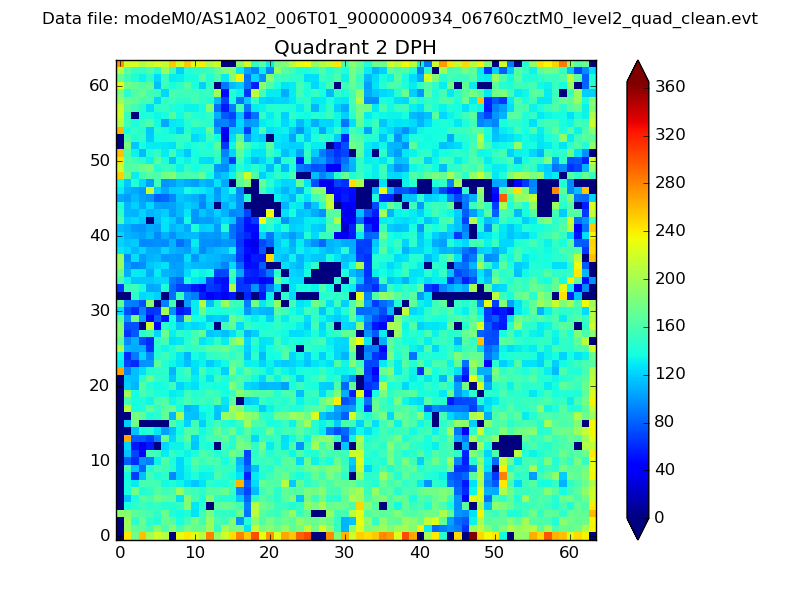
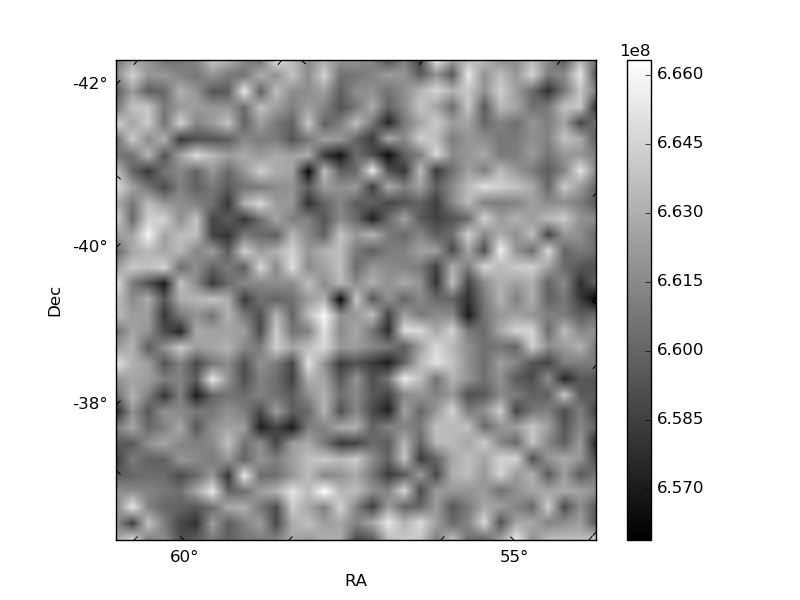
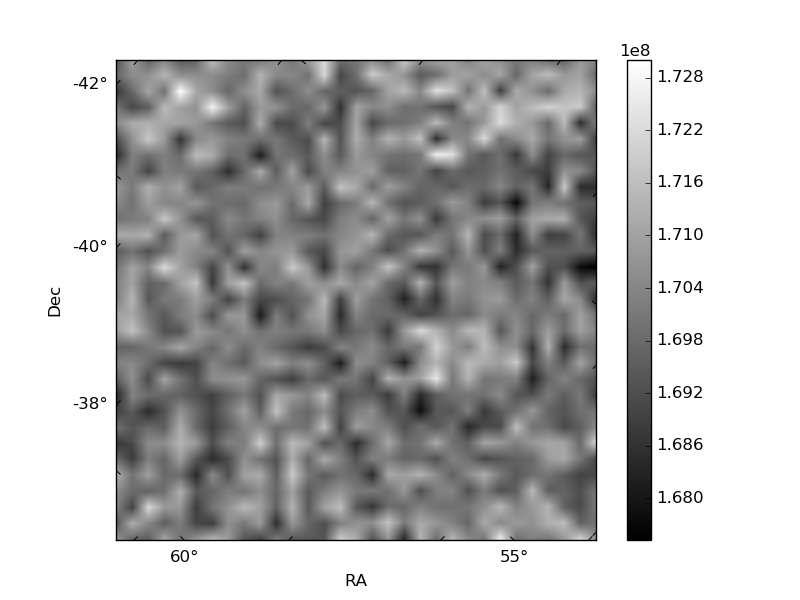
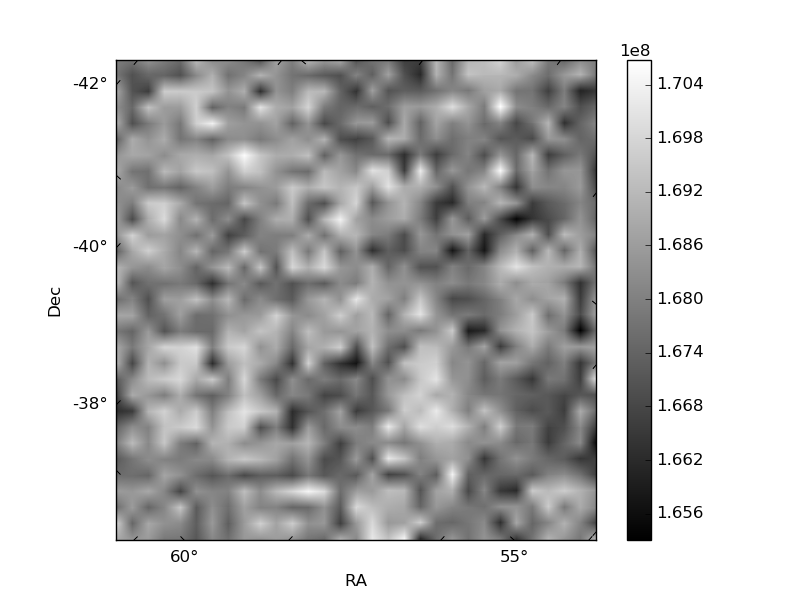
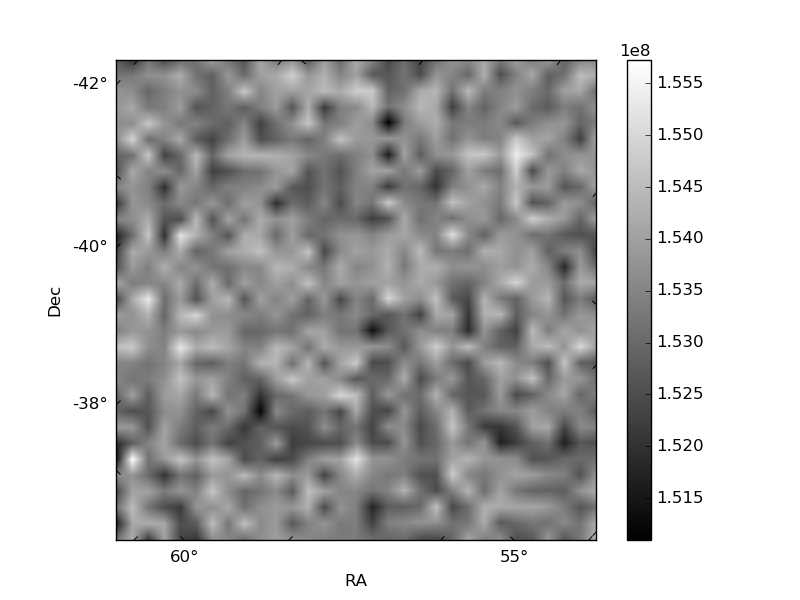
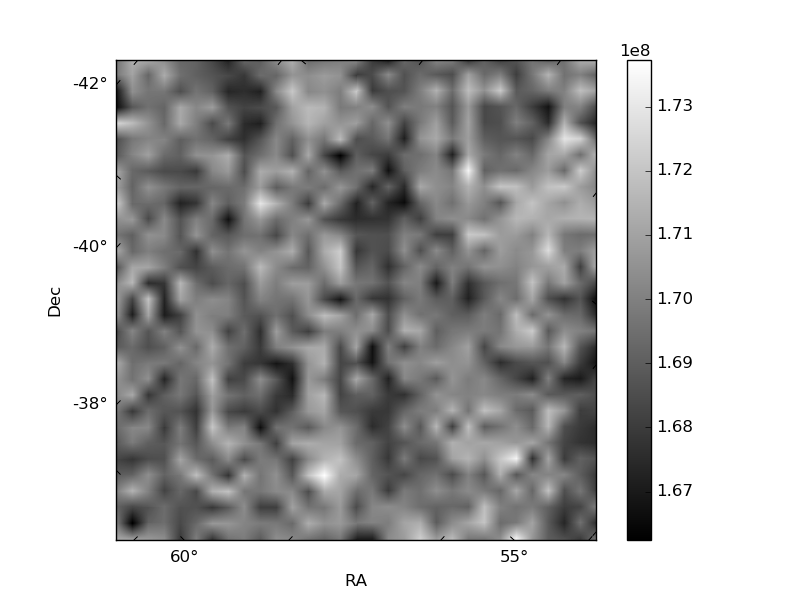
Histogram calculated using DETX and DETY for each event in the final _common_clean file
| Quadrant A | 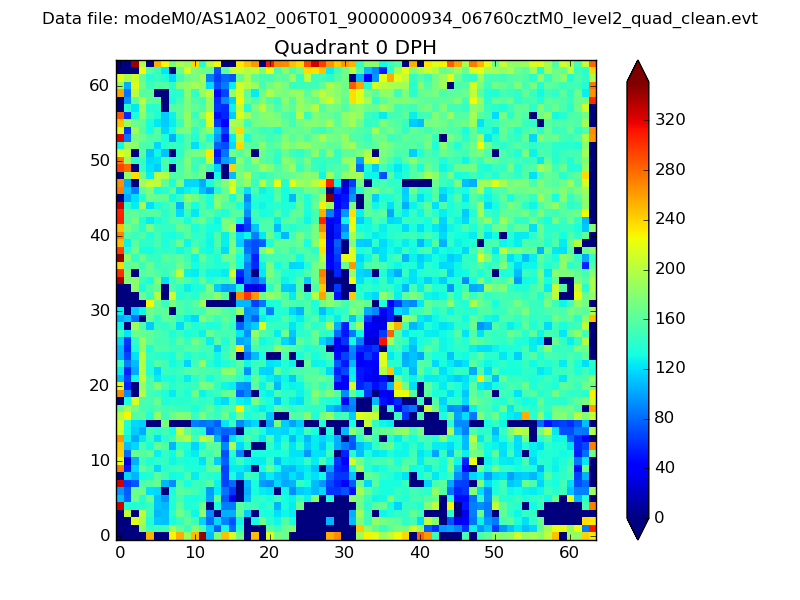 |
 |
Quadrant B |
|---|---|---|---|
| Quadrant D | 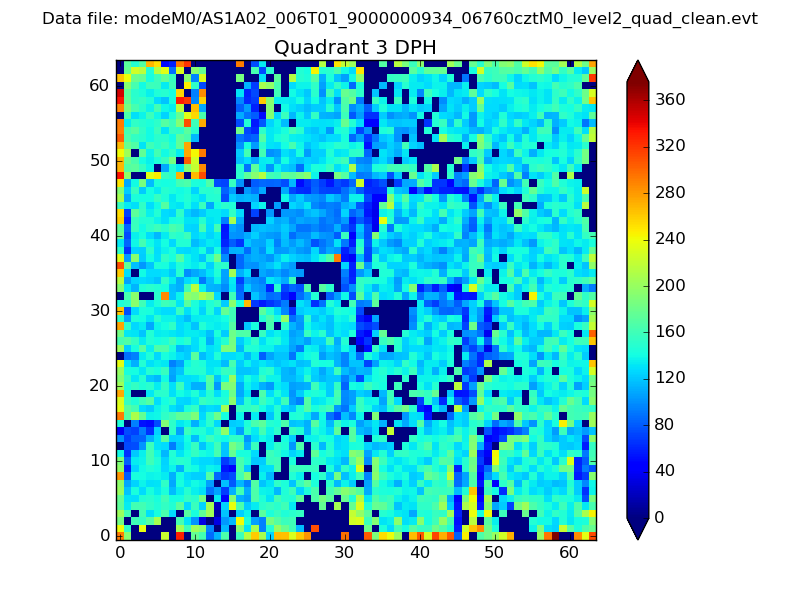 |
 |
Quadrant C |
| Plot type | Count rate plots | Images |
|---|---|---|
| Comparison with Poisson distribution Blue bars denote a histogram of data divided into 1 sec bins. Red curve is a Poisson curve with rate = median count rate of data. |
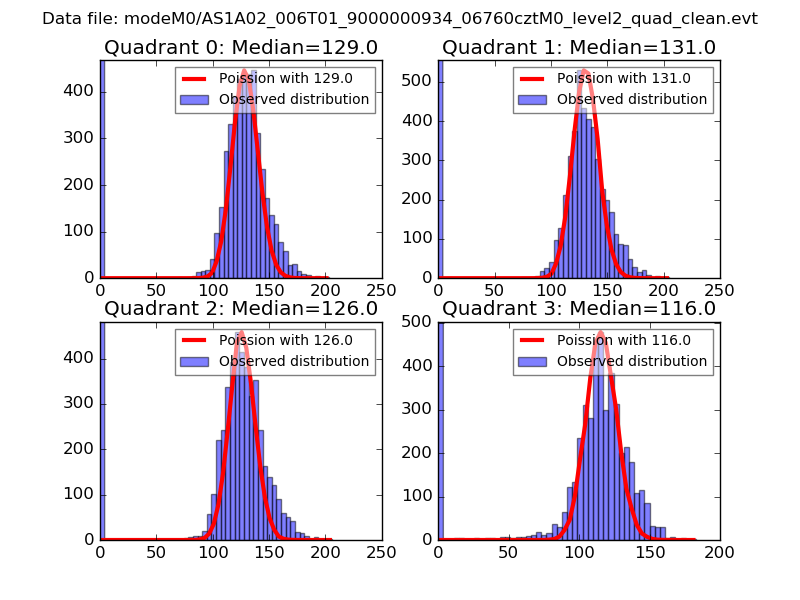 |
 |
| Quadrant-wise count rates Data is divided into 100 sec bins |
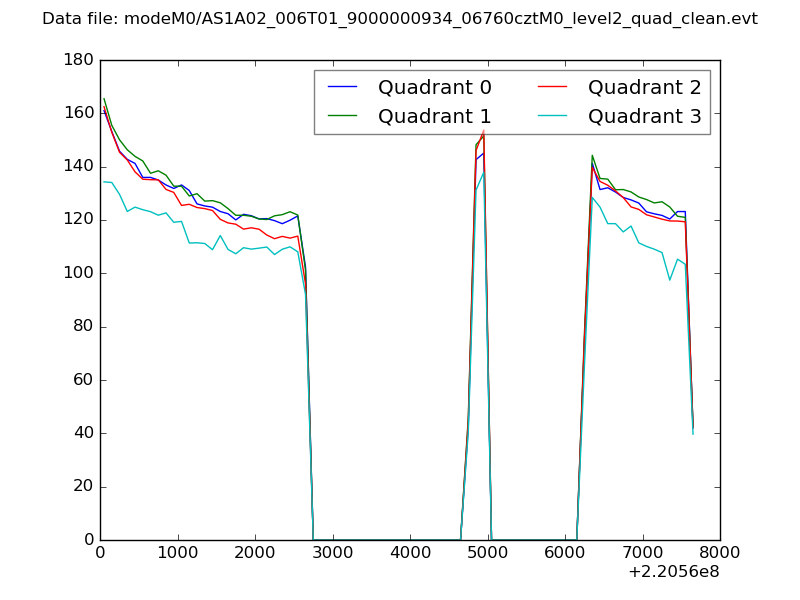 |
|
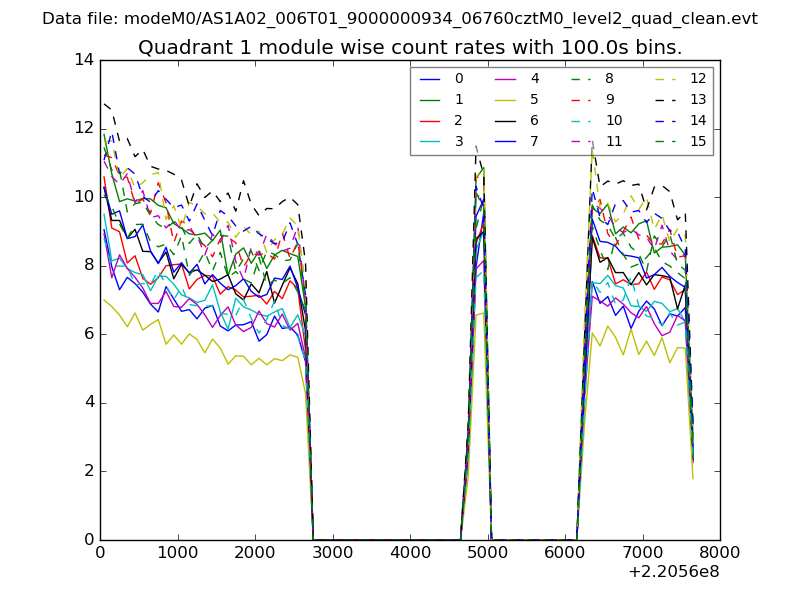
| Module-wise count rates for Quadrant A Data is divided into 100 sec bins |
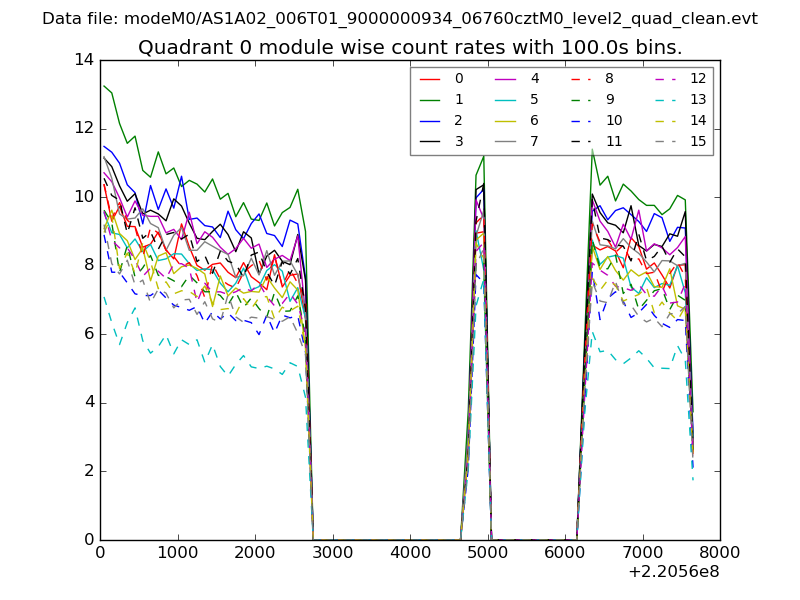 |
 |
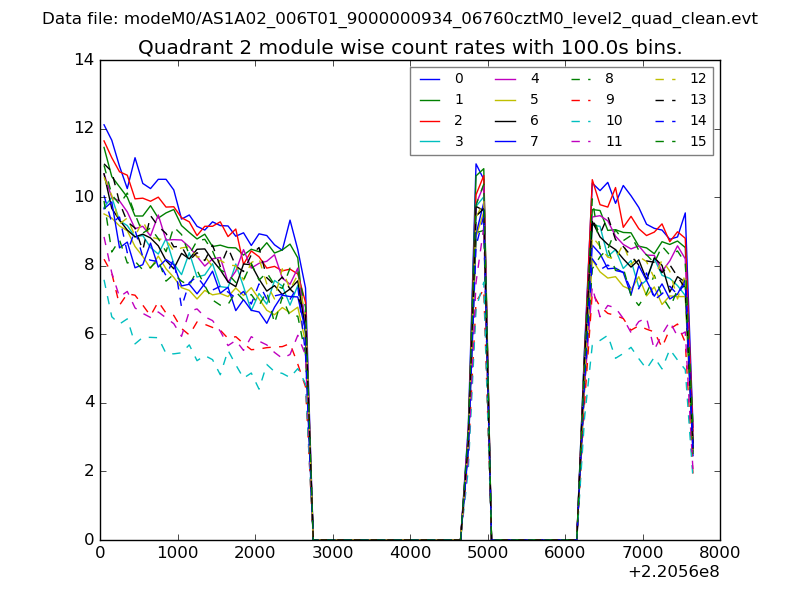
| Module-wise count rates for Quadrant B Data is divided into 100 sec bins |
 |
 |
| Module-wise count rates for Quadrant C Data is divided into 100 sec bins |
 |
 |
| Module-wise count rates for Quadrant D Data is divided into 100 sec bins |
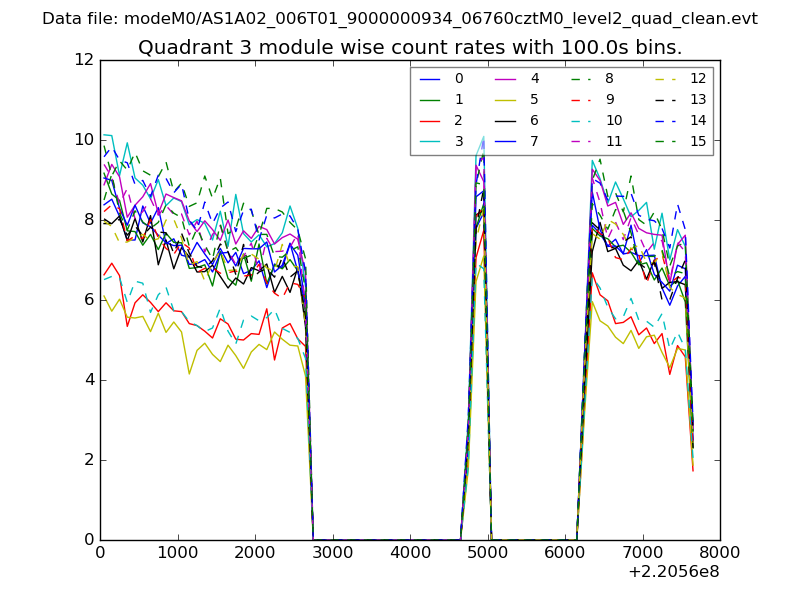 |
 |
| Parameter | Plot |
|---|---|
| CZT HV Monitor | 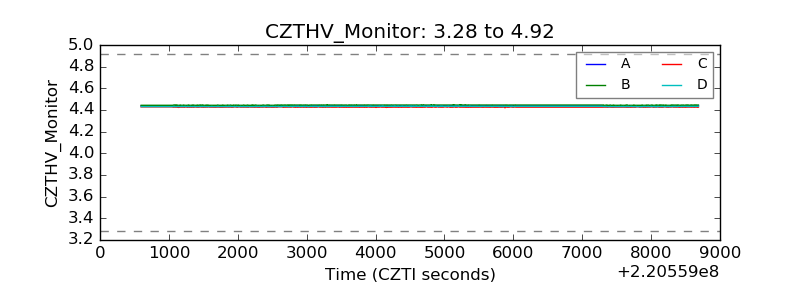 |
| D_VDD | 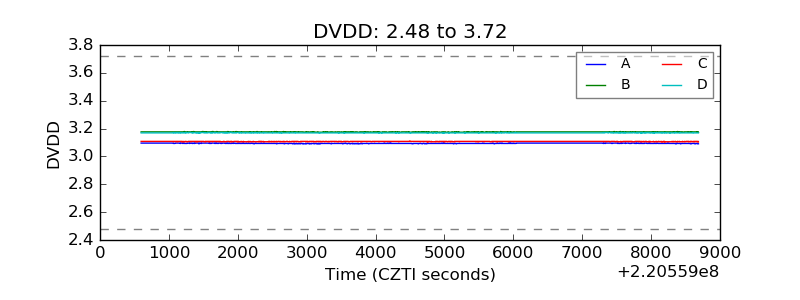 |
| Temperature 1 | 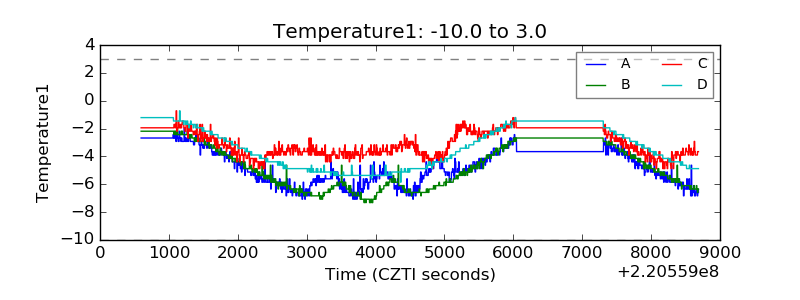 |
| Veto HV Monitor | 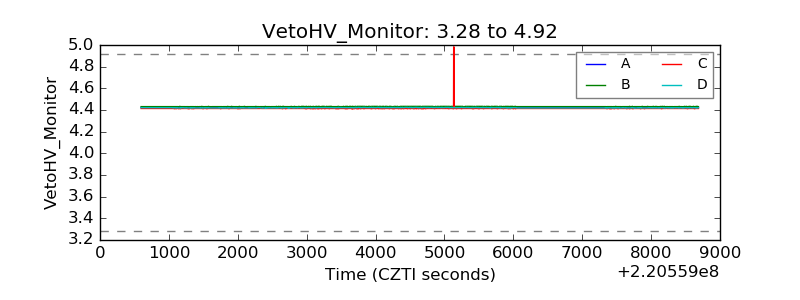 |
| Veto LLD | 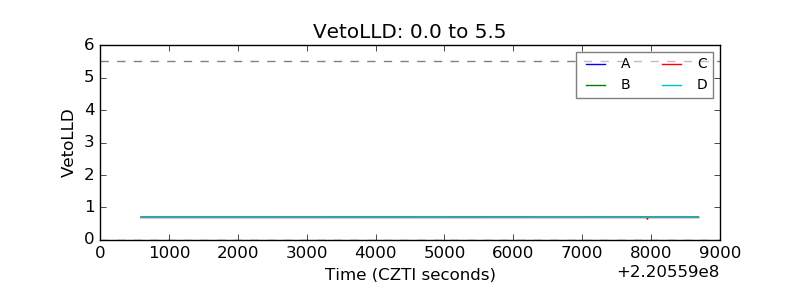 |
| Alpha Counter | 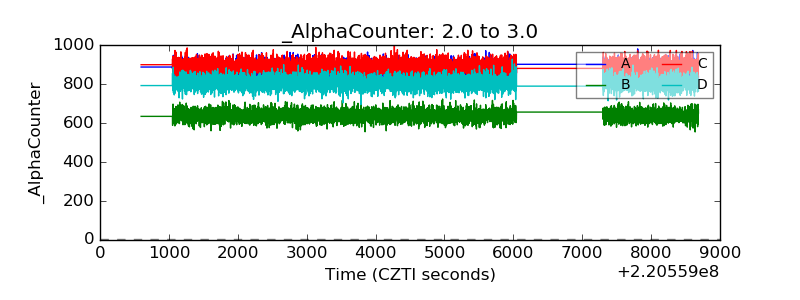 |
| _CPM_Rate | 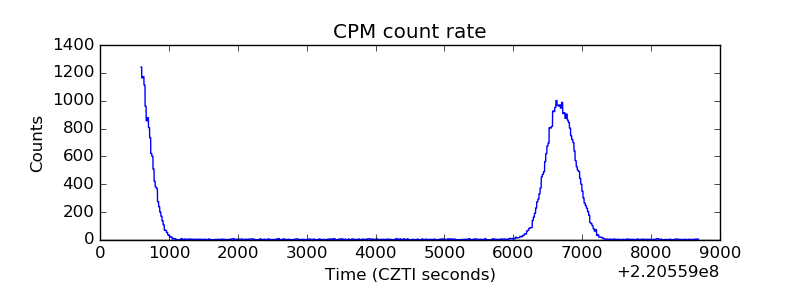 |
| CZT Counter | 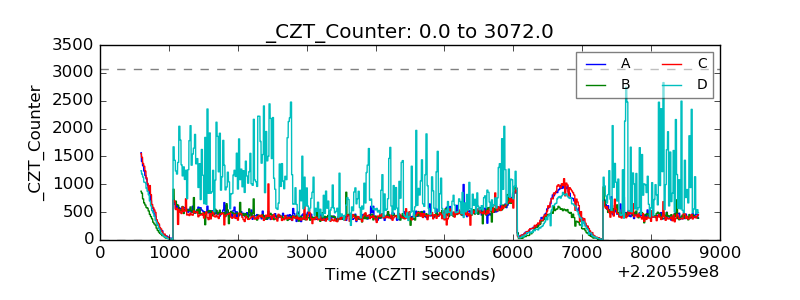 |
| +2.5 Volts monitor |  |
| +5 Volts monitor |  |
| _ROLL_ROT | 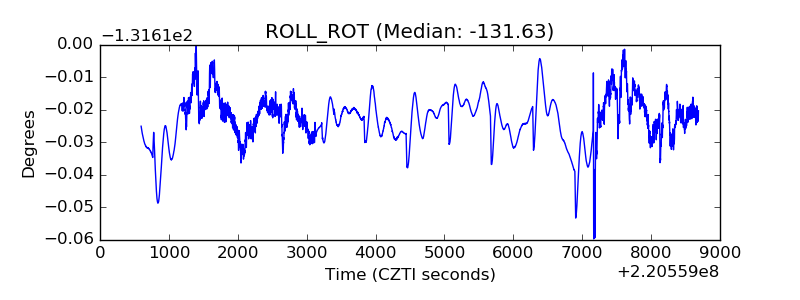 |
| _Roll_DEC | 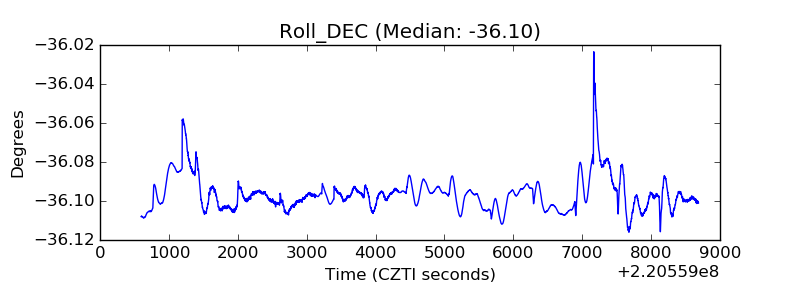 |
| _Roll_RA | 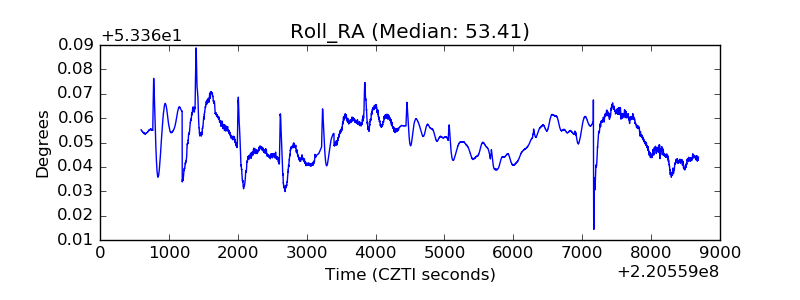 |
| Veto Counter | 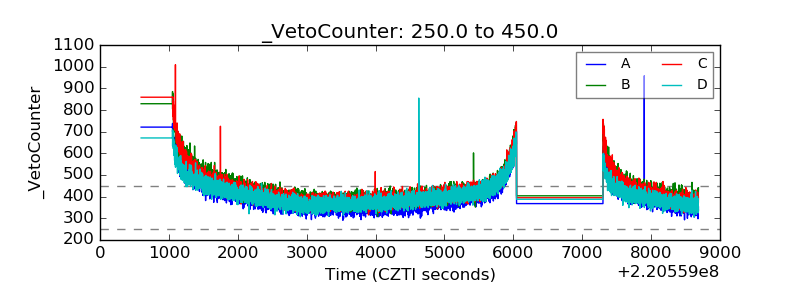 |