| Param | Original file | Final file |
|---|---|---|
| Filename | modeM0/AS1A02_006T01_9000000934_06761cztM0_level2.evt | modeM0/AS1A02_006T01_9000000934_06761cztM0_level2_quad_clean.evt |
| Size (bytes) | 528,632,640 | 90,218,880 |
| Size | 504.1 MB | 86.0 MB |
| Events in quadrant A | 3,062,674 | 582,048 |
| Events in quadrant B | 3,099,993 | 592,703 |
| Events in quadrant C | 2,963,996 | 573,958 |
| Events in quadrant D | 6,421,420 | 509,073 |
| Mode M9 | |||
|---|---|---|---|
| Quadrant | BADHDUFLAG | Total packets | Discarded packets |
| A | 0 | 13 | 0 |
| B | 0 | 13 | 0 |
| C | 0 | 13 | 0 |
| D | 0 | 14 | 0 |
| Mode M0 | |||
|---|---|---|---|
| Quadrant | BADHDUFLAG | Total packets | Discarded packets |
| A | 0 | 14013 | 3 |
| B | 0 | 13935 | 2 |
| C | 0 | 13826 | 2 |
| D | 0 | 23781 | 2 |
| Mode SS | |||
|---|---|---|---|
| Quadrant | BADHDUFLAG | Total packets | Discarded packets |
| A | 0 | 138 | 0 |
| B | 0 | 138 | 0 |
| C | 0 | 138 | 0 |
| D | 0 | 138 | 0 |
| Quadrant | Total seconds | Saturated seconds | Saturation percentage |
|---|---|---|---|
| A | 6802 | 8 | 0.117612% |
| B | 6802 | 12 | 0.176419% |
| C | 6802 | 3 | 0.044105% |
| D | 6802 | 700 | 10.291091% |
Noise dominated data is calculated using 1-second bins in cleaned event files. If a bin has >2000 counts, and if more than 50% of those come from <1% of pixels, then it is considered to be noise-dominated and hence unusable.
| Quadrant | # 1 sec bins | Bins with >0 counts | Bins with >2000 counts | High rate bins dominated by noise | Noise dominated (total time) | Noise dominated (detector-on time) | Marked lightcurve |
|---|---|---|---|---|---|---|---|
| A | 7907 | 6803 | 2 | 2 | 0.03% | 0.03% | 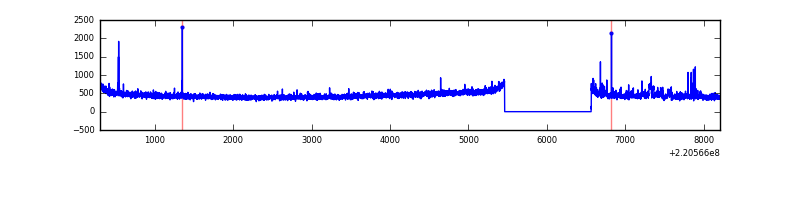 |
| B | 7907 | 6803 | 1 | 1 | 0.01% | 0.01% | 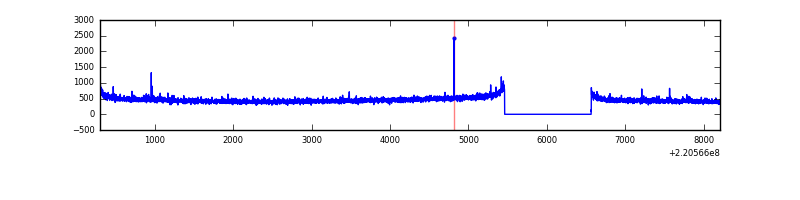 |
| C | 7907 | 6803 | 2 | 2 | 0.03% | 0.03% | 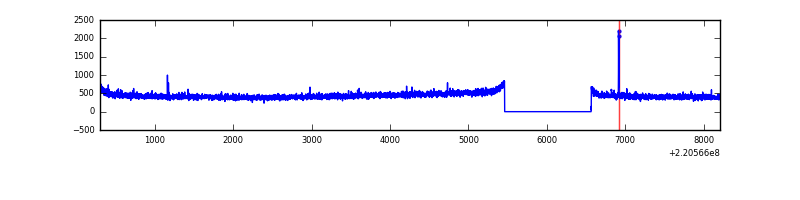 |
| D | 7907 | 6803 | 569 | 569 | 7.20% | 8.36% | 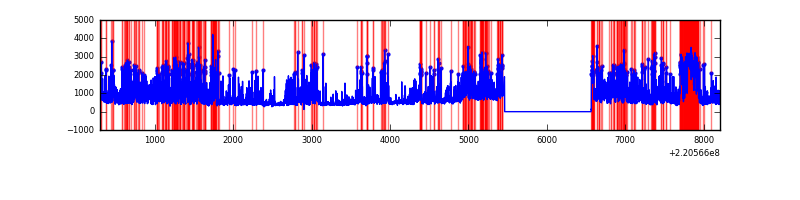 |
Top three noisy pixels from each quadrant. If the there are fewer than three noisy pixels in the level2.evt file, extra rows are filled as -1
| Pixel properties | Quadrant properties | ||||||
|---|---|---|---|---|---|---|---|
| Quadrant | DetID | PixID | Counts | Sigma | Mean | Median | Sigma |
| A | 14 | 111 | 38553 | 239.92 | 775 | 760 | 157.5 |
| A | 8 | 15 | 27494 | 169.71 | 775 | 760 | 157.5 |
| A | 13 | 248 | 14017 | 84.16 | 775 | 760 | 157.5 |
| B | 0 | 214 | 16100 | 101.61 | 788 | 769 | 150.9 |
| B | 12 | 111 | 15073 | 94.8 | 788 | 769 | 150.9 |
| B | 11 | 111 | 11866 | 73.55 | 788 | 769 | 150.9 |
| C | 12 | 4 | 14466 | 78.08 | 754 | 758 | 175.6 |
| C | 13 | 61 | 5872 | 29.13 | 754 | 758 | 175.6 |
| C | 14 | 67 | 3848 | 17.6 | 754 | 758 | 175.6 |
| D | 12 | 220 | 2596170 | 14791.02 | 713 | 690 | 175.5 |
| D | 2 | 216 | 580150 | 3302.2 | 713 | 690 | 175.5 |
| D | 2 | 33 | 218368 | 1240.5 | 713 | 690 | 175.5 |
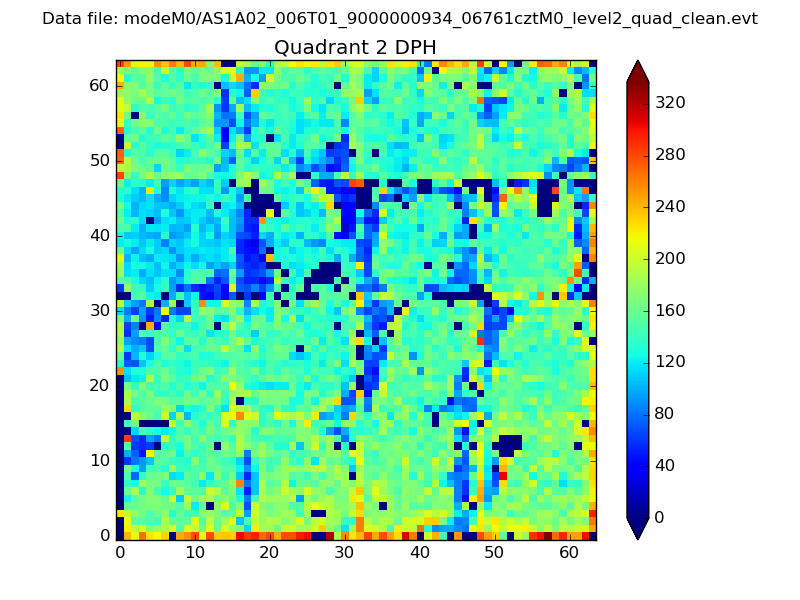
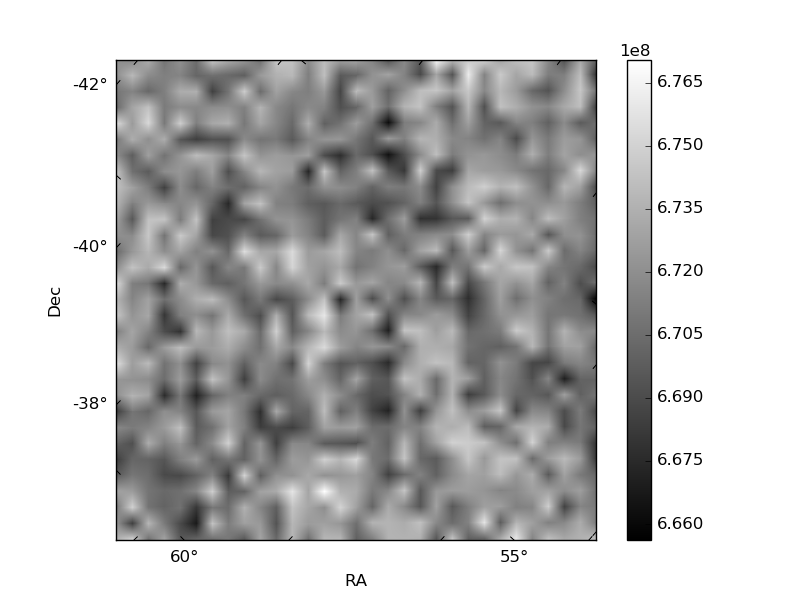
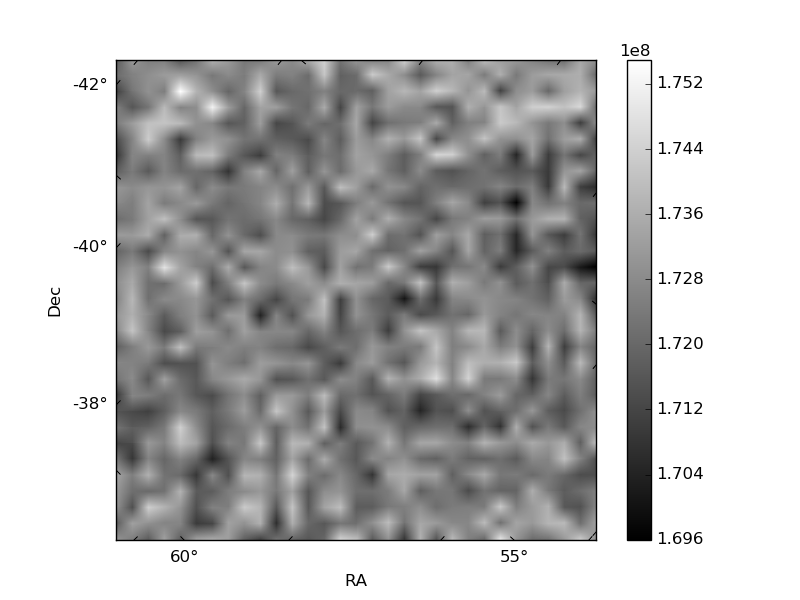
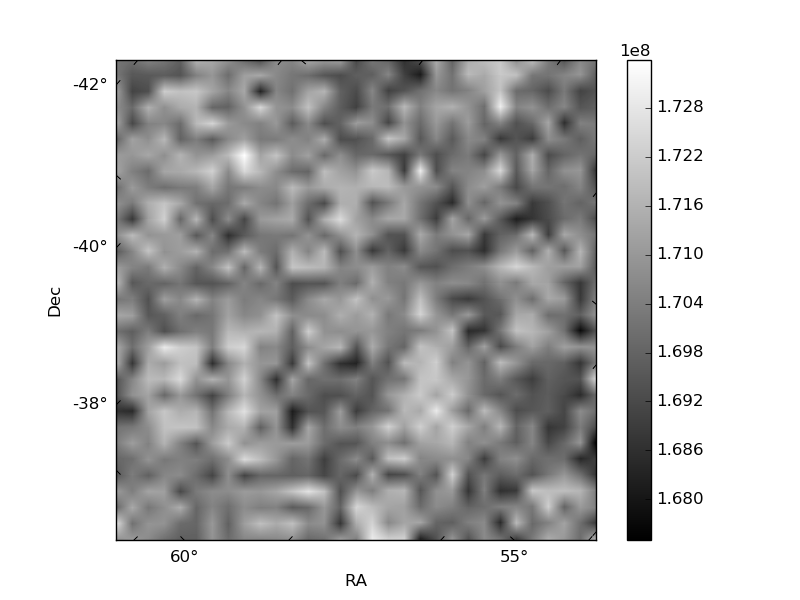
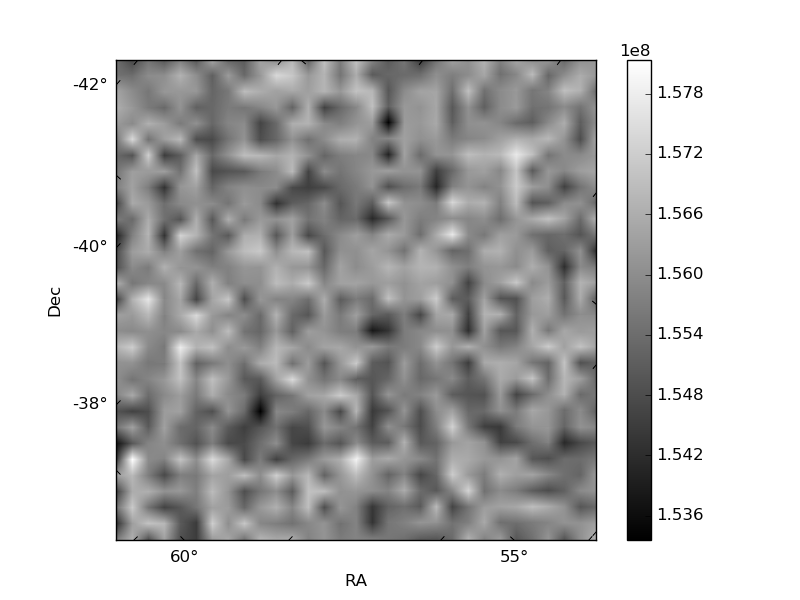
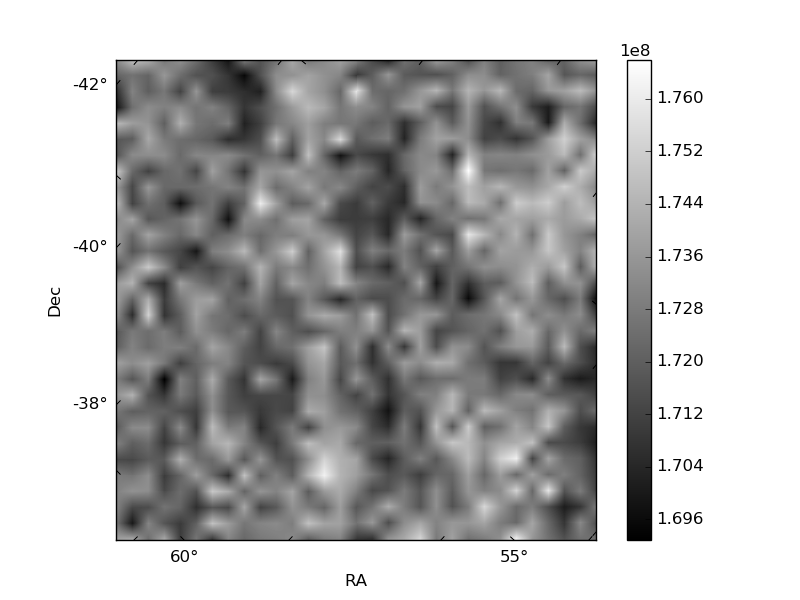
Histogram calculated using DETX and DETY for each event in the final _common_clean file
| Quadrant A | 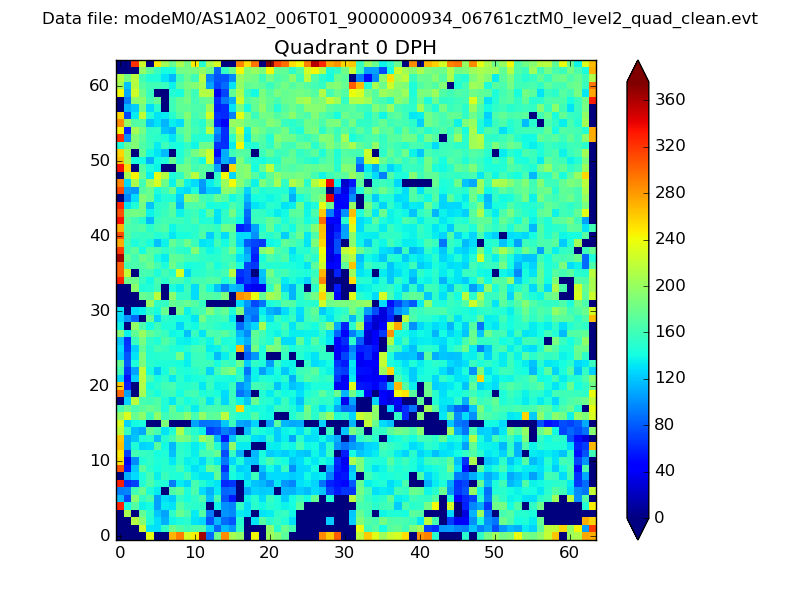 |
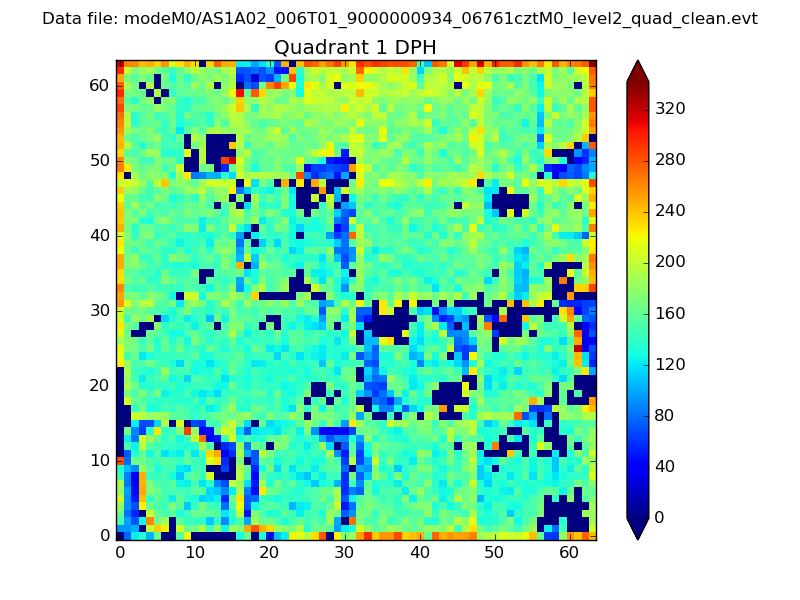 |
Quadrant B |
|---|---|---|---|
| Quadrant D | 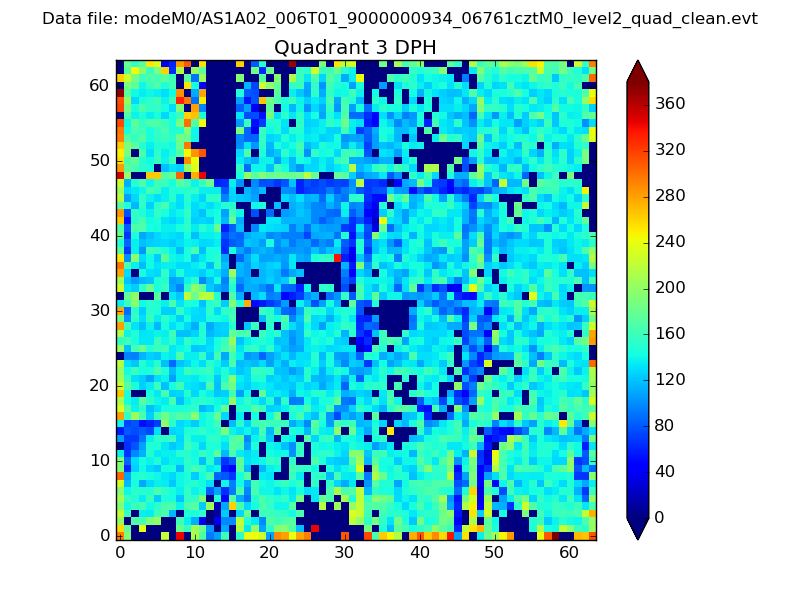 |
 |
Quadrant C |
| Plot type | Count rate plots | Images |
|---|---|---|
| Comparison with Poisson distribution Blue bars denote a histogram of data divided into 1 sec bins. Red curve is a Poisson curve with rate = median count rate of data. |
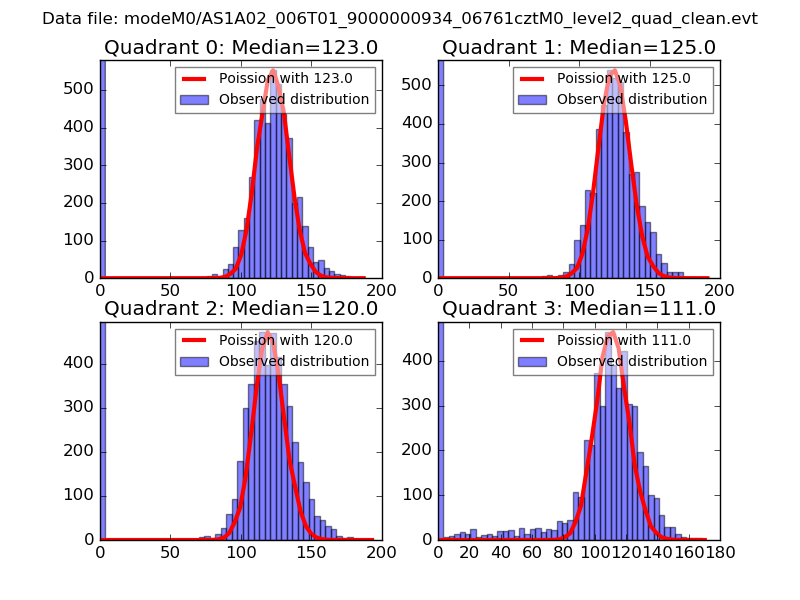 |
 |
| Quadrant-wise count rates Data is divided into 100 sec bins |
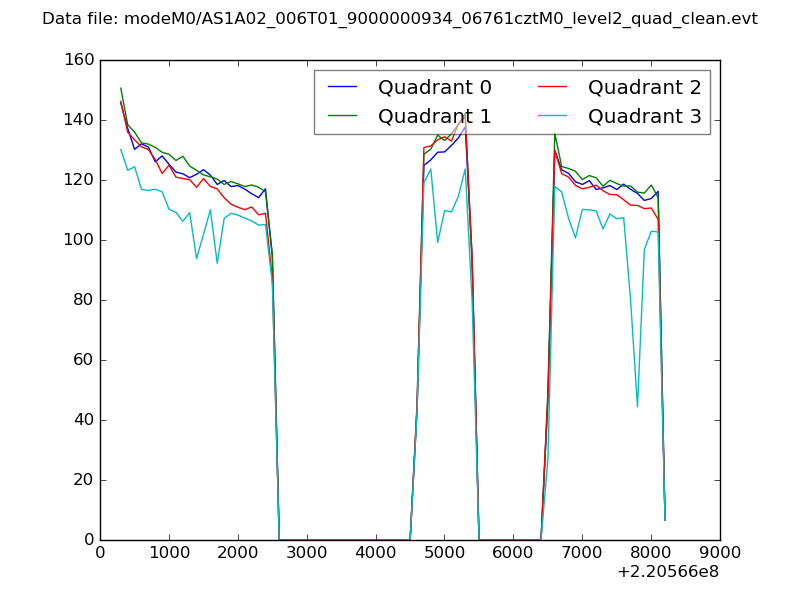 |
|
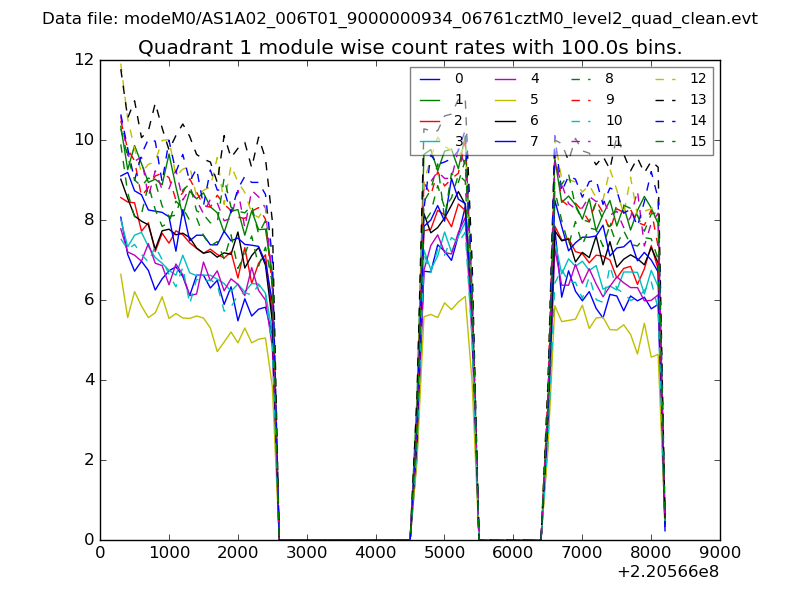
| Module-wise count rates for Quadrant A Data is divided into 100 sec bins |
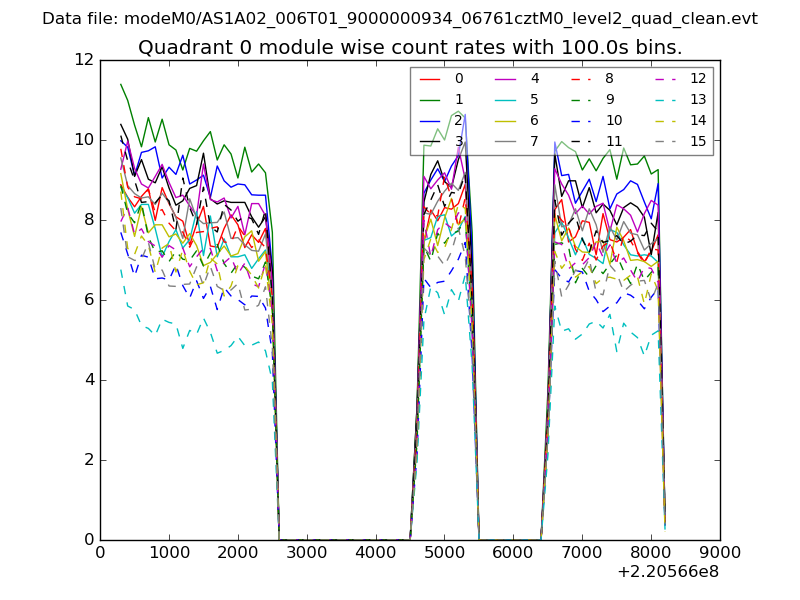 |
 |
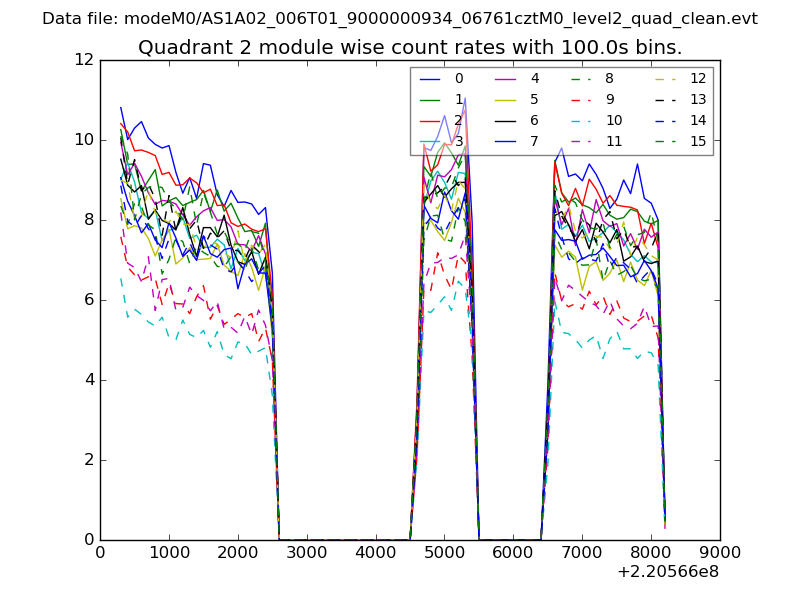
| Module-wise count rates for Quadrant B Data is divided into 100 sec bins |
 |
 |
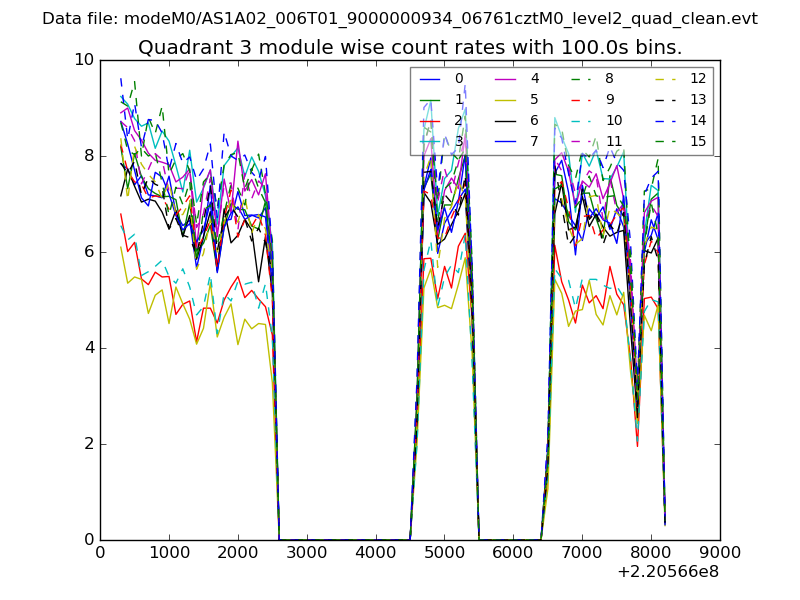
| Module-wise count rates for Quadrant C Data is divided into 100 sec bins |
 |
 |
| Module-wise count rates for Quadrant D Data is divided into 100 sec bins |
 |
 |
| Parameter | Plot |
|---|---|
| CZT HV Monitor | 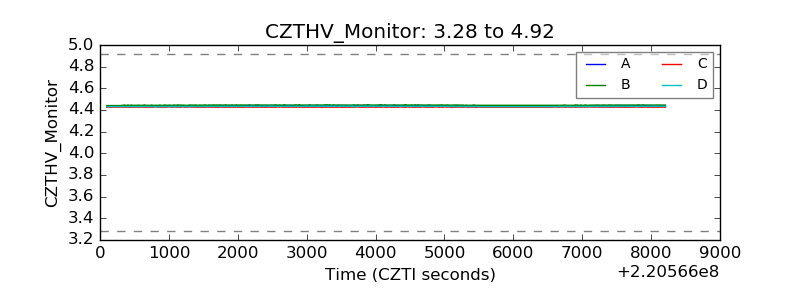 |
| D_VDD | 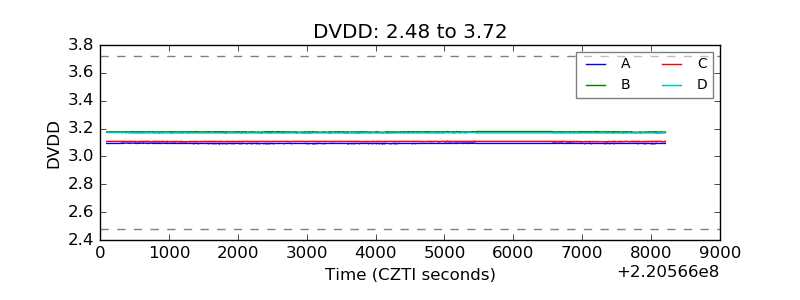 |
| Temperature 1 | 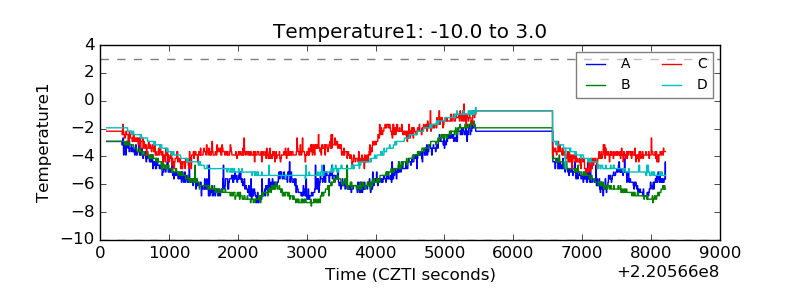 |
| Veto HV Monitor | 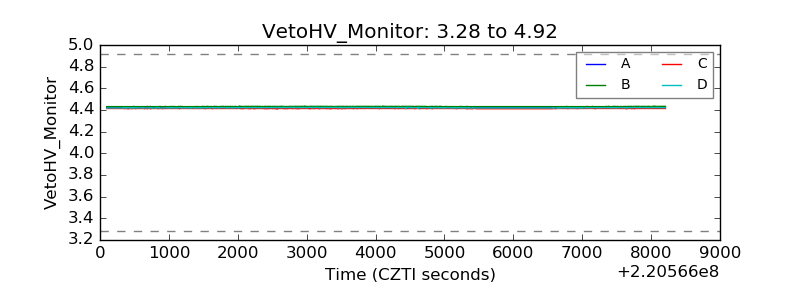 |
| Veto LLD | 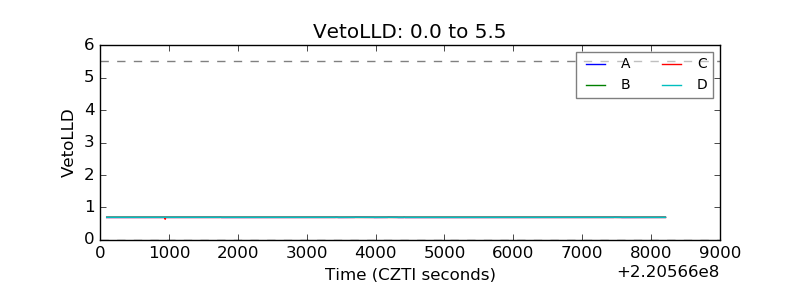 |
| Alpha Counter | 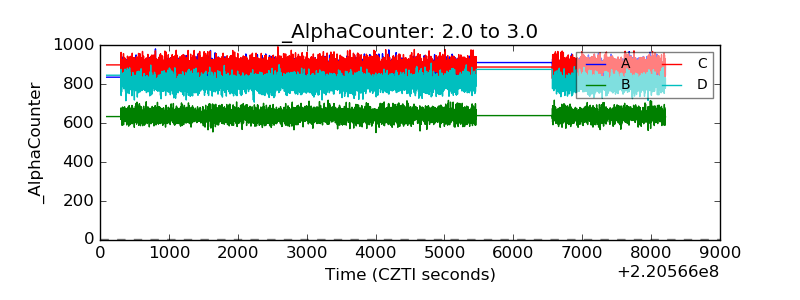 |
| _CPM_Rate | 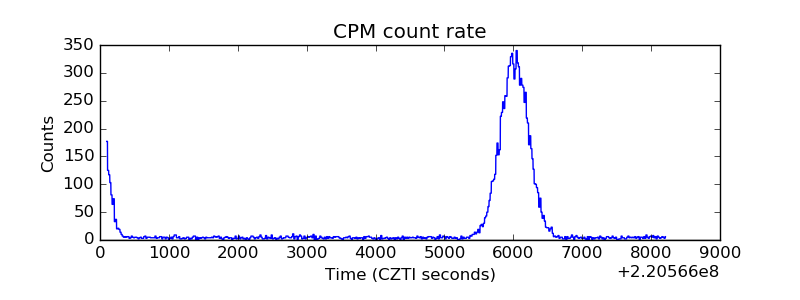 |
| CZT Counter | 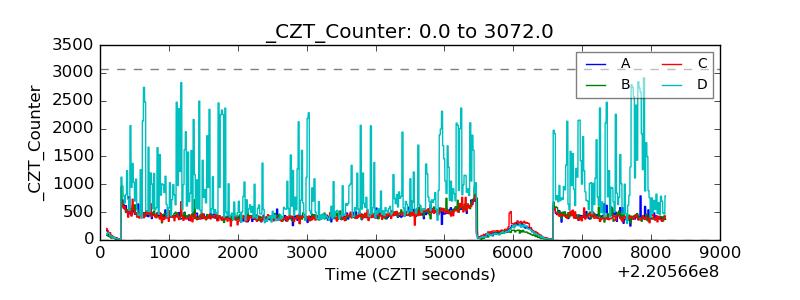 |
| +2.5 Volts monitor |  |
| +5 Volts monitor | 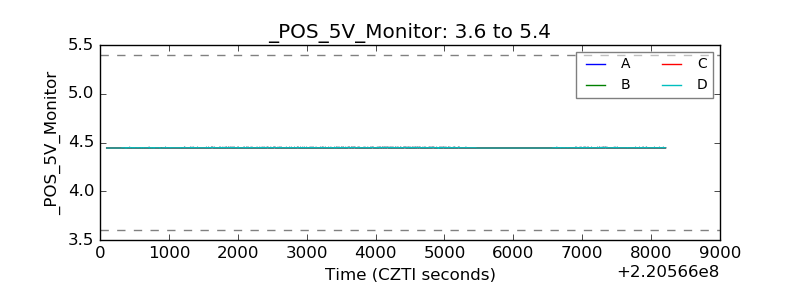 |
| _ROLL_ROT | 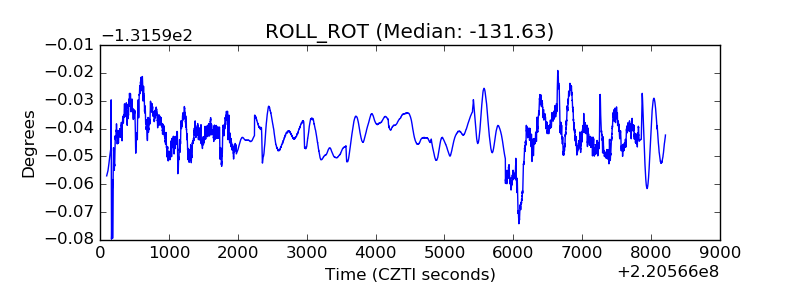 |
| _Roll_DEC | 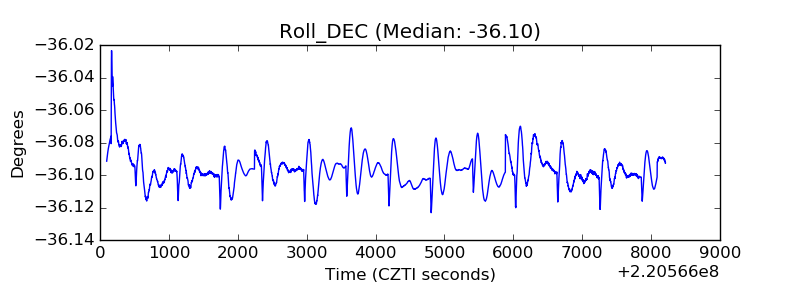 |
| _Roll_RA | 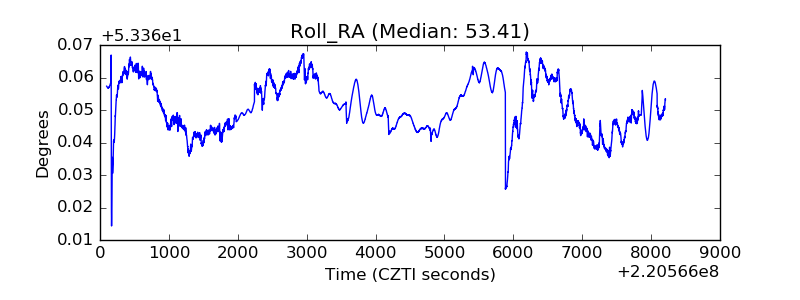 |
| Veto Counter | 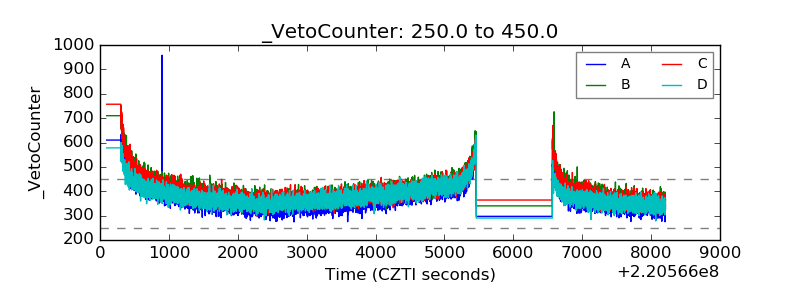 |