| Param | Original file | Final file |
|---|---|---|
| Filename | modeM0/AS1A02_006T01_9000000934_06762cztM0_level2.evt | modeM0/AS1A02_006T01_9000000934_06762cztM0_level2_quad_clean.evt |
| Size (bytes) | 561,908,160 | 94,386,240 |
| Size | 535.9 MB | 90.0 MB |
| Events in quadrant A | 3,245,932 | 605,721 |
| Events in quadrant B | 3,303,281 | 611,732 |
| Events in quadrant C | 3,166,461 | 597,556 |
| Events in quadrant D | 6,809,063 | 537,461 |
| Mode M9 | |||
|---|---|---|---|
| Quadrant | BADHDUFLAG | Total packets | Discarded packets |
| A | 0 | 18 | 0 |
| B | 0 | 18 | 0 |
| C | 0 | 18 | 0 |
| D | 0 | 18 | 0 |
| Mode M0 | |||
|---|---|---|---|
| Quadrant | BADHDUFLAG | Total packets | Discarded packets |
| A | 0 | 14913 | 3 |
| B | 0 | 14887 | 2 |
| C | 0 | 14780 | 2 |
| D | 0 | 25230 | 2 |
| Mode SS | |||
|---|---|---|---|
| Quadrant | BADHDUFLAG | Total packets | Discarded packets |
| A | 0 | 148 | 0 |
| B | 0 | 148 | 0 |
| C | 0 | 148 | 0 |
| D | 0 | 148 | 0 |
| Quadrant | Total seconds | Saturated seconds | Saturation percentage |
|---|---|---|---|
| A | 7267 | 31 | 0.426586% |
| B | 7267 | 42 | 0.577955% |
| C | 7267 | 19 | 0.261456% |
| D | 7267 | 678 | 9.329847% |
Noise dominated data is calculated using 1-second bins in cleaned event files. If a bin has >2000 counts, and if more than 50% of those come from <1% of pixels, then it is considered to be noise-dominated and hence unusable.
| Quadrant | # 1 sec bins | Bins with >0 counts | Bins with >2000 counts | High rate bins dominated by noise | Noise dominated (total time) | Noise dominated (detector-on time) | Marked lightcurve |
|---|---|---|---|---|---|---|---|
| A | 9042 | 7269 | 1 | 1 | 0.01% | 0.01% | 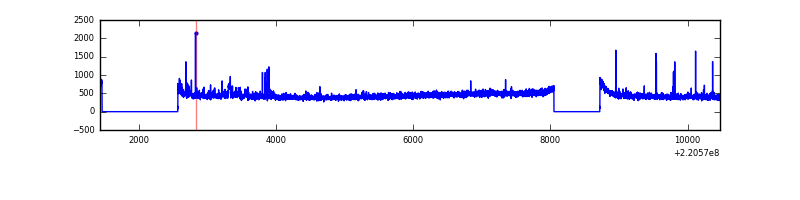 |
| B | 9042 | 7269 | 0 | 0 | 0.00% | 0.00% |  |
| C | 9042 | 7269 | 2 | 2 | 0.02% | 0.03% | 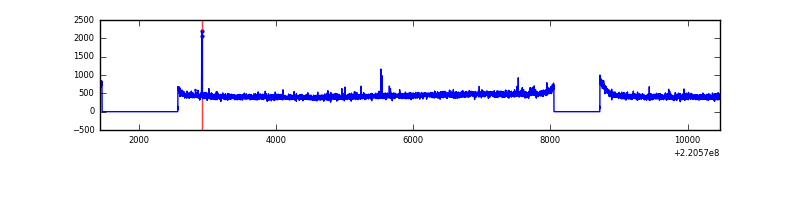 |
| D | 9042 | 7269 | 540 | 540 | 5.97% | 7.43% | 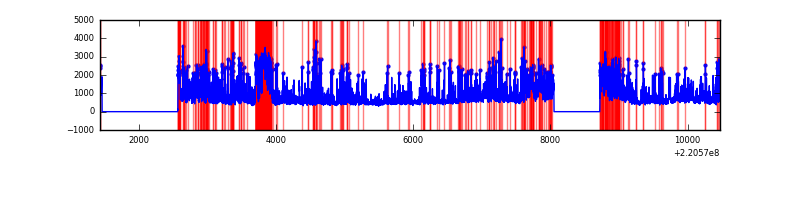 |
Top three noisy pixels from each quadrant. If the there are fewer than three noisy pixels in the level2.evt file, extra rows are filled as -1
| Pixel properties | Quadrant properties | ||||||
|---|---|---|---|---|---|---|---|
| Quadrant | DetID | PixID | Counts | Sigma | Mean | Median | Sigma |
| A | 8 | 15 | 40659 | 236.12 | 822 | 806 | 168.8 |
| A | 14 | 111 | 35416 | 205.05 | 822 | 806 | 168.8 |
| A | 0 | 226 | 7768 | 41.25 | 822 | 806 | 168.8 |
| B | 4 | 81 | 23336 | 140.7 | 835 | 815 | 160.1 |
| B | 0 | 214 | 16577 | 98.47 | 835 | 815 | 160.1 |
| B | 12 | 111 | 15914 | 94.33 | 835 | 815 | 160.1 |
| C | 12 | 4 | 12368 | 61.55 | 803 | 804 | 187.9 |
| C | 9 | 16 | 9611 | 46.87 | 803 | 804 | 187.9 |
| C | 13 | 61 | 6355 | 29.54 | 803 | 804 | 187.9 |
| D | 12 | 220 | 2466127 | 13066.91 | 765 | 738 | 188.7 |
| D | 2 | 216 | 705897 | 3737.44 | 765 | 738 | 188.7 |
| D | 8 | 195 | 306040 | 1618.14 | 765 | 738 | 188.7 |
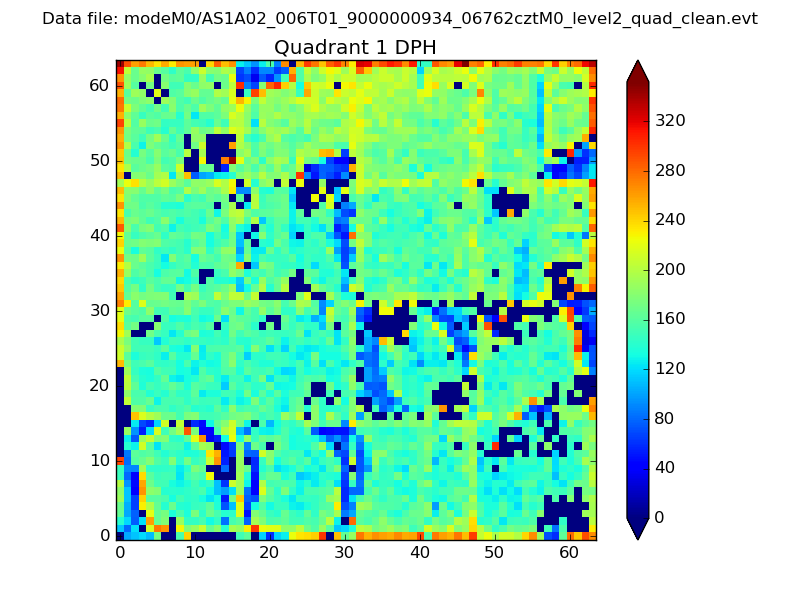
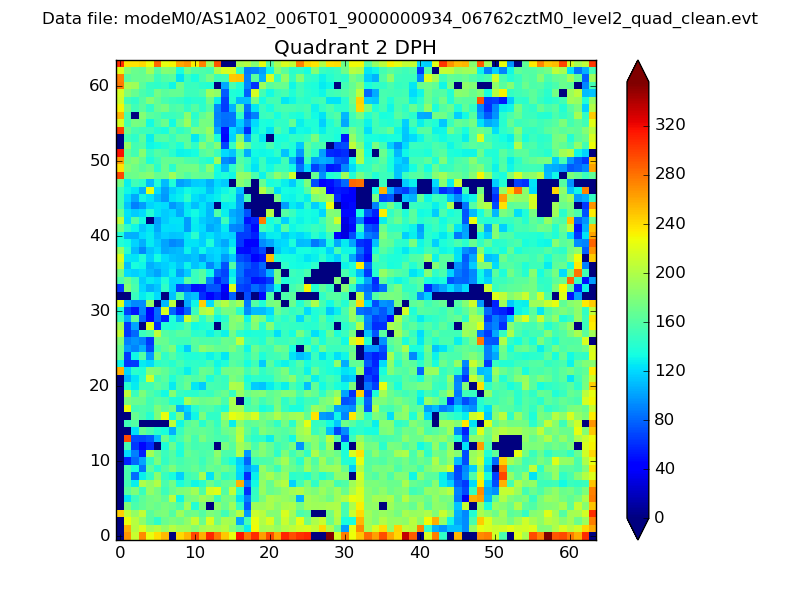
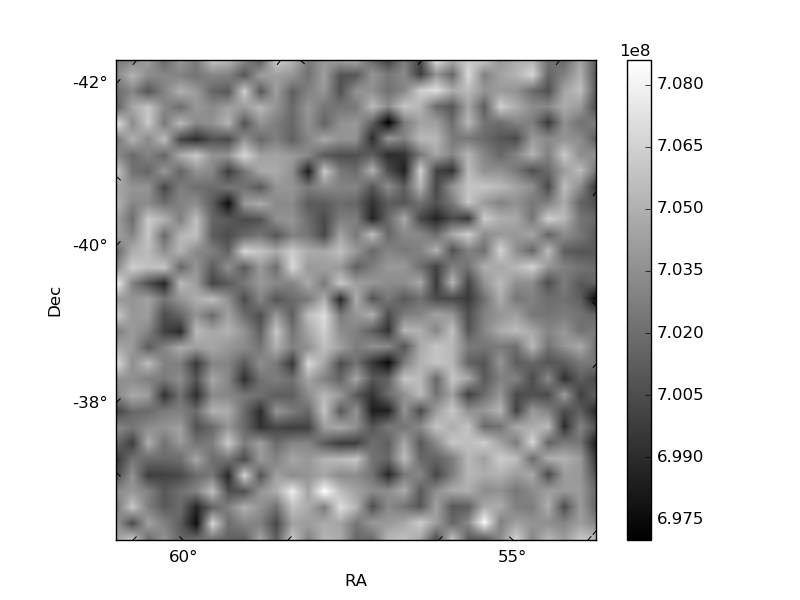
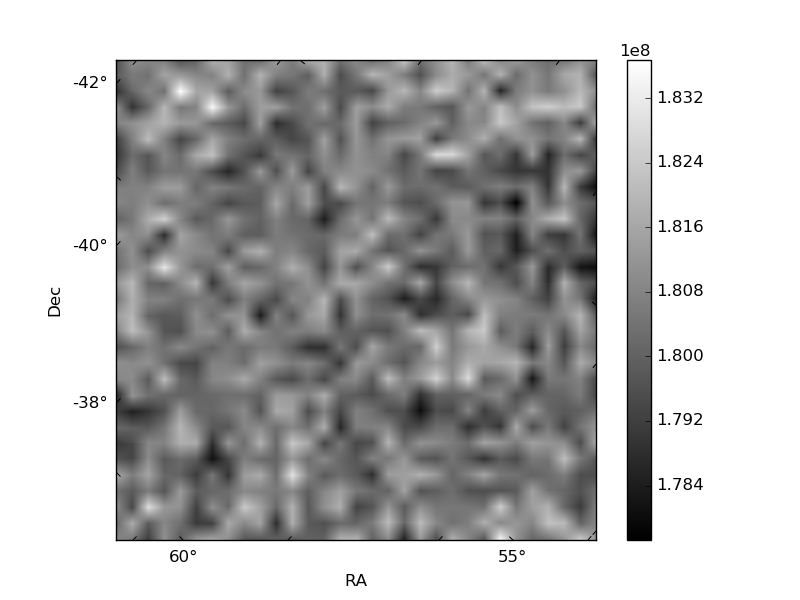
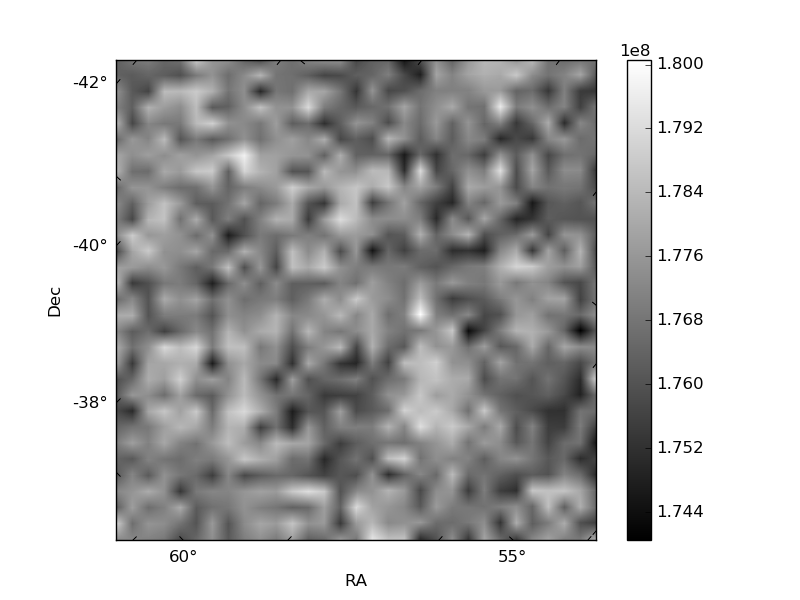
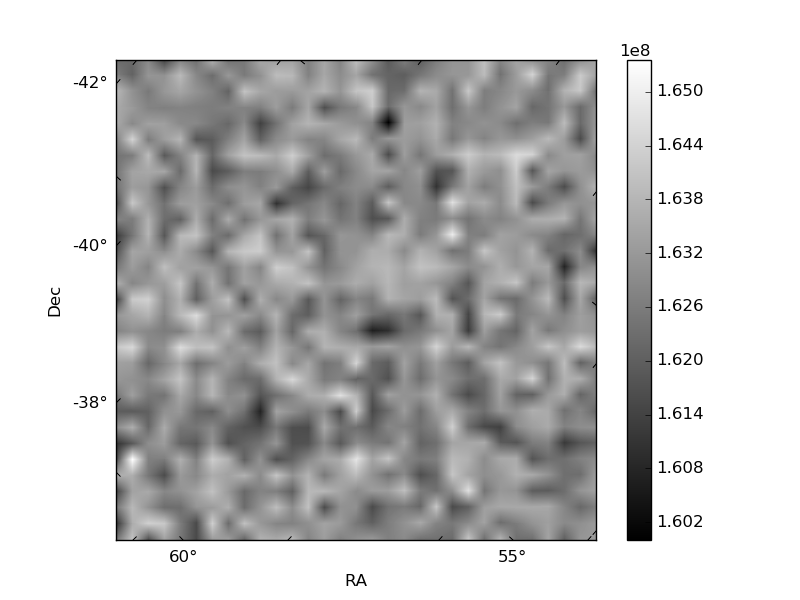
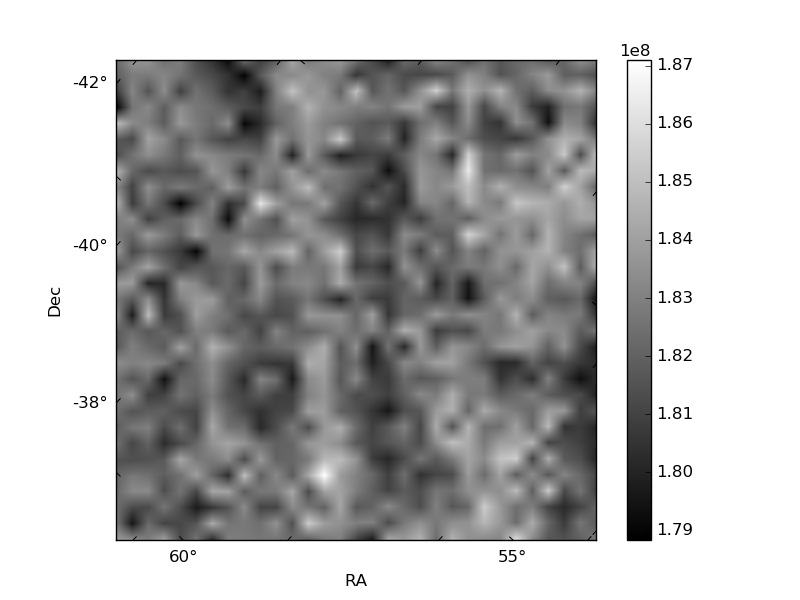
Histogram calculated using DETX and DETY for each event in the final _common_clean file
| Quadrant A | 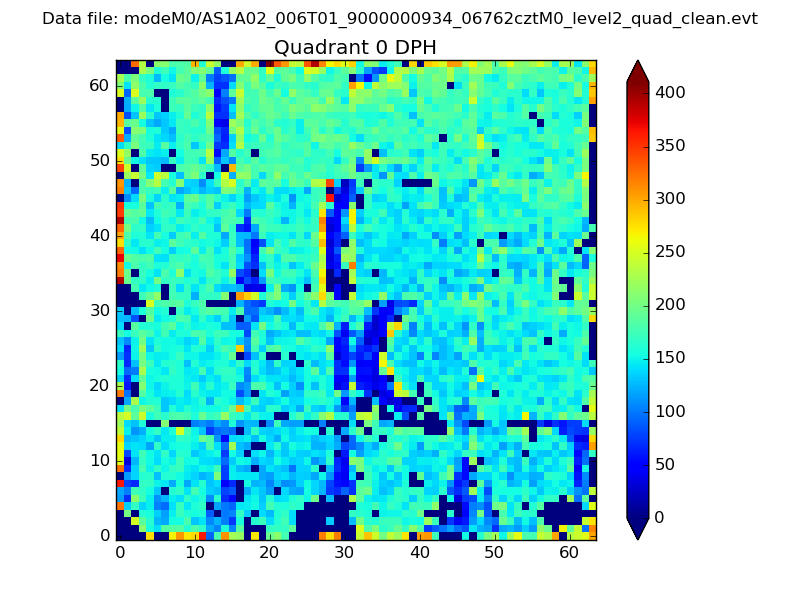 |
 |
Quadrant B |
|---|---|---|---|
| Quadrant D | 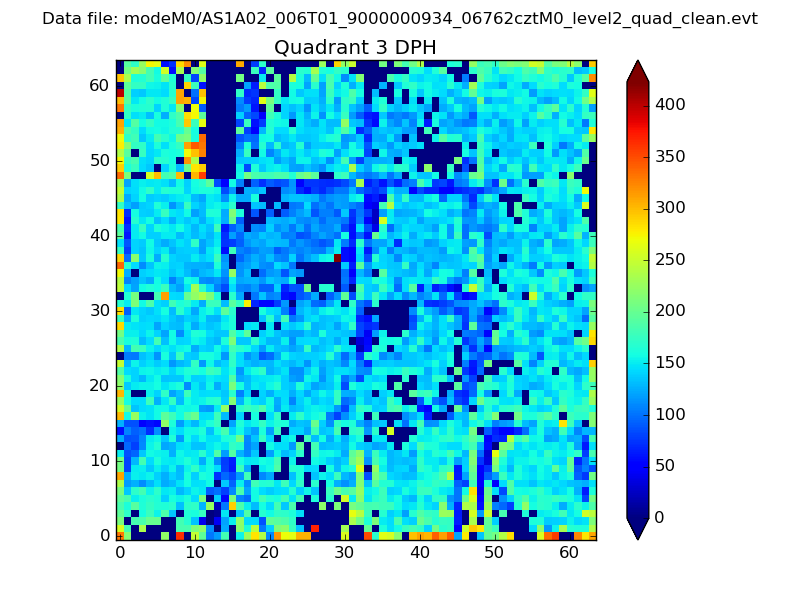 |
 |
Quadrant C |
| Plot type | Count rate plots | Images |
|---|---|---|
| Comparison with Poisson distribution Blue bars denote a histogram of data divided into 1 sec bins. Red curve is a Poisson curve with rate = median count rate of data. |
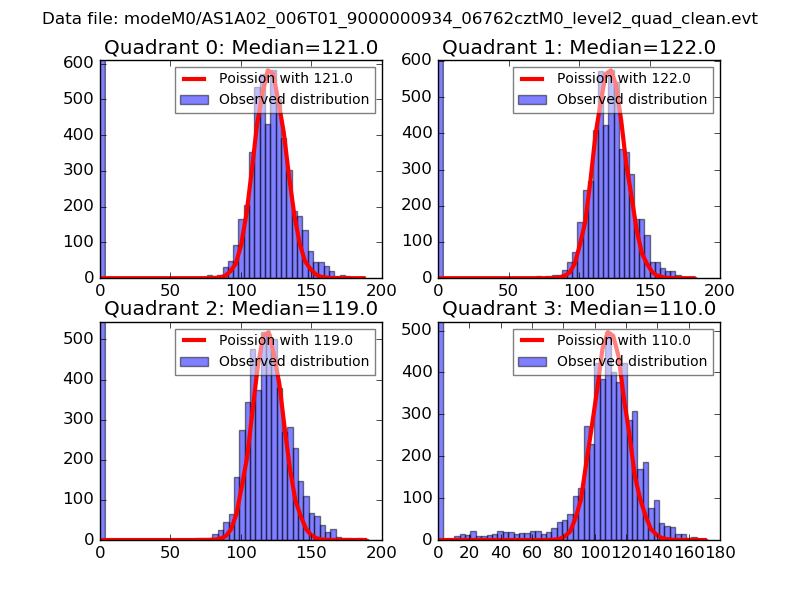 |
 |
| Quadrant-wise count rates Data is divided into 100 sec bins |
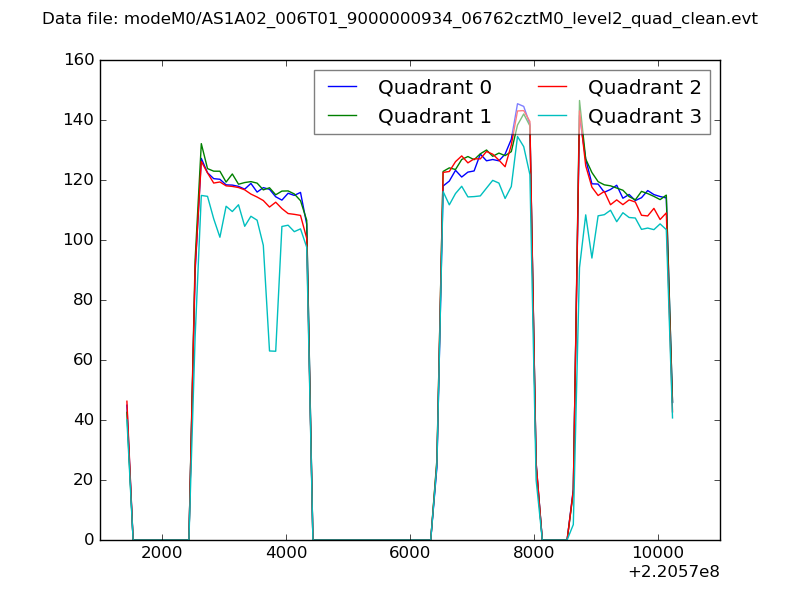 |
|
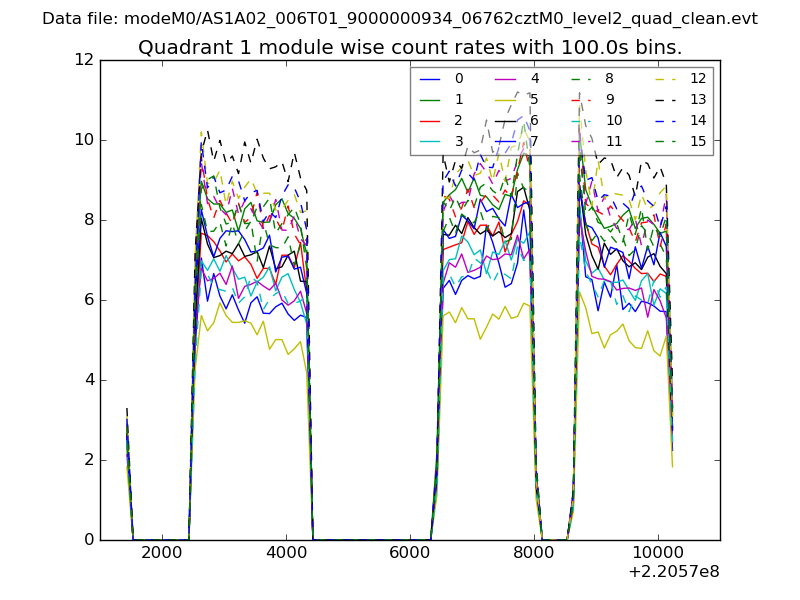
| Module-wise count rates for Quadrant A Data is divided into 100 sec bins |
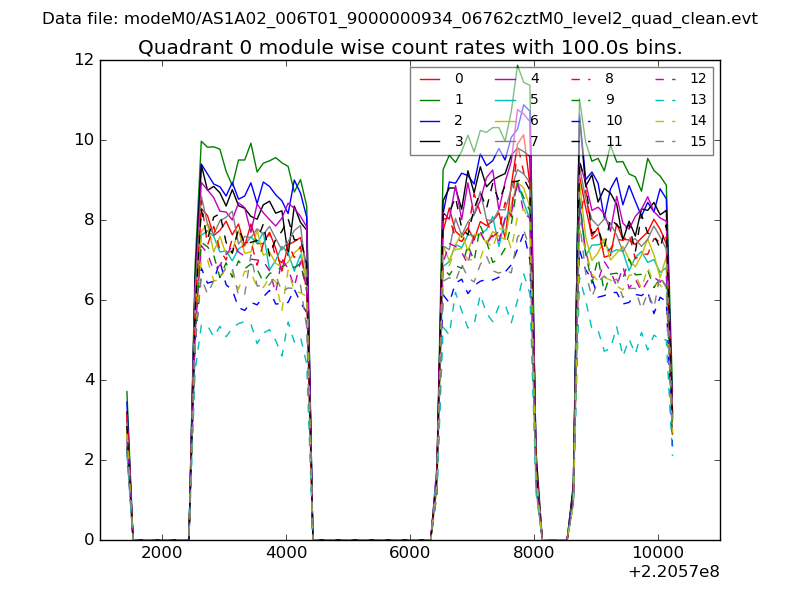 |
 |
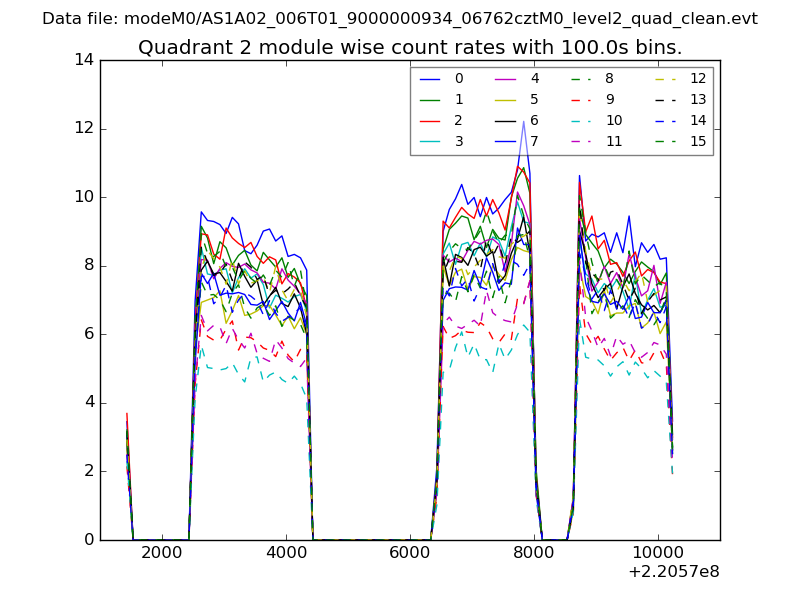
| Module-wise count rates for Quadrant B Data is divided into 100 sec bins |
 |
 |
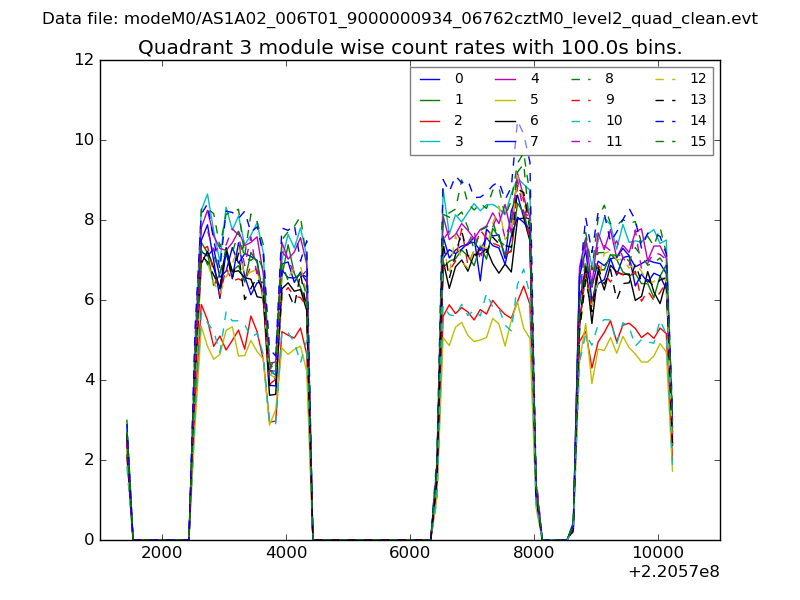
| Module-wise count rates for Quadrant C Data is divided into 100 sec bins |
 |
 |
| Module-wise count rates for Quadrant D Data is divided into 100 sec bins |
 |
 |
| Parameter | Plot |
|---|---|
| CZT HV Monitor | 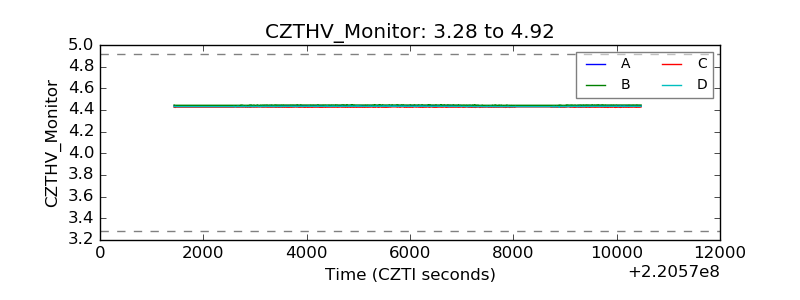 |
| D_VDD | 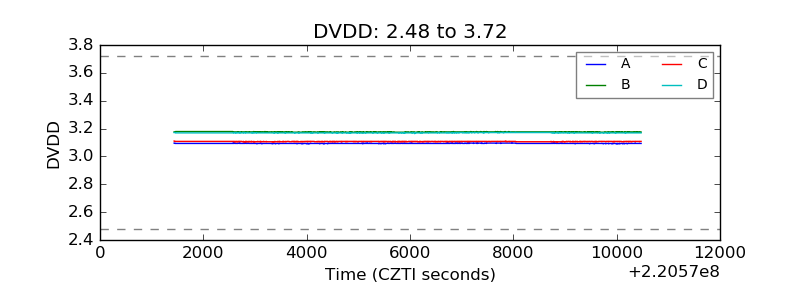 |
| Temperature 1 | 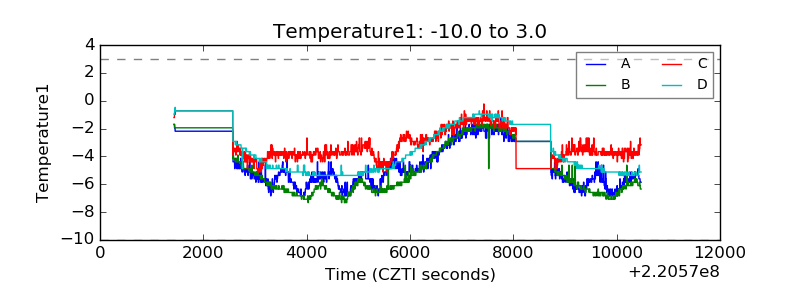 |
| Veto HV Monitor | 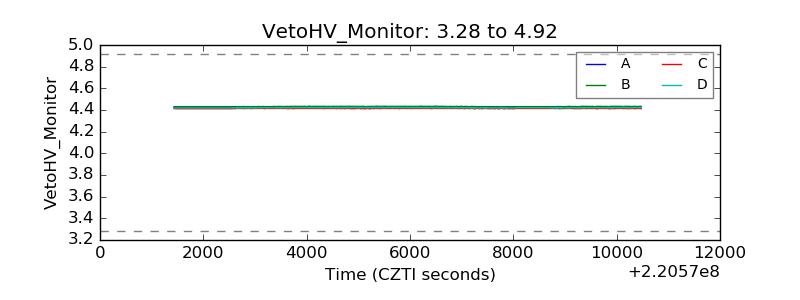 |
| Veto LLD | 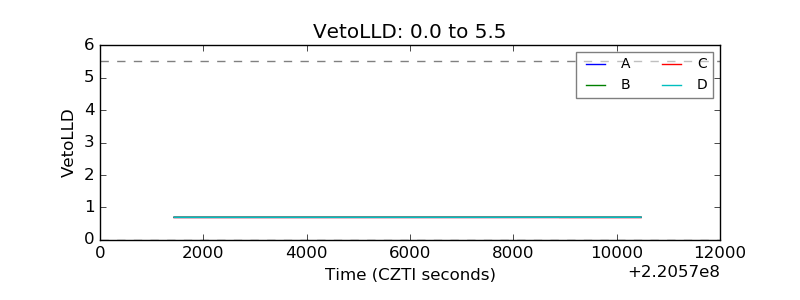 |
| Alpha Counter | 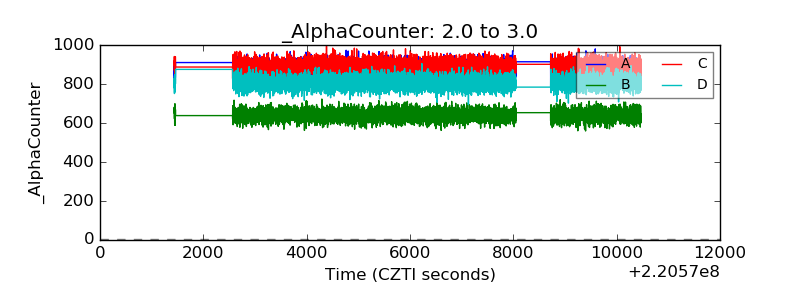 |
| _CPM_Rate | 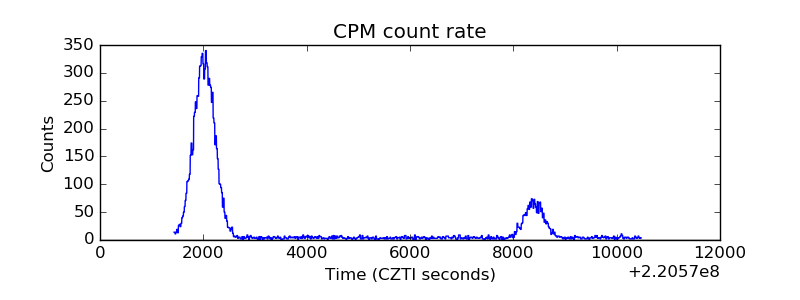 |
| CZT Counter | 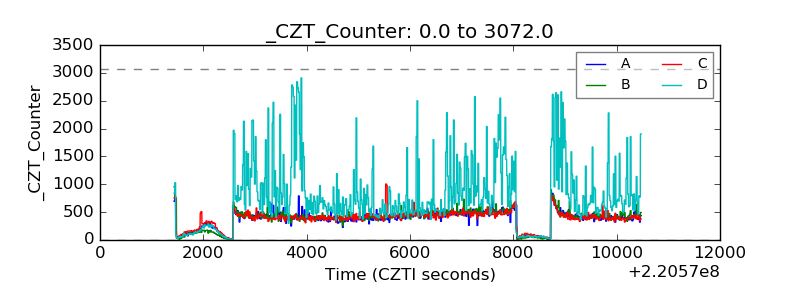 |
| +2.5 Volts monitor |  |
| +5 Volts monitor |  |
| _ROLL_ROT | 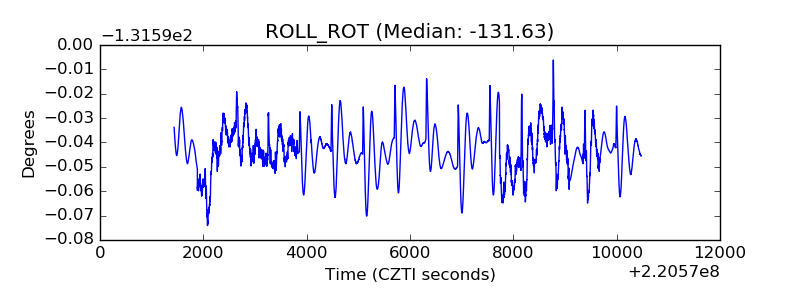 |
| _Roll_DEC | 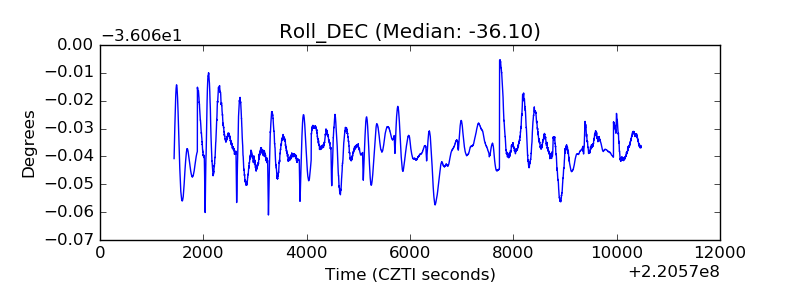 |
| _Roll_RA | 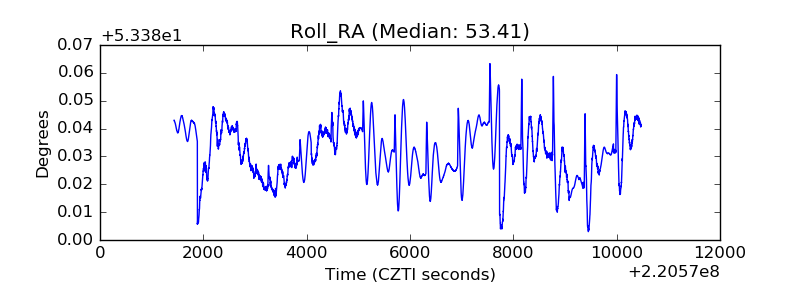 |
| Veto Counter | 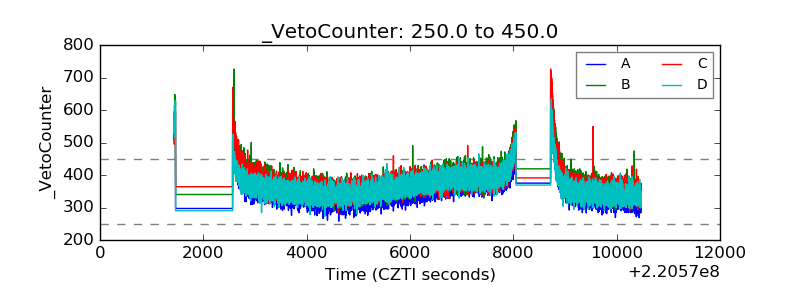 |