| Param | Original file | Final file |
|---|---|---|
| Filename | modeM0/AS1A02_006T01_9000000934_06763cztM0_level2.evt | modeM0/AS1A02_006T01_9000000934_06763cztM0_level2_quad_clean.evt |
| Size (bytes) | 1,433,502,720 | 222,436,800 |
| Size | 1.3 GB | 212.1 MB |
| Events in quadrant A | 8,246,372 | 1,404,019 |
| Events in quadrant B | 8,519,613 | 1,422,372 |
| Events in quadrant C | 8,040,639 | 1,390,227 |
| Events in quadrant D | 17,364,621 | 1,251,408 |
| Mode M9 | |||
|---|---|---|---|
| Quadrant | BADHDUFLAG | Total packets | Discarded packets |
| A | 0 | 23 | 0 |
| B | 0 | 23 | 0 |
| C | 0 | 23 | 0 |
| D | 0 | 24 | 0 |
| Mode M0 | |||
|---|---|---|---|
| Quadrant | BADHDUFLAG | Total packets | Discarded packets |
| A | 0 | 37800 | 5 |
| B | 0 | 38004 | 4 |
| C | 0 | 37438 | 4 |
| D | 0 | 64295 | 4 |
| Mode SS | |||
|---|---|---|---|
| Quadrant | BADHDUFLAG | Total packets | Discarded packets |
| A | 0 | 374 | 0 |
| B | 0 | 374 | 0 |
| C | 0 | 374 | 0 |
| D | 0 | 374 | 0 |
| Quadrant | Total seconds | Saturated seconds | Saturation percentage |
|---|---|---|---|
| A | 18408 | 65 | 0.353107% |
| B | 18408 | 110 | 0.597566% |
| C | 18408 | 42 | 0.228162% |
| D | 18408 | 1590 | 8.637549% |
Noise dominated data is calculated using 1-second bins in cleaned event files. If a bin has >2000 counts, and if more than 50% of those come from <1% of pixels, then it is considered to be noise-dominated and hence unusable.
| Quadrant | # 1 sec bins | Bins with >0 counts | Bins with >2000 counts | High rate bins dominated by noise | Noise dominated (total time) | Noise dominated (detector-on time) | Marked lightcurve |
|---|---|---|---|---|---|---|---|
| A | 20508 | 18411 | 4 | 4 | 0.02% | 0.02% | 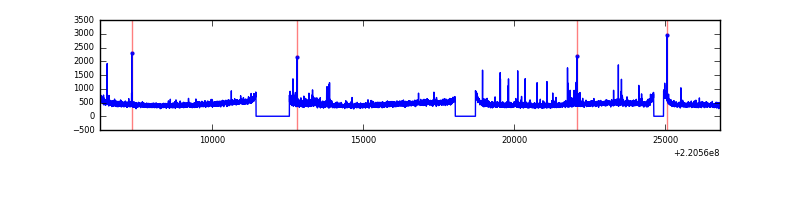 |
| B | 20508 | 18411 | 7 | 7 | 0.03% | 0.04% | 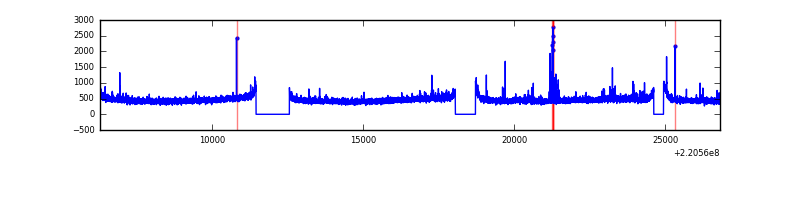 |
| C | 20508 | 18411 | 2 | 2 | 0.01% | 0.01% | 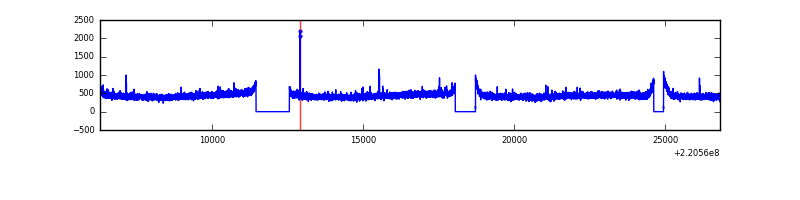 |
| D | 20508 | 18411 | 1118 | 1118 | 5.45% | 6.07% | 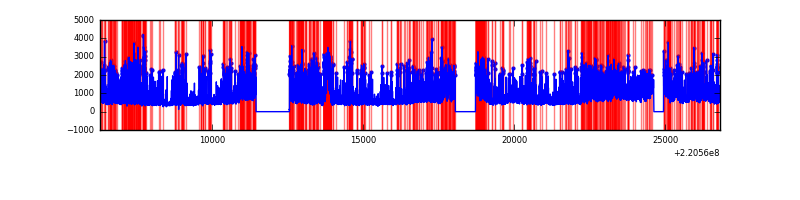 |
Top three noisy pixels from each quadrant. If the there are fewer than three noisy pixels in the level2.evt file, extra rows are filled as -1
| Pixel properties | Quadrant properties | ||||||
|---|---|---|---|---|---|---|---|
| Quadrant | DetID | PixID | Counts | Sigma | Mean | Median | Sigma |
| A | 8 | 15 | 68577 | 155.68 | 2100 | 2051 | 427.3 |
| A | 13 | 248 | 51974 | 116.83 | 2100 | 2051 | 427.3 |
| A | 14 | 111 | 40860 | 90.82 | 2100 | 2051 | 427.3 |
| B | 4 | 48 | 104466 | 252.81 | 2130 | 2076 | 405.0 |
| B | 0 | 214 | 58649 | 139.69 | 2130 | 2076 | 405.0 |
| B | 0 | 187 | 47189 | 111.39 | 2130 | 2076 | 405.0 |
| C | 12 | 4 | 16855 | 31.21 | 2049 | 2056 | 474.1 |
| C | 13 | 61 | 16139 | 29.7 | 2049 | 2056 | 474.1 |
| C | 9 | 16 | 12339 | 21.69 | 2049 | 2056 | 474.1 |
| D | 12 | 220 | 6934813 | 14496.03 | 1961 | 1898 | 478.3 |
| D | 8 | 195 | 958493 | 2000.14 | 1961 | 1898 | 478.3 |
| D | 2 | 216 | 833931 | 1739.7 | 1961 | 1898 | 478.3 |
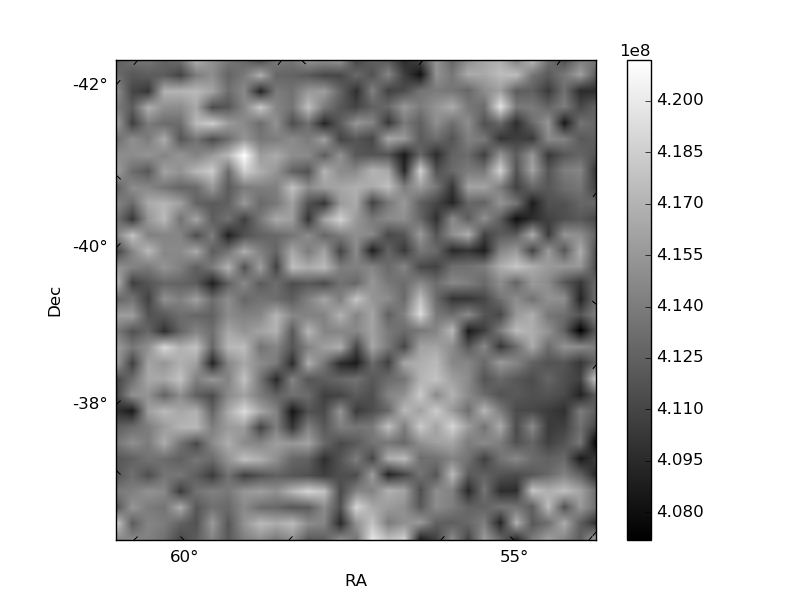
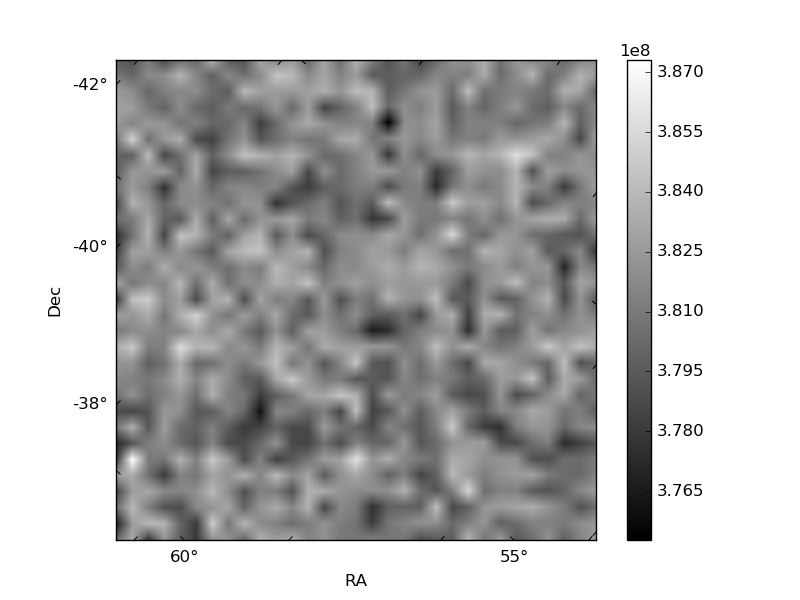
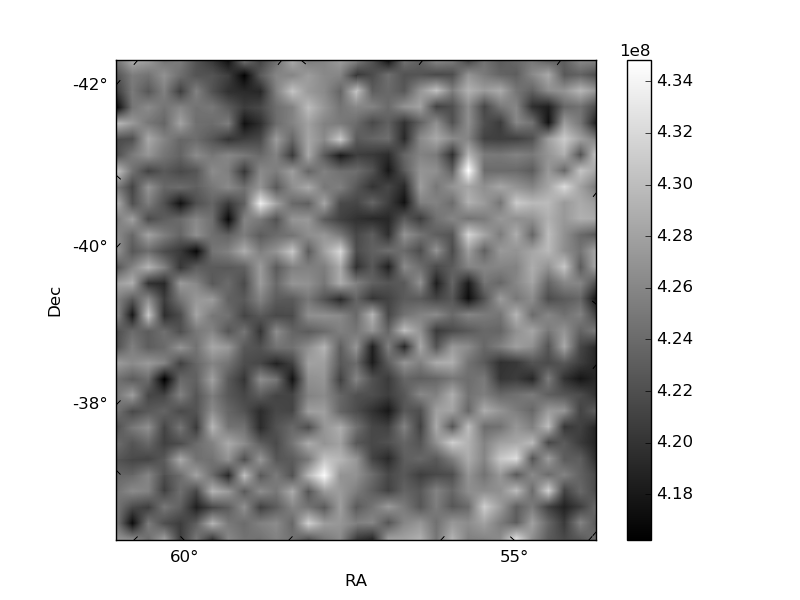
Histogram calculated using DETX and DETY for each event in the final _common_clean file
| Quadrant A | 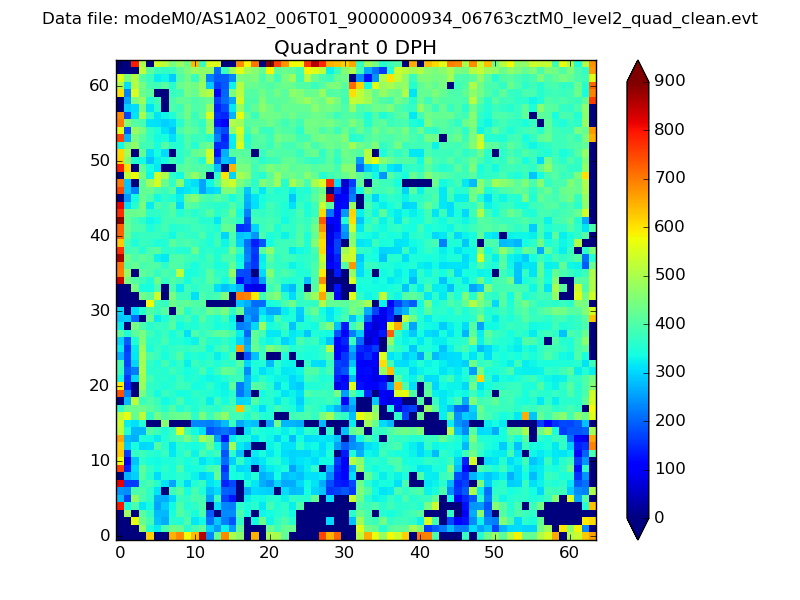 |
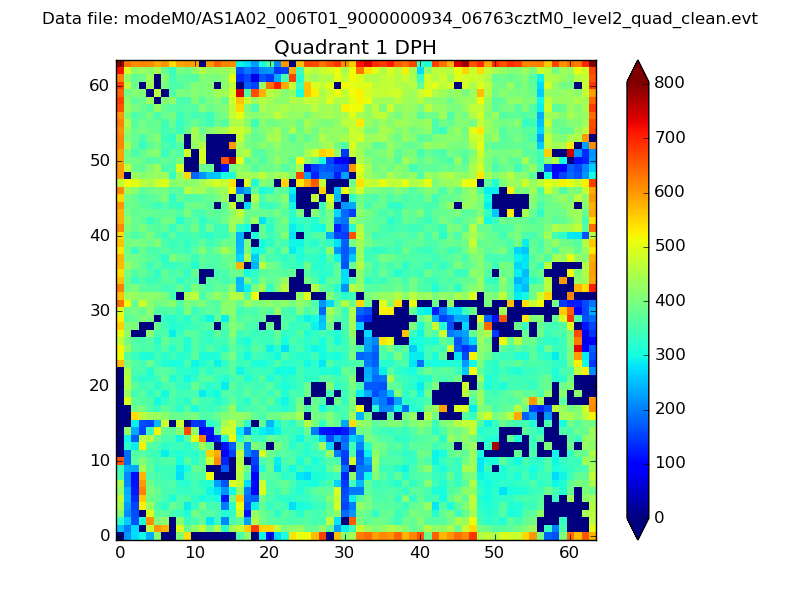 |
Quadrant B |
|---|---|---|---|
| Quadrant D | 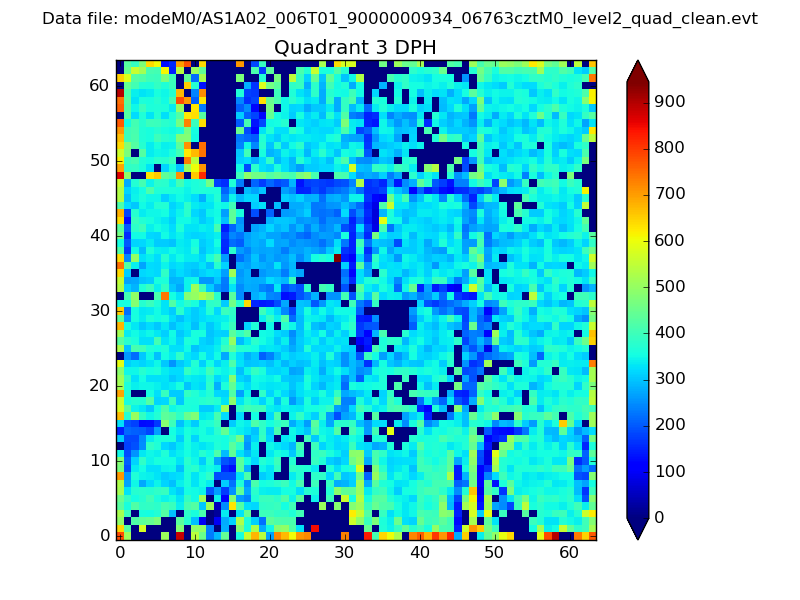 |
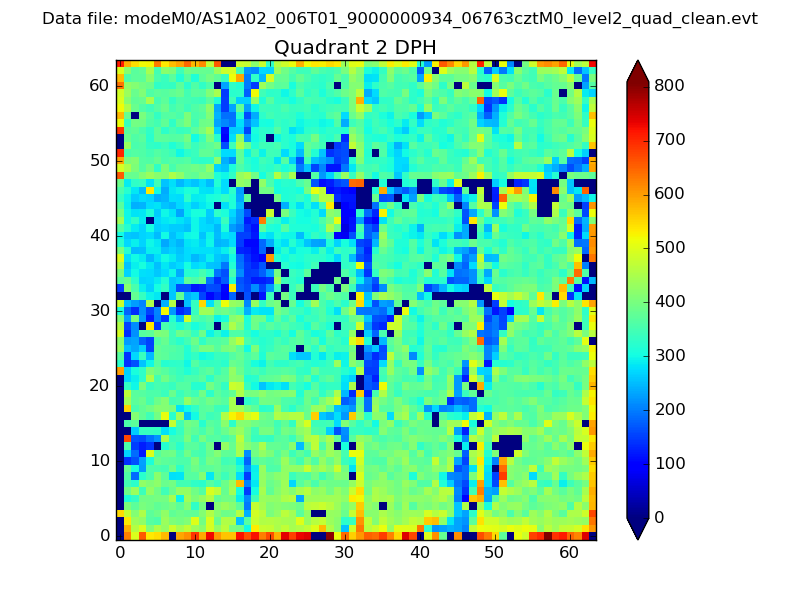 |
Quadrant C |
| Plot type | Count rate plots | Images |
|---|---|---|
| Comparison with Poisson distribution Blue bars denote a histogram of data divided into 1 sec bins. Red curve is a Poisson curve with rate = median count rate of data. |
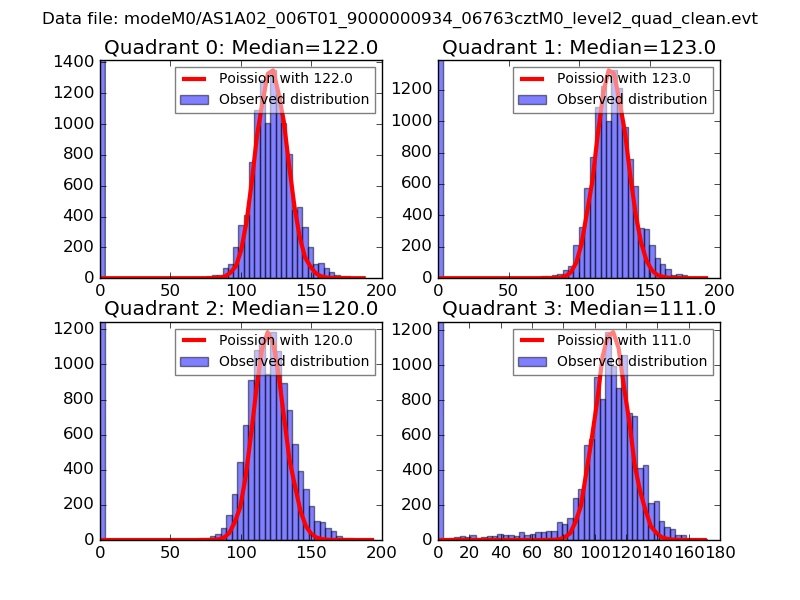 |
 |
| Quadrant-wise count rates Data is divided into 100 sec bins |
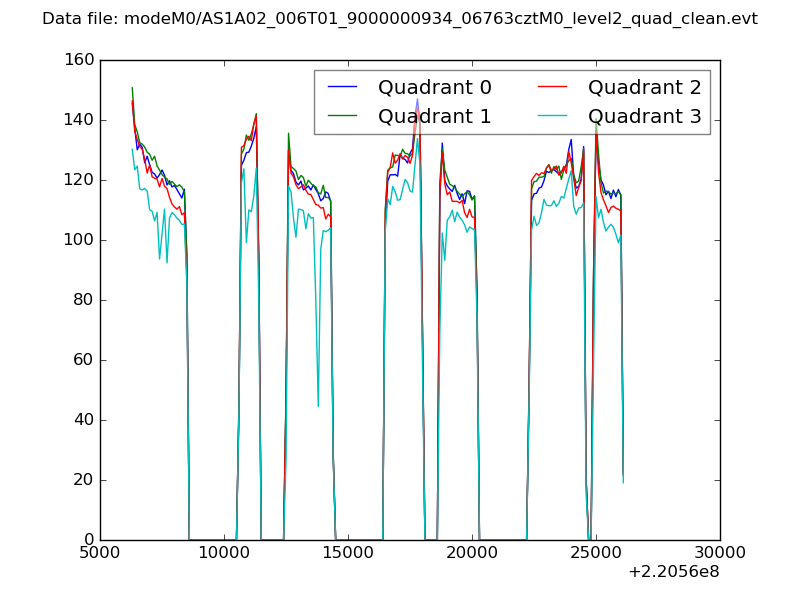 |
|
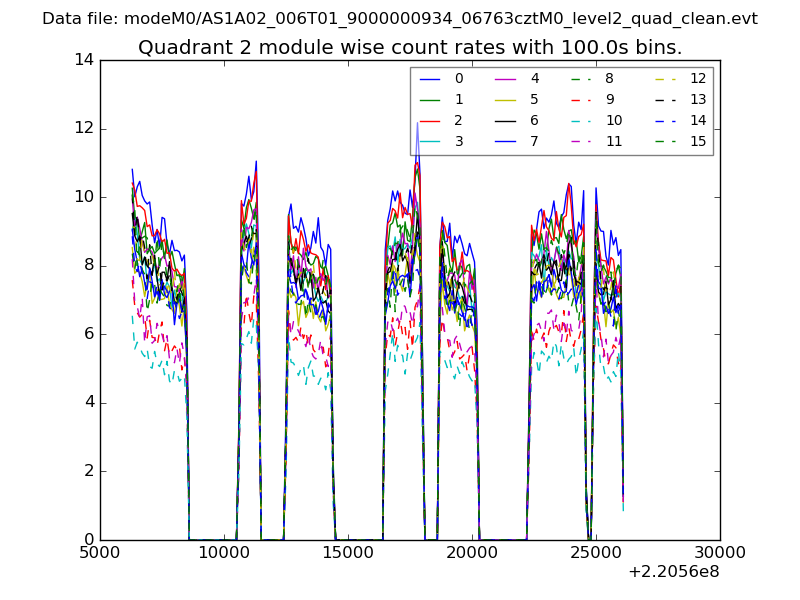
| Module-wise count rates for Quadrant A Data is divided into 100 sec bins |
 |
 |
| Module-wise count rates for Quadrant B Data is divided into 100 sec bins |
 |
 |
| Module-wise count rates for Quadrant C Data is divided into 100 sec bins |
 |
 |
| Module-wise count rates for Quadrant D Data is divided into 100 sec bins |
 |
 |
| Parameter | Plot |
|---|---|
| CZT HV Monitor | 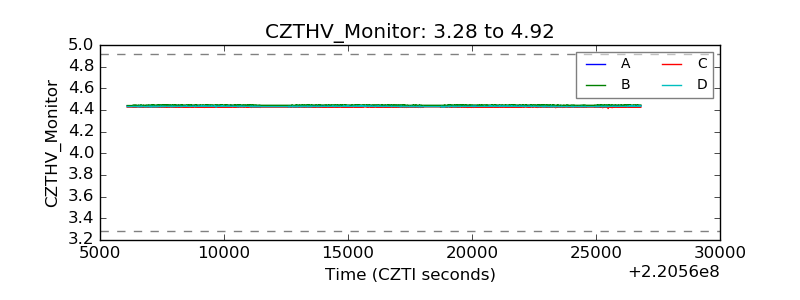 |
| D_VDD | 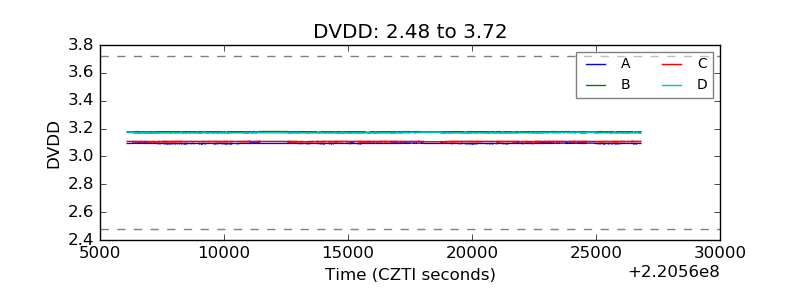 |
| Temperature 1 | 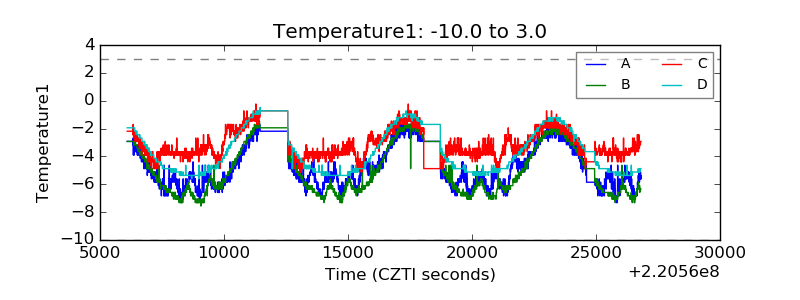 |
| Veto HV Monitor | 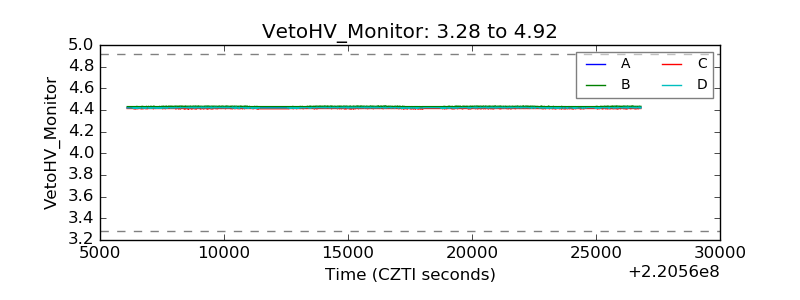 |
| Veto LLD | 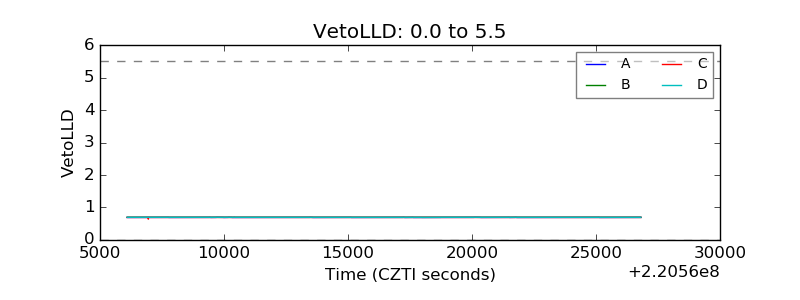 |
| Alpha Counter | 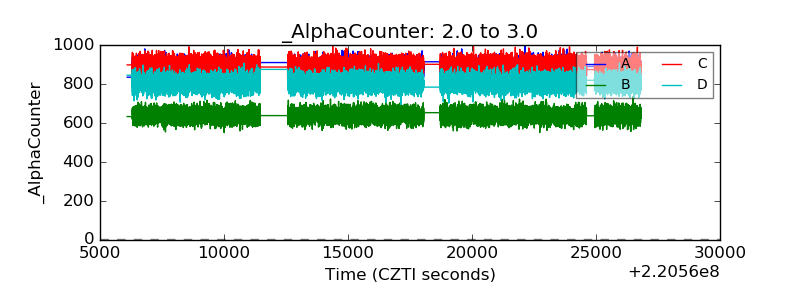 |
| _CPM_Rate | 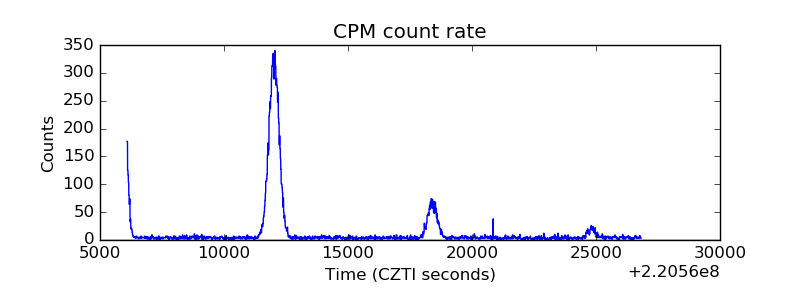 |
| CZT Counter | 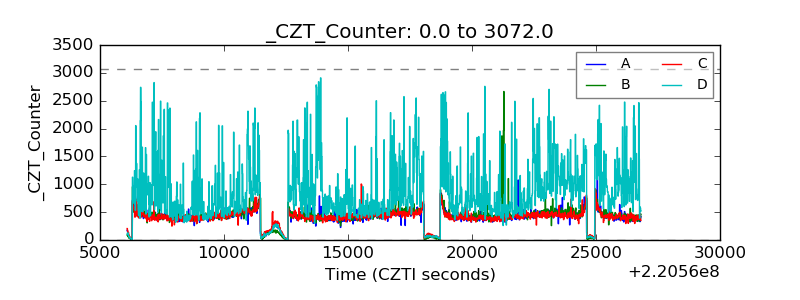 |
| +2.5 Volts monitor | 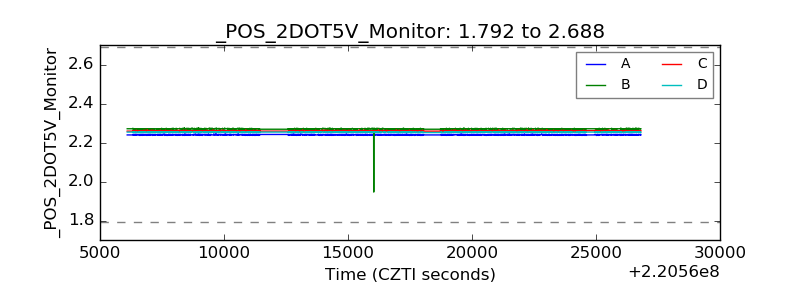 |
| +5 Volts monitor |  |
| _ROLL_ROT | 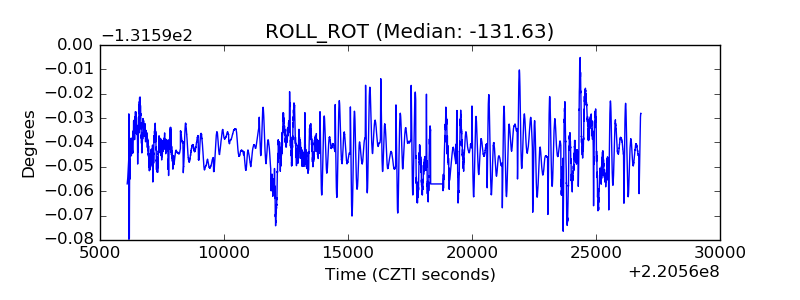 |
| _Roll_DEC | 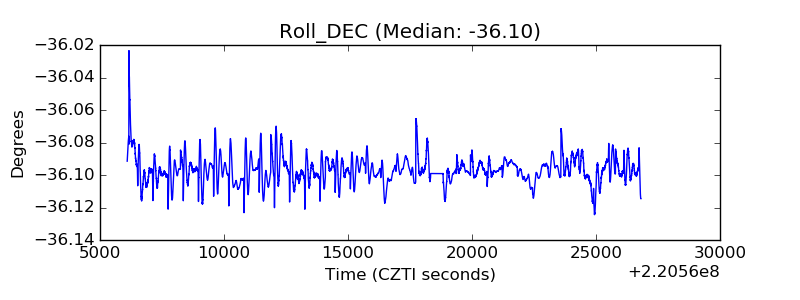 |
| _Roll_RA | 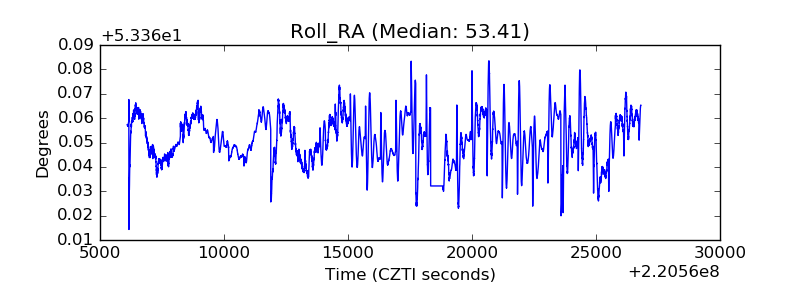 |
| Veto Counter | 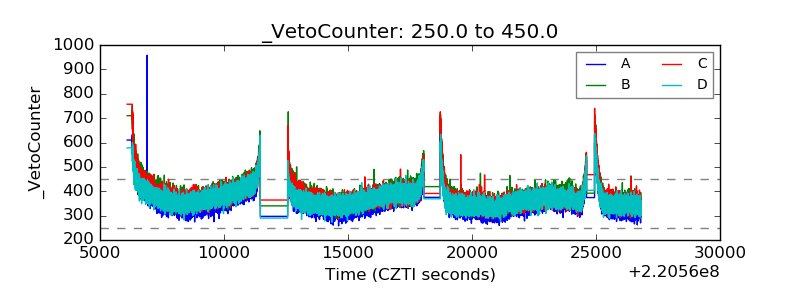 |