| Param | Original file | Final file |
|---|---|---|
| Filename | modeM0/AS1A02_006T01_9000000934_06764cztM0_level2.evt | modeM0/AS1A02_006T01_9000000934_06764cztM0_level2_quad_clean.evt |
| Size (bytes) | 631,172,160 | 95,875,200 |
| Size | 601.9 MB | 91.4 MB |
| Events in quadrant A | 3,685,640 | 602,321 |
| Events in quadrant B | 3,797,003 | 607,376 |
| Events in quadrant C | 3,588,743 | 595,430 |
| Events in quadrant D | 7,499,753 | 540,096 |
| Mode M9 | |||
|---|---|---|---|
| Quadrant | BADHDUFLAG | Total packets | Discarded packets |
| A | 0 | 5 | 0 |
| B | 0 | 5 | 0 |
| C | 0 | 5 | 0 |
| D | 0 | 5 | 0 |
| Mode M0 | |||
|---|---|---|---|
| Quadrant | BADHDUFLAG | Total packets | Discarded packets |
| A | 0 | 16713 | 3 |
| B | 0 | 16852 | 2 |
| C | 0 | 16637 | 2 |
| D | 0 | 27849 | 2 |
| Mode SS | |||
|---|---|---|---|
| Quadrant | BADHDUFLAG | Total packets | Discarded packets |
| A | 0 | 166 | 0 |
| B | 0 | 166 | 0 |
| C | 0 | 166 | 0 |
| D | 0 | 166 | 0 |
| Quadrant | Total seconds | Saturated seconds | Saturation percentage |
|---|---|---|---|
| A | 8020 | 93 | 1.159601% |
| B | 8020 | 145 | 1.807980% |
| C | 8020 | 101 | 1.259352% |
| D | 8020 | 710 | 8.852868% |
Noise dominated data is calculated using 1-second bins in cleaned event files. If a bin has >2000 counts, and if more than 50% of those come from <1% of pixels, then it is considered to be noise-dominated and hence unusable.
| Quadrant | # 1 sec bins | Bins with >0 counts | Bins with >2000 counts | High rate bins dominated by noise | Noise dominated (total time) | Noise dominated (detector-on time) | Marked lightcurve |
|---|---|---|---|---|---|---|---|
| A | 8560 | 8022 | 1 | 1 | 0.01% | 0.01% | 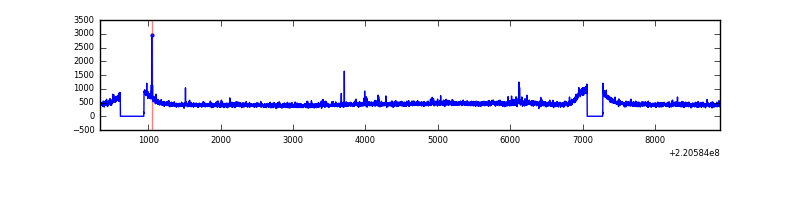 |
| B | 8560 | 8022 | 3 | 3 | 0.04% | 0.04% | 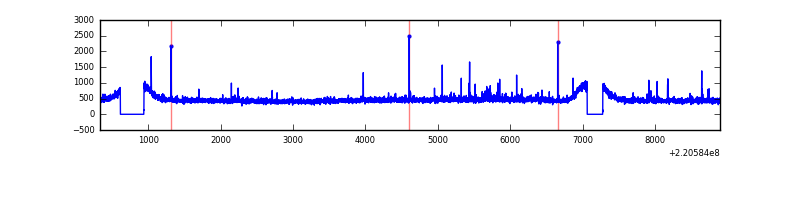 |
| C | 8560 | 8022 | 0 | 0 | 0.00% | 0.00% | 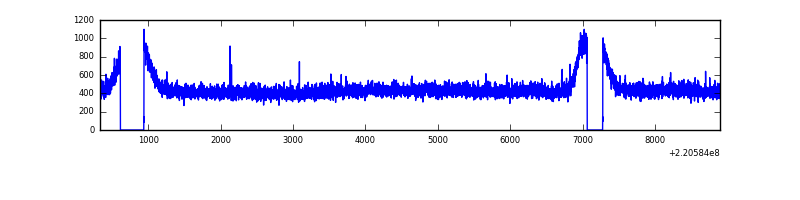 |
| D | 8560 | 8022 | 365 | 365 | 4.26% | 4.55% | 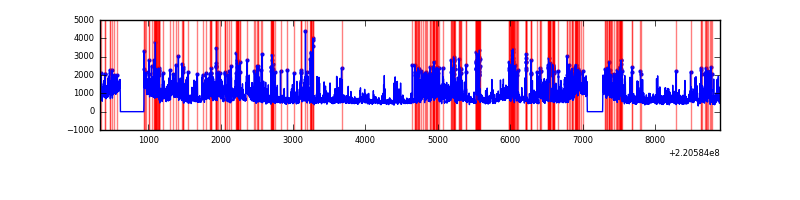 |
Top three noisy pixels from each quadrant. If the there are fewer than three noisy pixels in the level2.evt file, extra rows are filled as -1
| Pixel properties | Quadrant properties | ||||||
|---|---|---|---|---|---|---|---|
| Quadrant | DetID | PixID | Counts | Sigma | Mean | Median | Sigma |
| A | 8 | 15 | 37393 | 187.78 | 934 | 911 | 194.3 |
| A | 15 | 239 | 36554 | 183.46 | 934 | 911 | 194.3 |
| A | 13 | 248 | 17622 | 86.01 | 934 | 911 | 194.3 |
| B | 4 | 48 | 53815 | 286.55 | 947 | 921 | 184.6 |
| B | 0 | 214 | 25558 | 133.47 | 947 | 921 | 184.6 |
| B | 0 | 187 | 23439 | 121.99 | 947 | 921 | 184.6 |
| C | 13 | 61 | 7271 | 29.59 | 915 | 918 | 214.7 |
| C | 8 | 128 | 5876 | 23.09 | 915 | 918 | 214.7 |
| C | 10 | 22 | 4115 | 14.89 | 915 | 918 | 214.7 |
| D | 12 | 220 | 2909149 | 13516.14 | 877 | 850 | 215.2 |
| D | 8 | 195 | 563898 | 2616.73 | 877 | 850 | 215.2 |
| D | 13 | 169 | 228011 | 1055.72 | 877 | 850 | 215.2 |
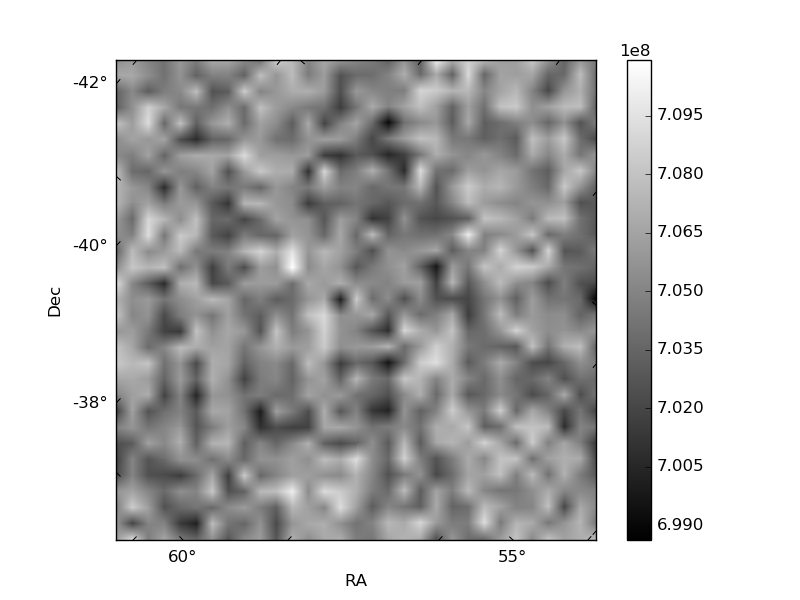
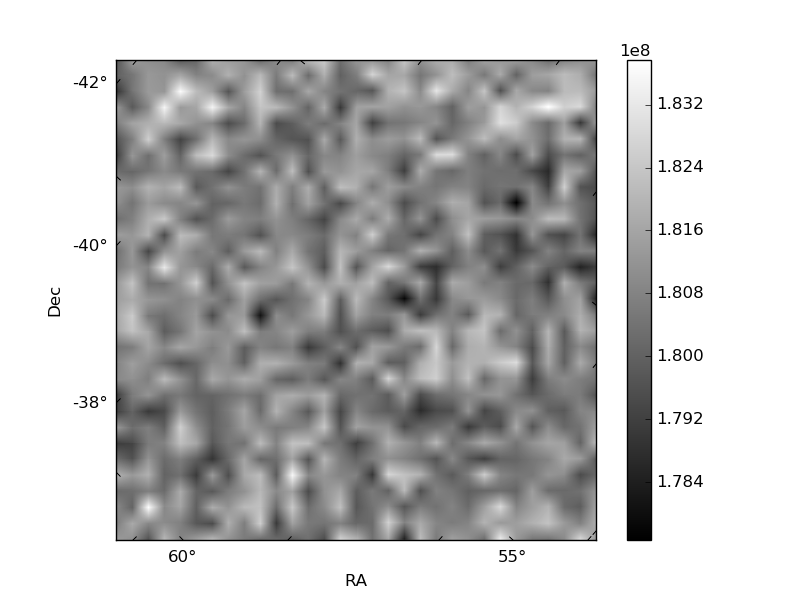
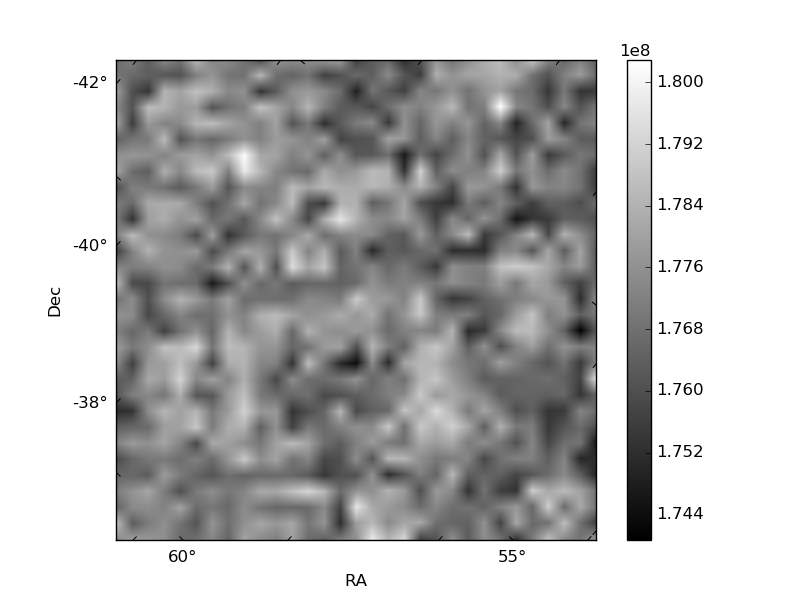
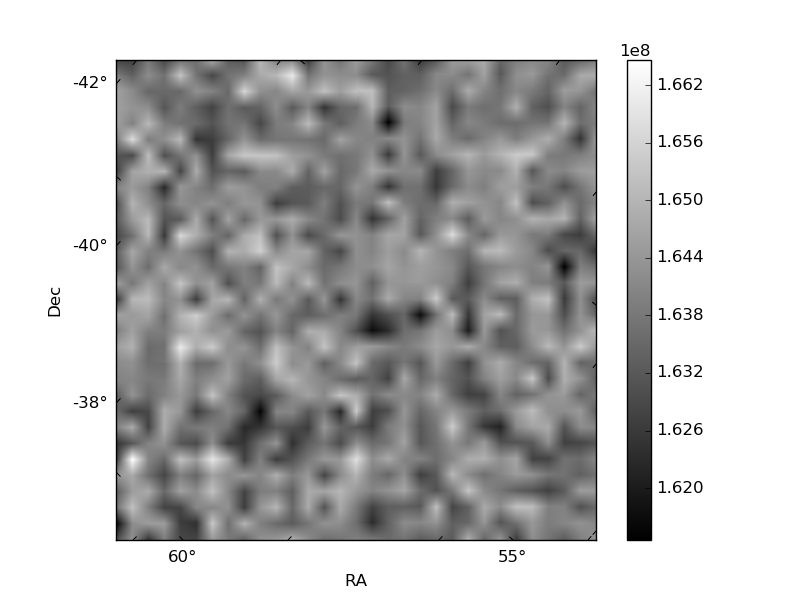
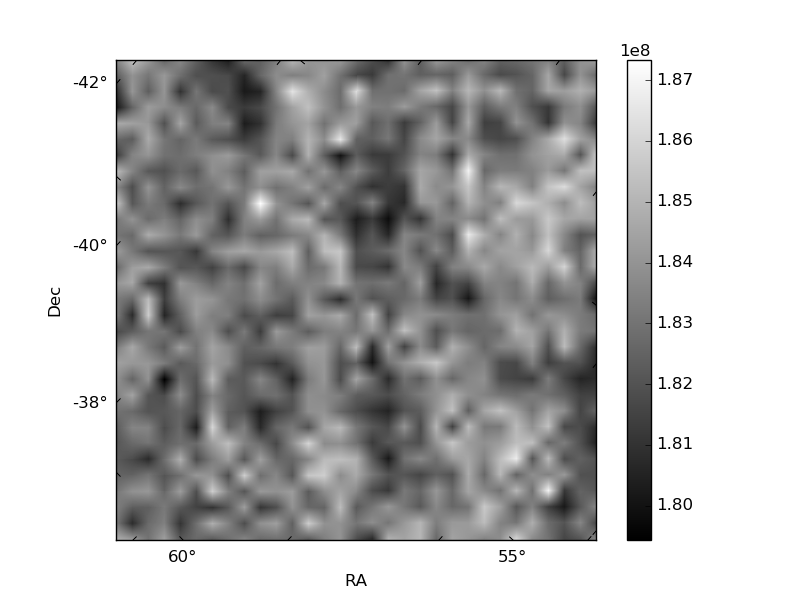
Histogram calculated using DETX and DETY for each event in the final _common_clean file
| Quadrant A | 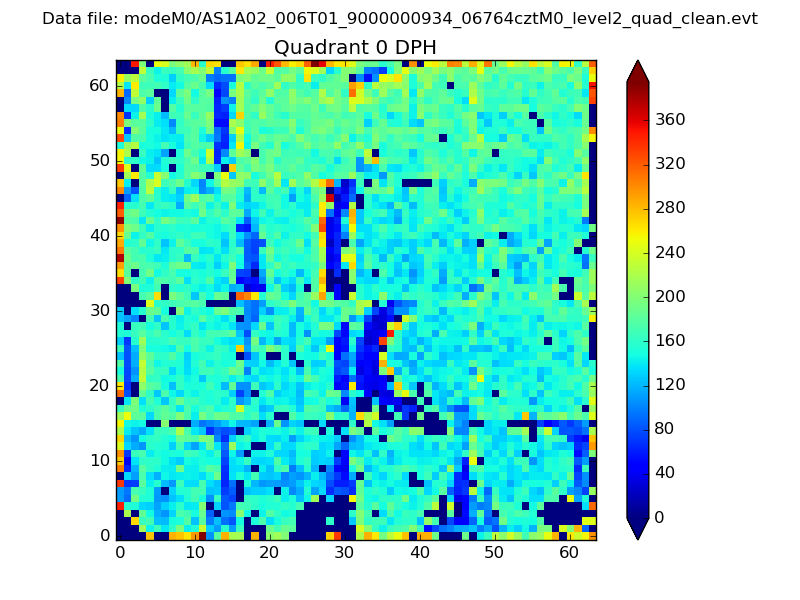 |
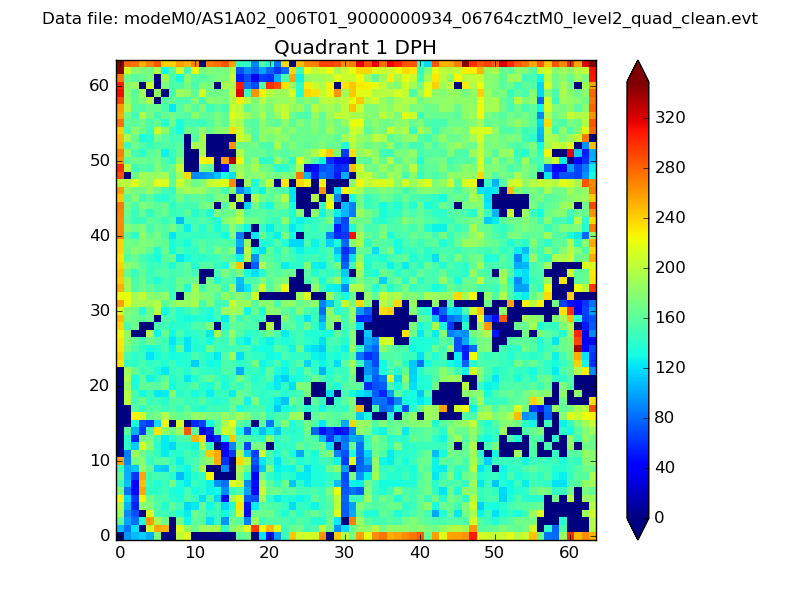 |
Quadrant B |
|---|---|---|---|
| Quadrant D | 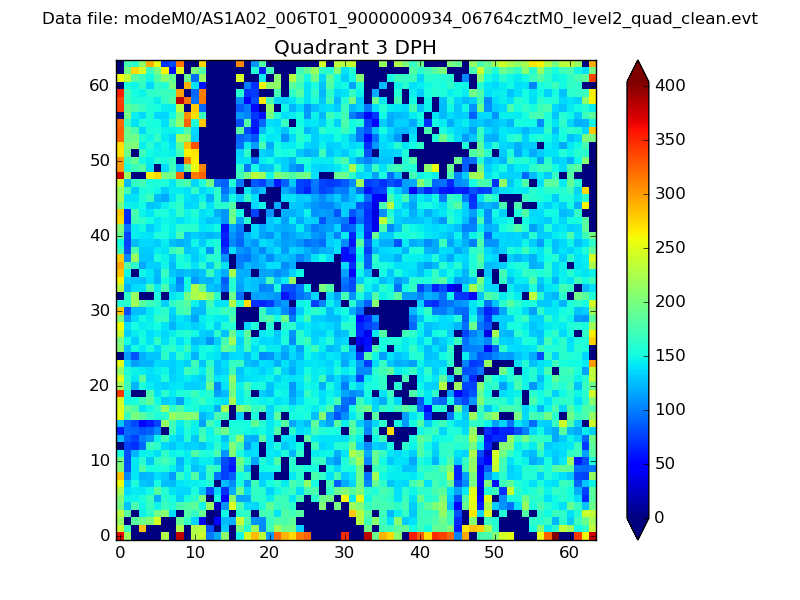 |
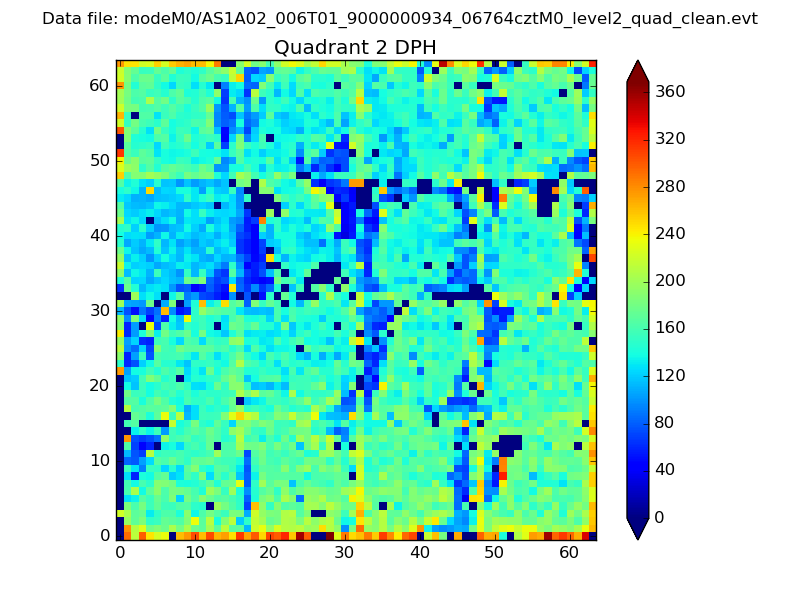 |
Quadrant C |
| Plot type | Count rate plots | Images |
|---|---|---|
| Comparison with Poisson distribution Blue bars denote a histogram of data divided into 1 sec bins. Red curve is a Poisson curve with rate = median count rate of data. |
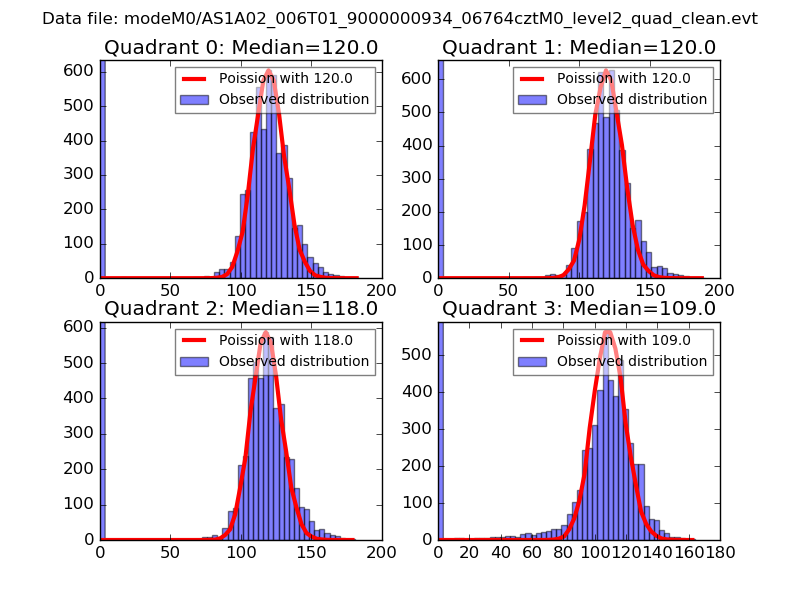 |
 |
| Quadrant-wise count rates Data is divided into 100 sec bins |
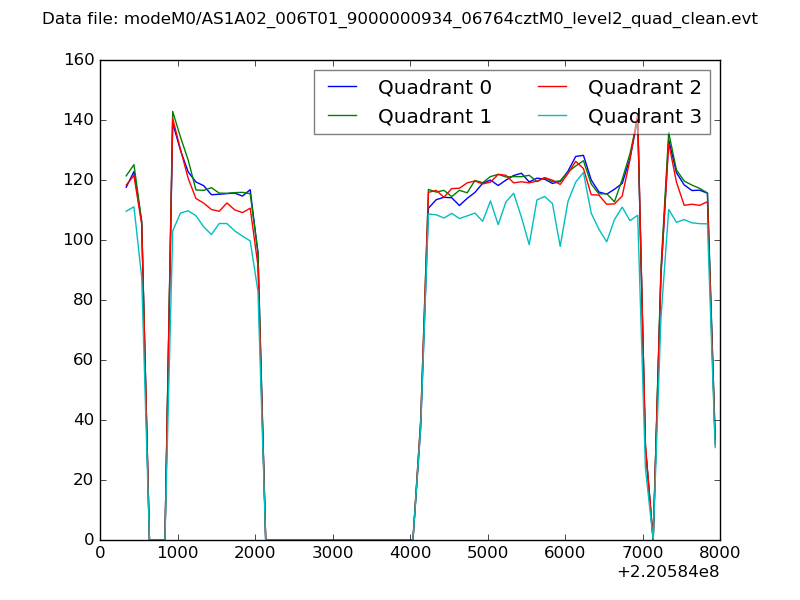 |
|
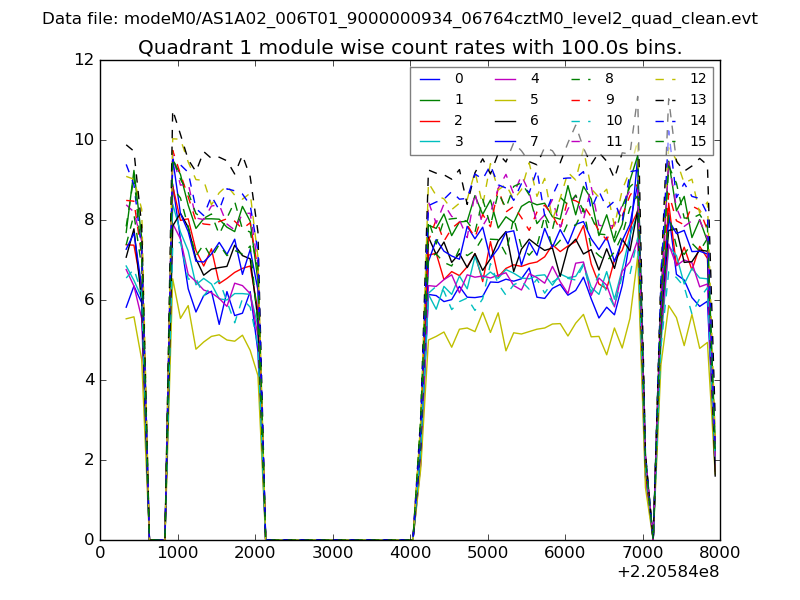
| Module-wise count rates for Quadrant A Data is divided into 100 sec bins |
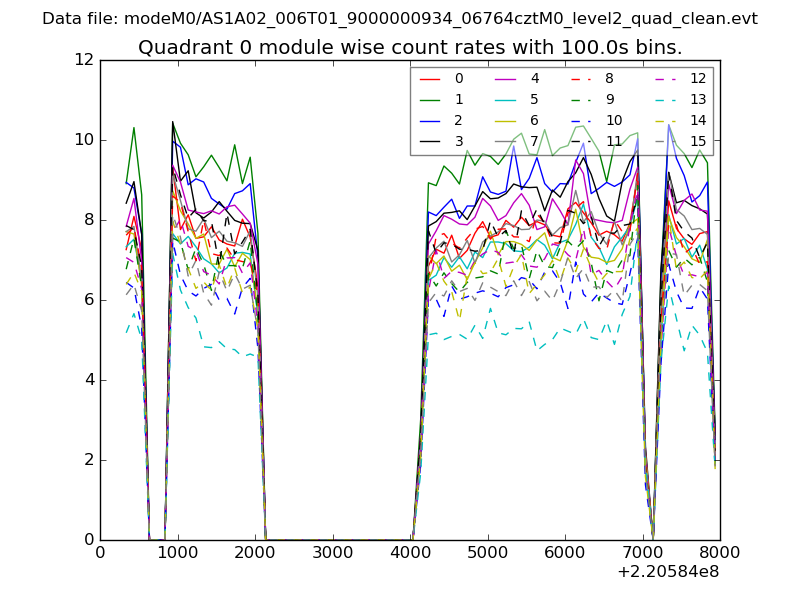 |
 |
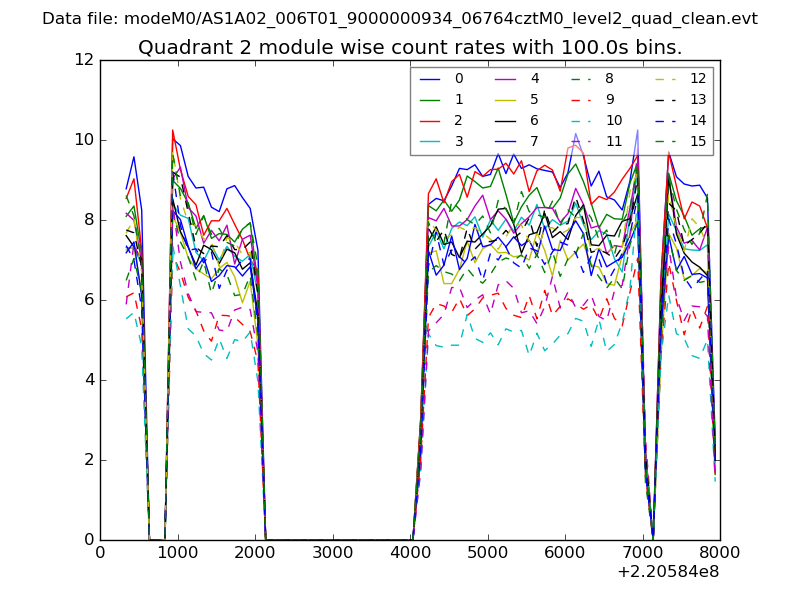
| Module-wise count rates for Quadrant B Data is divided into 100 sec bins |
 |
 |
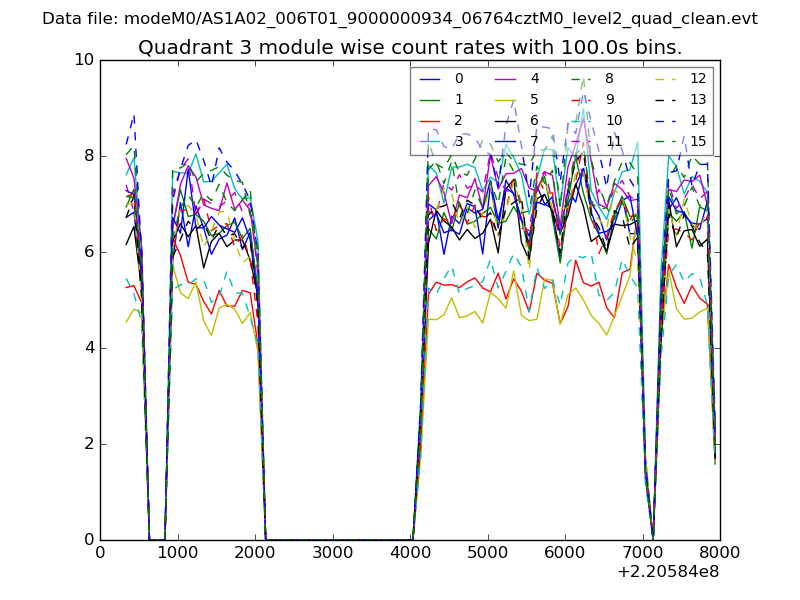
| Module-wise count rates for Quadrant C Data is divided into 100 sec bins |
 |
 |
| Module-wise count rates for Quadrant D Data is divided into 100 sec bins |
 |
 |
| Parameter | Plot |
|---|---|
| CZT HV Monitor | 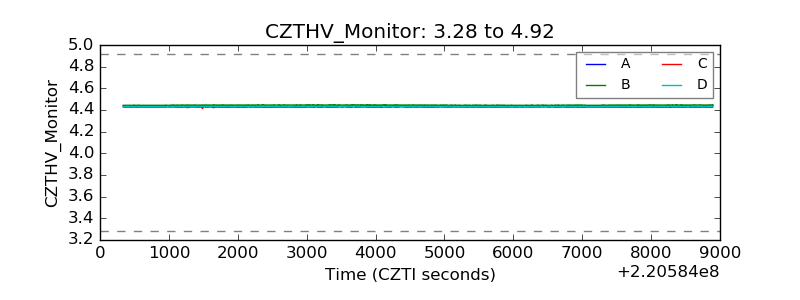 |
| D_VDD | 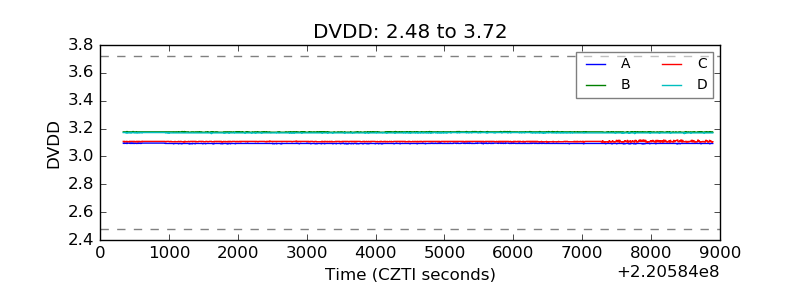 |
| Temperature 1 | 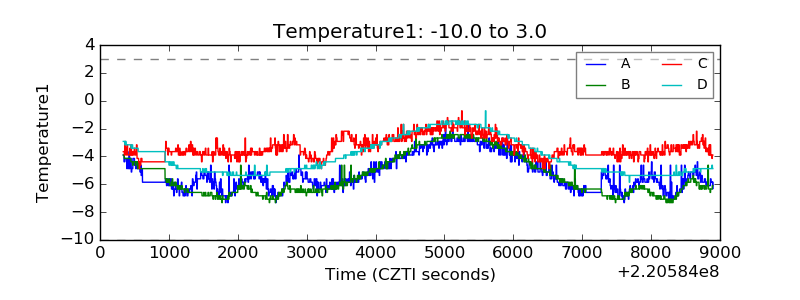 |
| Veto HV Monitor | 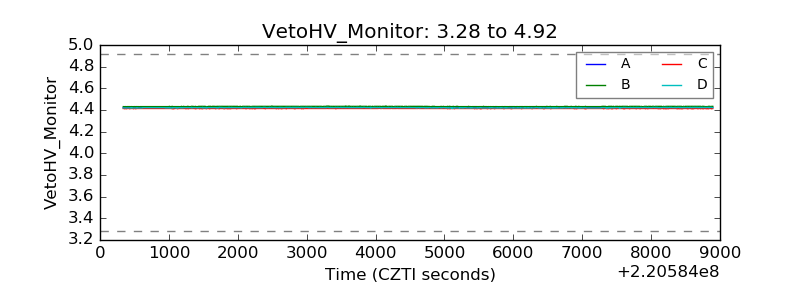 |
| Veto LLD | 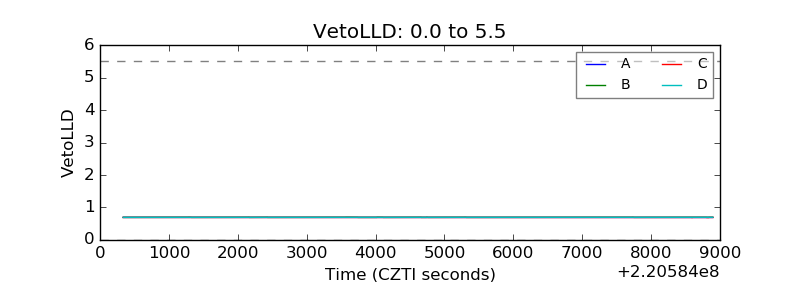 |
| Alpha Counter | 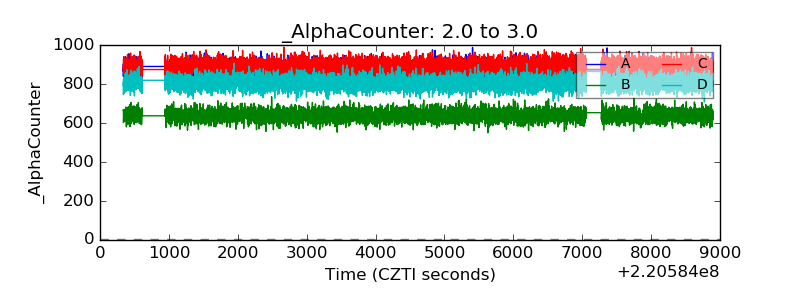 |
| _CPM_Rate | 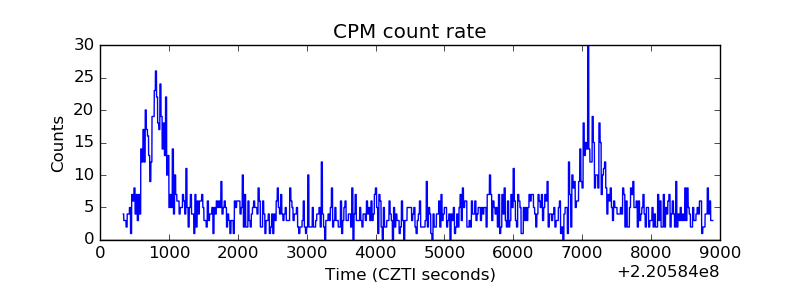 |
| CZT Counter | 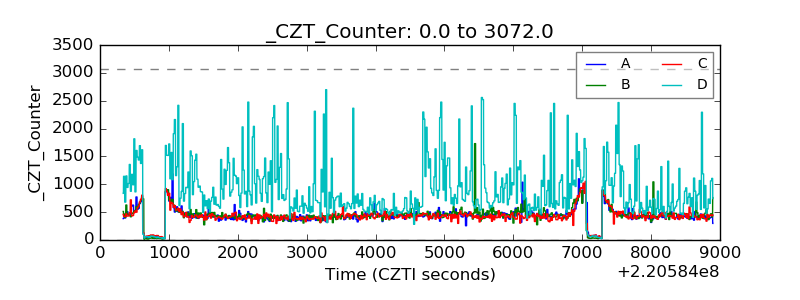 |
| +2.5 Volts monitor | 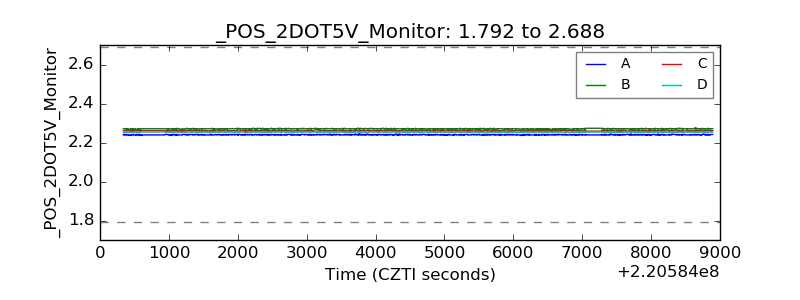 |
| +5 Volts monitor |  |
| _ROLL_ROT | 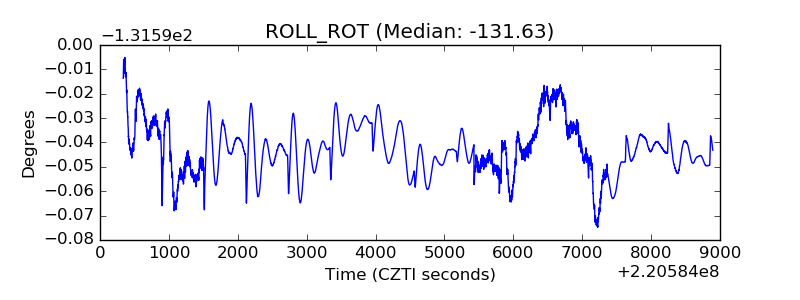 |
| _Roll_DEC | 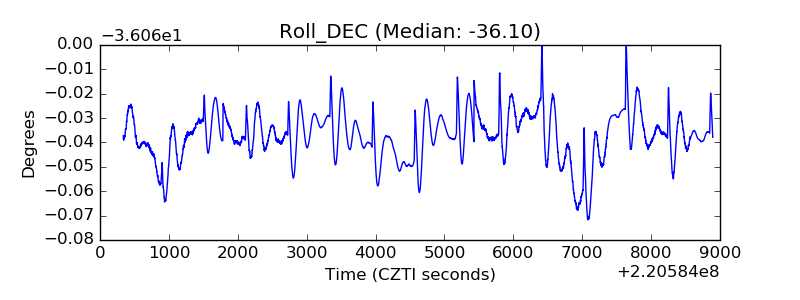 |
| _Roll_RA | 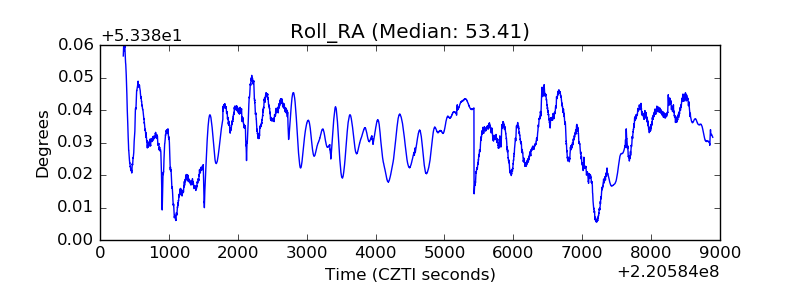 |
| Veto Counter | 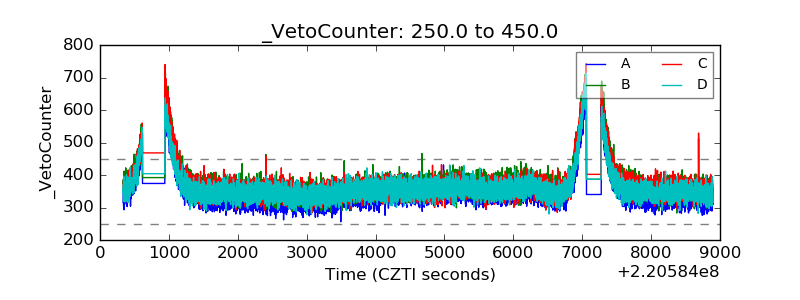 |