| Param | Original file | Final file |
|---|---|---|
| Filename | modeM0/AS1A02_006T01_9000000934_06765cztM0_level2.evt | modeM0/AS1A02_006T01_9000000934_06765cztM0_level2_quad_clean.evt |
| Size (bytes) | 635,532,480 | 85,127,040 |
| Size | 606.1 MB | 81.2 MB |
| Events in quadrant A | 3,693,366 | 516,832 |
| Events in quadrant B | 3,751,945 | 524,412 |
| Events in quadrant C | 3,681,452 | 516,465 |
| Events in quadrant D | 7,583,323 | 468,502 |
| Mode M9 | |||
|---|---|---|---|
| Quadrant | BADHDUFLAG | Total packets | Discarded packets |
| A | 0 | 5 | 0 |
| B | 0 | 5 | 0 |
| C | 0 | 5 | 0 |
| D | 0 | 5 | 0 |
| Mode M0 | |||
|---|---|---|---|
| Quadrant | BADHDUFLAG | Total packets | Discarded packets |
| A | 0 | 16639 | 26 |
| B | 0 | 16677 | 16 |
| C | 0 | 16737 | 19 |
| D | 0 | 28294 | 142 |
| Mode SS | |||
|---|---|---|---|
| Quadrant | BADHDUFLAG | Total packets | Discarded packets |
| A | 0 | 164 | 0 |
| B | 0 | 164 | 0 |
| C | 0 | 164 | 0 |
| D | 0 | 164 | 0 |
| Quadrant | Total seconds | Saturated seconds | Saturation percentage |
|---|---|---|---|
| A | 7925 | 171 | 2.157729% |
| B | 7927 | 208 | 2.623943% |
| C | 7927 | 203 | 2.560868% |
| D | 7905 | 694 | 8.779254% |
Noise dominated data is calculated using 1-second bins in cleaned event files. If a bin has >2000 counts, and if more than 50% of those come from <1% of pixels, then it is considered to be noise-dominated and hence unusable.
| Quadrant | # 1 sec bins | Bins with >0 counts | Bins with >2000 counts | High rate bins dominated by noise | Noise dominated (total time) | Noise dominated (detector-on time) | Marked lightcurve |
|---|---|---|---|---|---|---|---|
| A | 8484 | 7936 | 0 | 0 | 0.00% | 0.00% | 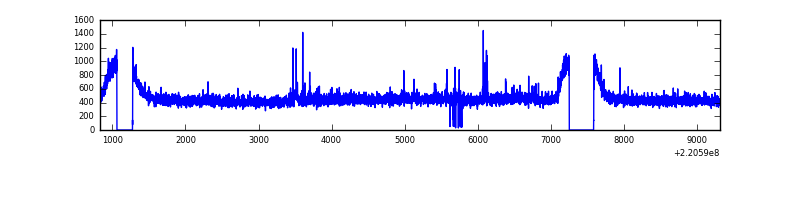 |
| B | 8484 | 7936 | 0 | 0 | 0.00% | 0.00% | 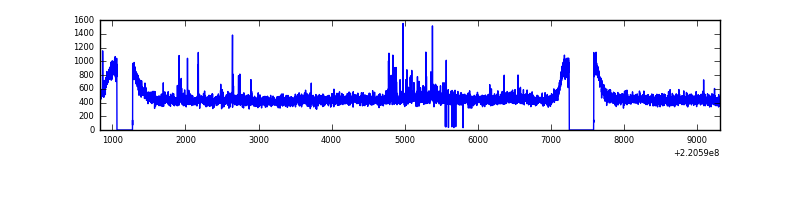 |
| C | 8484 | 7936 | 10 | 10 | 0.12% | 0.13% | 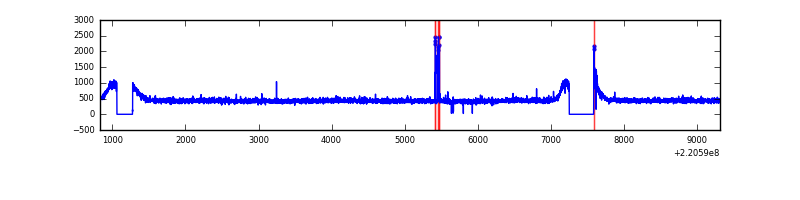 |
| D | 8484 | 7933 | 352 | 352 | 4.15% | 4.44% | 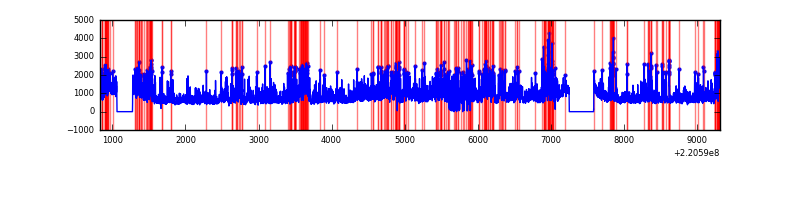 |
Top three noisy pixels from each quadrant. If the there are fewer than three noisy pixels in the level2.evt file, extra rows are filled as -1
| Pixel properties | Quadrant properties | ||||||
|---|---|---|---|---|---|---|---|
| Quadrant | DetID | PixID | Counts | Sigma | Mean | Median | Sigma |
| A | 8 | 15 | 56711 | 288.49 | 934 | 911 | 193.4 |
| A | 15 | 239 | 22940 | 113.89 | 934 | 911 | 193.4 |
| A | 13 | 248 | 21252 | 105.17 | 934 | 911 | 193.4 |
| B | 4 | 81 | 45070 | 238.73 | 944 | 920 | 184.9 |
| B | 0 | 214 | 30576 | 160.35 | 944 | 920 | 184.9 |
| B | 0 | 187 | 20136 | 103.9 | 944 | 920 | 184.9 |
| C | 10 | 22 | 35794 | 161.17 | 918 | 920 | 216.4 |
| C | 9 | 16 | 31825 | 142.83 | 918 | 920 | 216.4 |
| C | 8 | 128 | 15899 | 69.23 | 918 | 920 | 216.4 |
| D | 12 | 220 | 3189090 | 14683.81 | 881 | 851 | 217.1 |
| D | 8 | 195 | 717665 | 3301.37 | 881 | 851 | 217.1 |
| D | 2 | 152 | 228322 | 1047.64 | 881 | 851 | 217.1 |
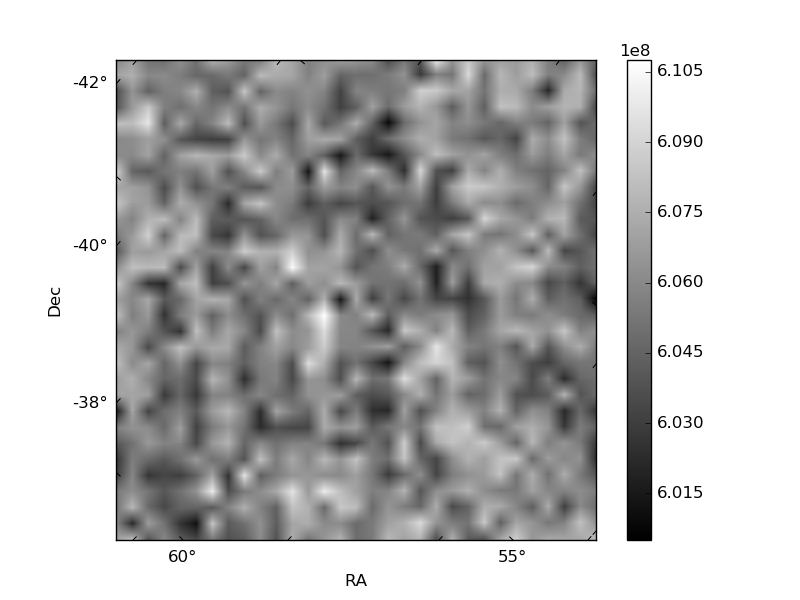
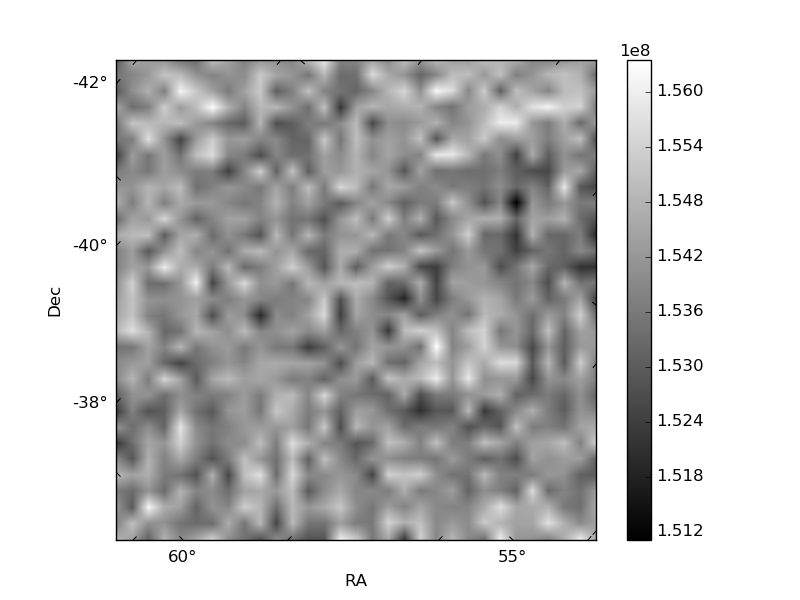
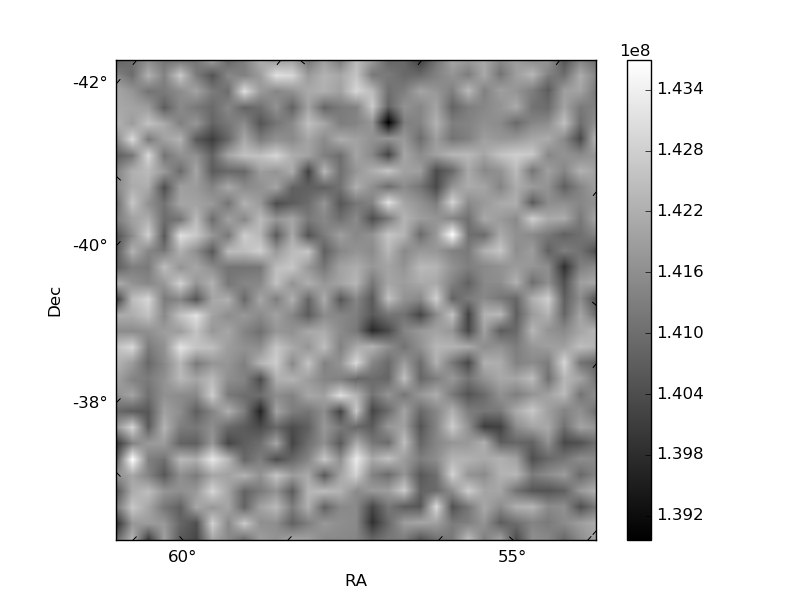
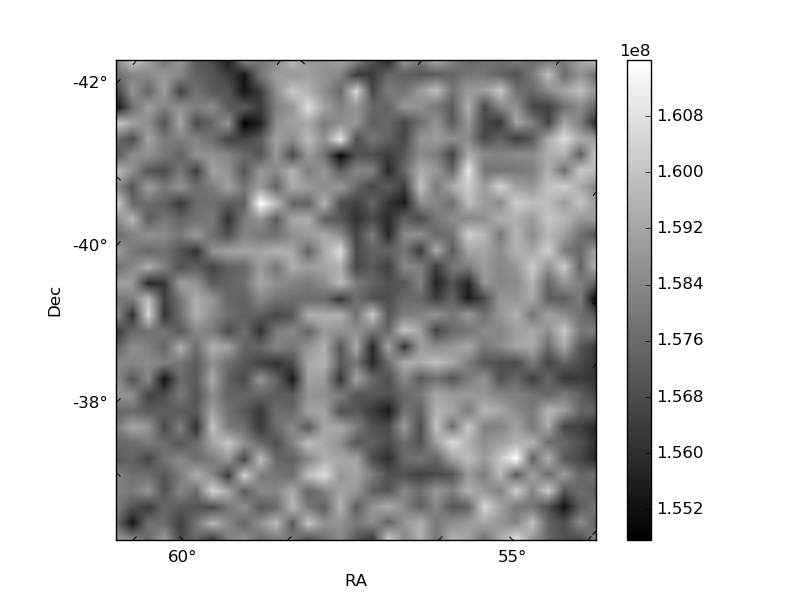
Histogram calculated using DETX and DETY for each event in the final _common_clean file
| Quadrant A | 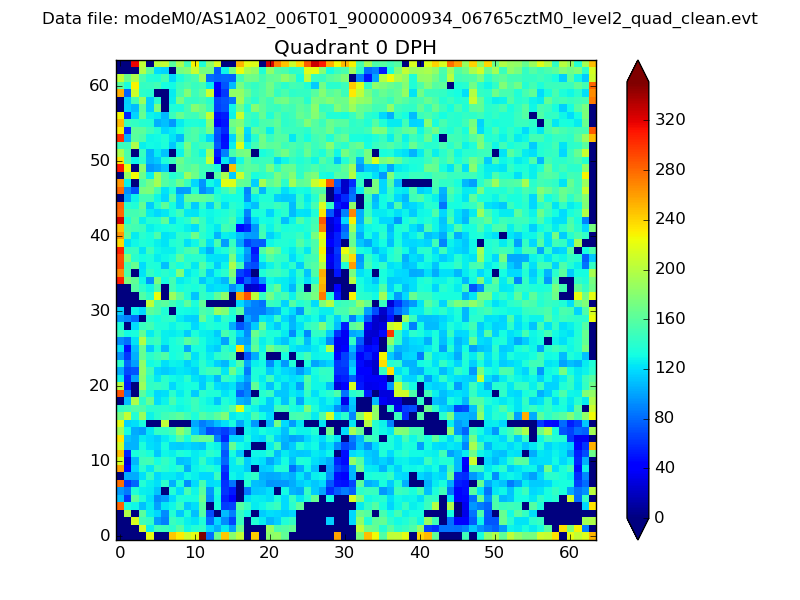 |
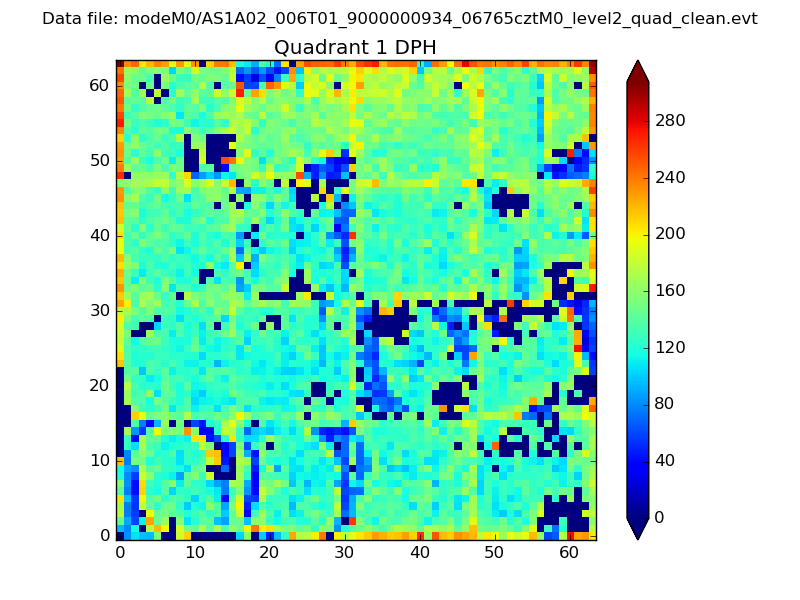 |
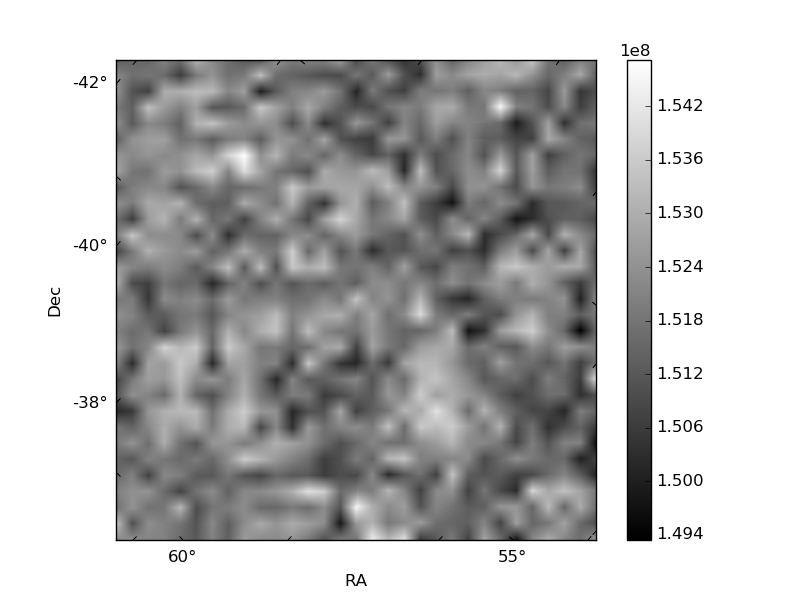
Quadrant B |
|---|---|---|---|
| Quadrant D | 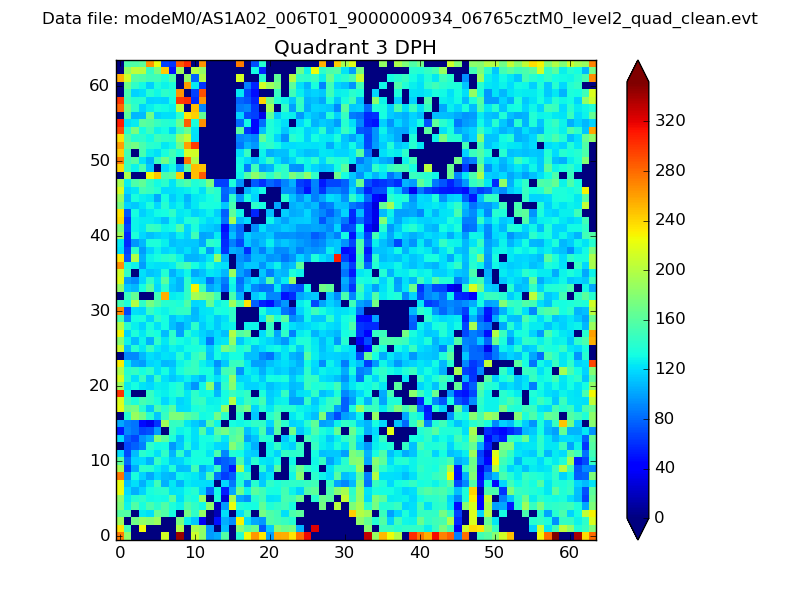 |
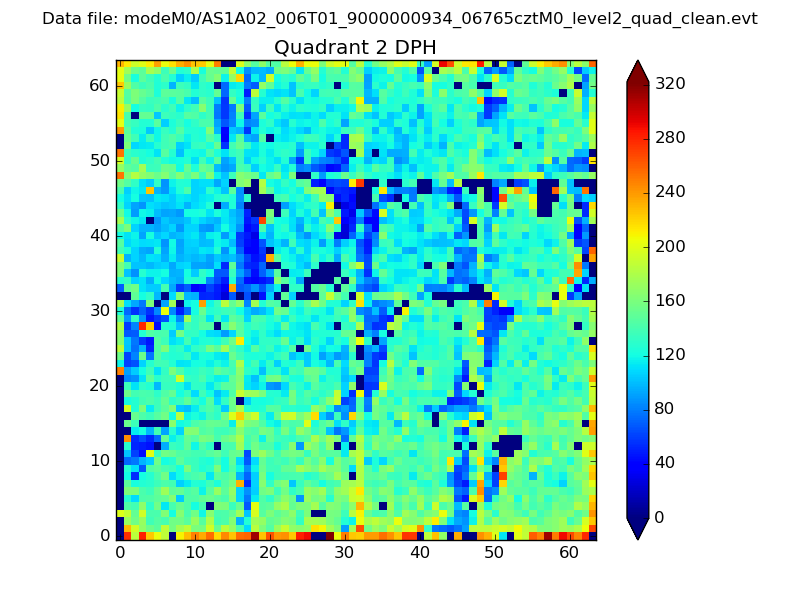 |
Quadrant C |
| Plot type | Count rate plots | Images |
|---|---|---|
| Comparison with Poisson distribution Blue bars denote a histogram of data divided into 1 sec bins. Red curve is a Poisson curve with rate = median count rate of data. |
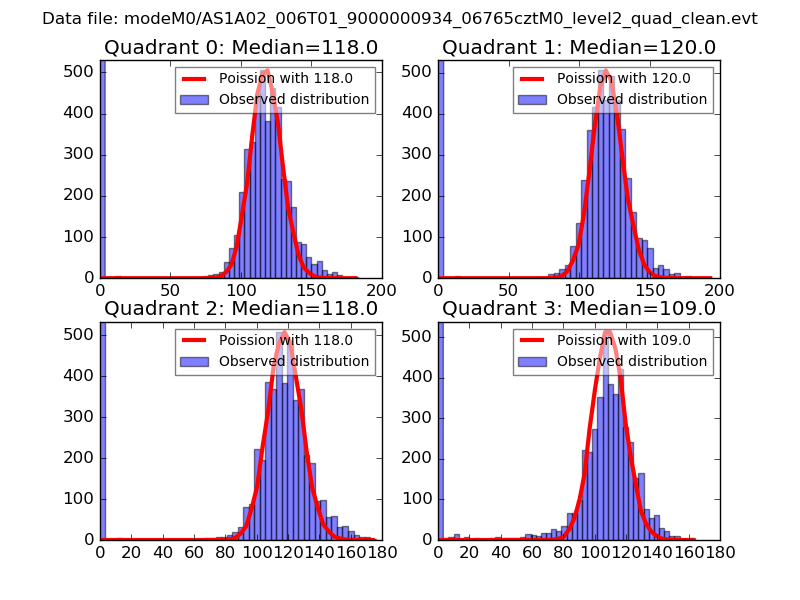 |
 |
| Quadrant-wise count rates Data is divided into 100 sec bins |
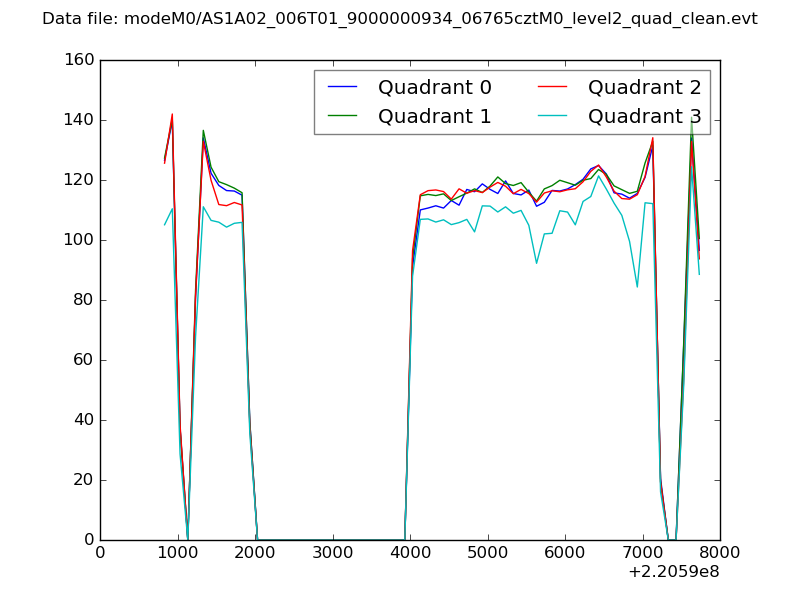 |
|
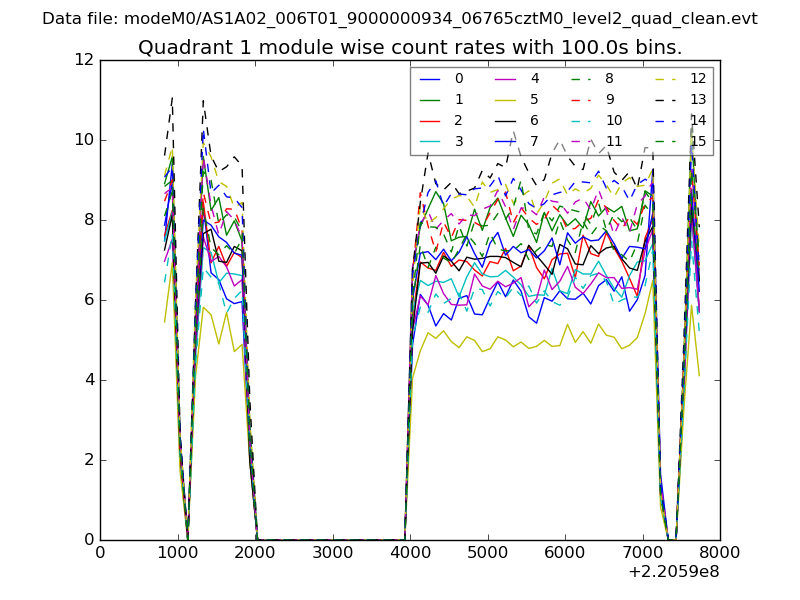
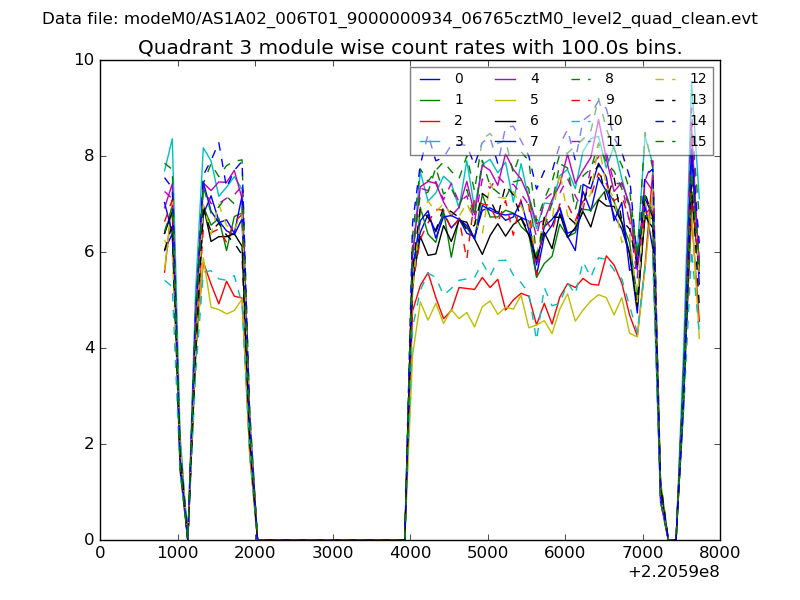
| Module-wise count rates for Quadrant A Data is divided into 100 sec bins |
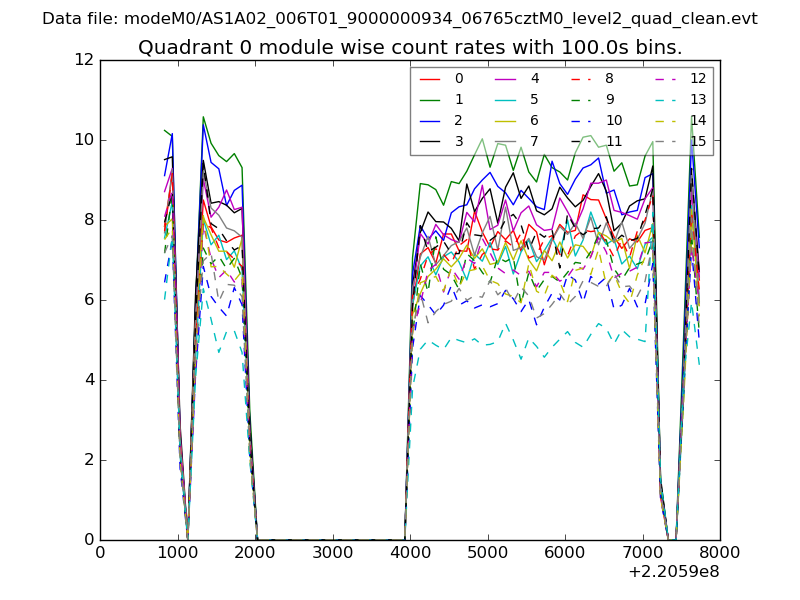 |
 |
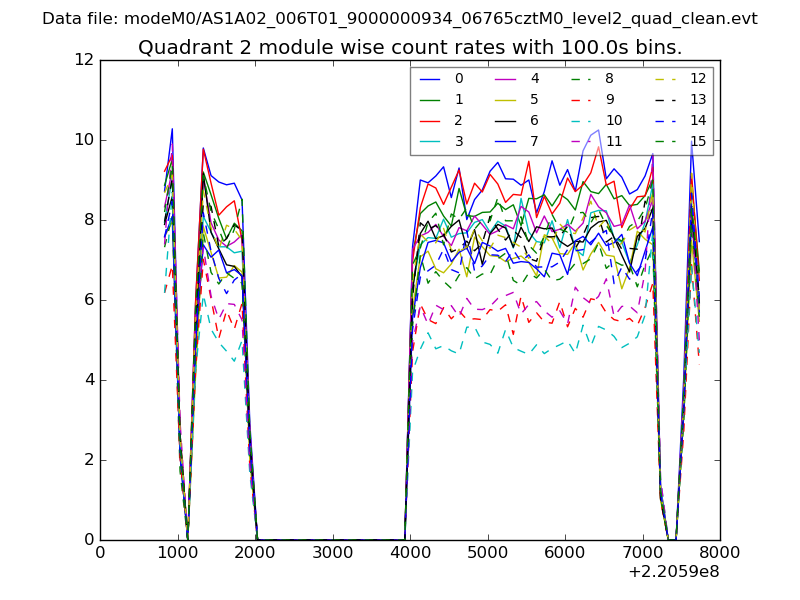
| Module-wise count rates for Quadrant B Data is divided into 100 sec bins |
 |
 |
| Module-wise count rates for Quadrant C Data is divided into 100 sec bins |
 |
 |
| Module-wise count rates for Quadrant D Data is divided into 100 sec bins |
 |
 |
| Parameter | Plot |
|---|---|
| CZT HV Monitor | 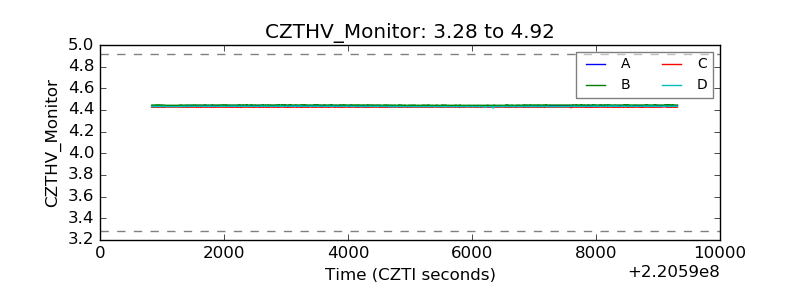 |
| D_VDD | 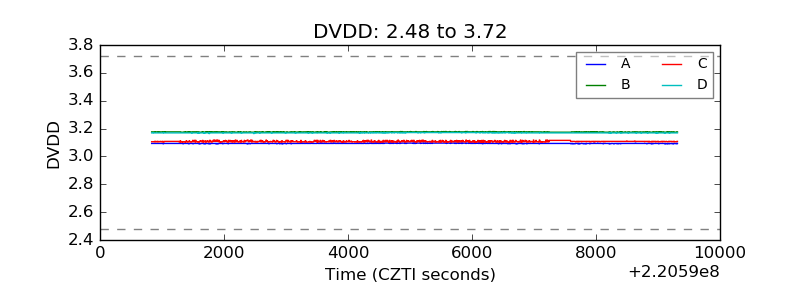 |
| Temperature 1 | 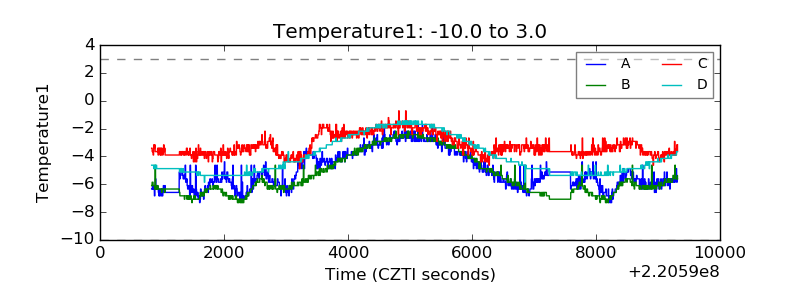 |
| Veto HV Monitor | 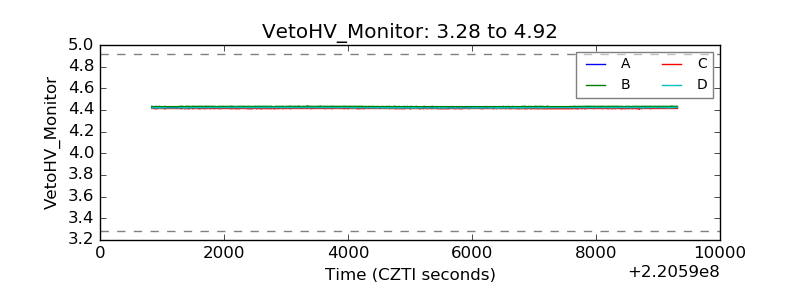 |
| Veto LLD | 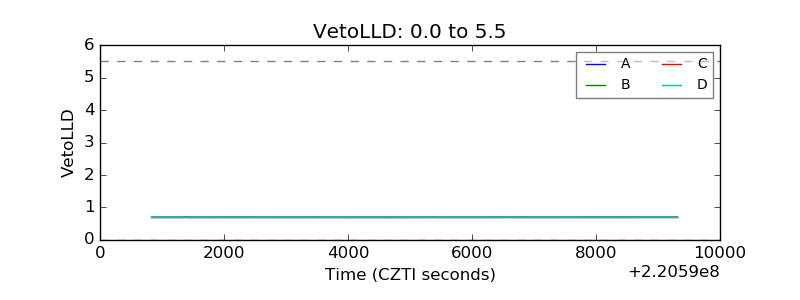 |
| Alpha Counter | 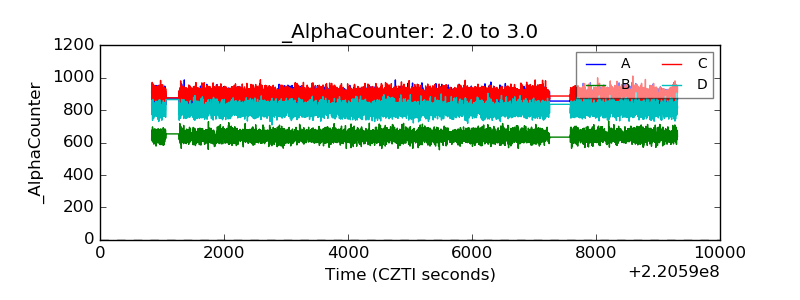 |
| _CPM_Rate | 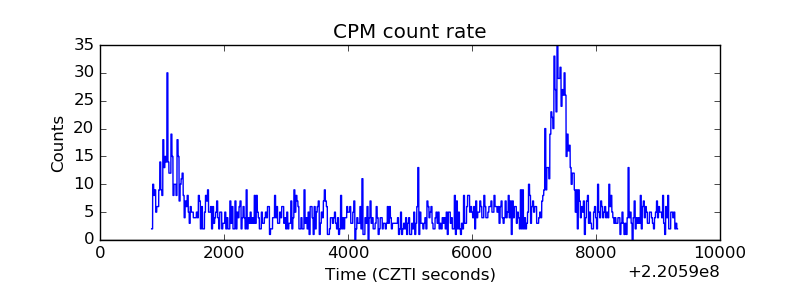 |
| CZT Counter | 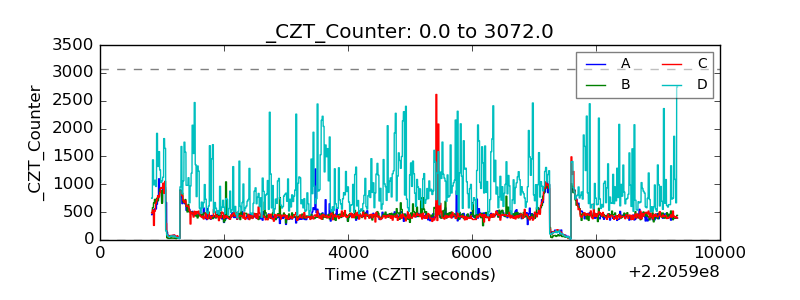 |
| +2.5 Volts monitor |  |
| +5 Volts monitor | 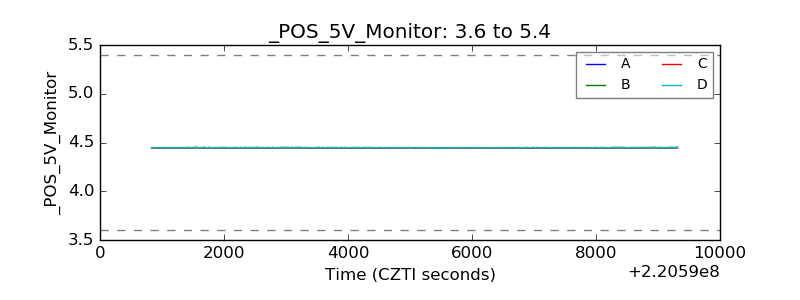 |
| _ROLL_ROT | 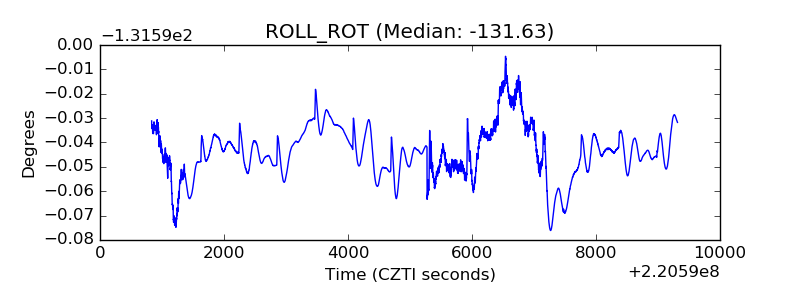 |
| _Roll_DEC | 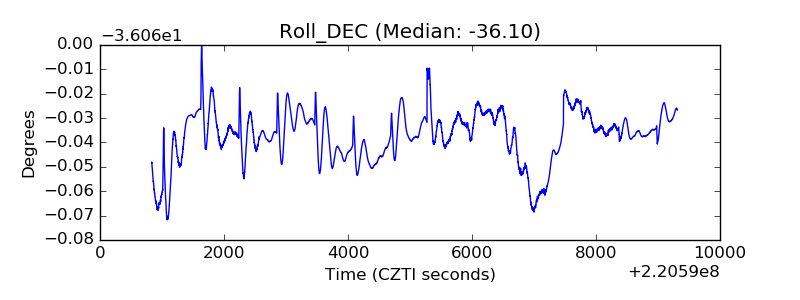 |
| _Roll_RA | 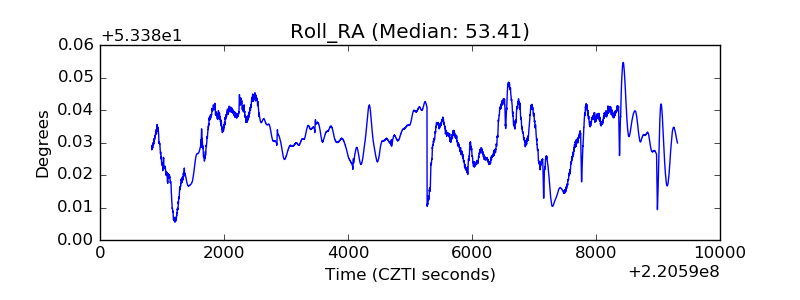 |
| Veto Counter | 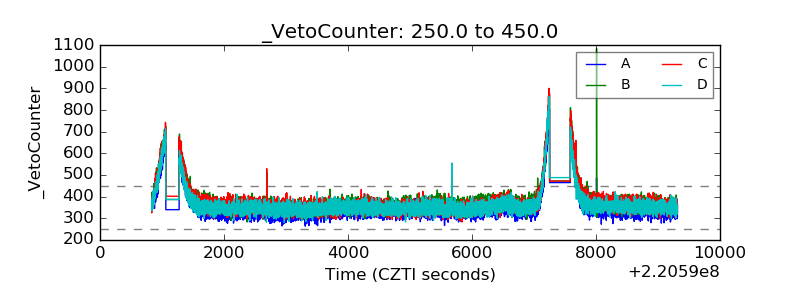 |