| Param | Original file | Final file |
|---|---|---|
| Filename | modeM0/AS1A02_006T01_9000000934_06774cztM0_level2.evt | modeM0/AS1A02_006T01_9000000934_06774cztM0_level2_quad_clean.evt |
| Size (bytes) | 284,273,280 | 42,891,840 |
| Size | 271.1 MB | 40.9 MB |
| Events in quadrant A | 1,515,099 | 268,907 |
| Events in quadrant B | 1,536,503 | 270,943 |
| Events in quadrant C | 1,488,925 | 270,504 |
| Events in quadrant D | 3,823,806 | 234,127 |
| Mode M0 | |||
|---|---|---|---|
| Quadrant | BADHDUFLAG | Total packets | Discarded packets |
| A | 0 | 7171 | 0 |
| B | 0 | 7189 | 0 |
| C | 0 | 7184 | 0 |
| D | 0 | 13926 | 0 |
| Mode SS | |||
|---|---|---|---|
| Quadrant | BADHDUFLAG | Total packets | Discarded packets |
| A | 0 | 72 | 0 |
| B | 0 | 72 | 0 |
| C | 0 | 72 | 0 |
| D | 0 | 72 | 0 |
| Quadrant | Total seconds | Saturated seconds | Saturation percentage |
|---|---|---|---|
| A | 3582 | 1 | 0.027917% |
| B | 3582 | 2 | 0.055835% |
| C | 3582 | 1 | 0.027917% |
| D | 3582 | 452 | 12.618649% |
Noise dominated data is calculated using 1-second bins in cleaned event files. If a bin has >2000 counts, and if more than 50% of those come from <1% of pixels, then it is considered to be noise-dominated and hence unusable.
| Quadrant | # 1 sec bins | Bins with >0 counts | Bins with >2000 counts | High rate bins dominated by noise | Noise dominated (total time) | Noise dominated (detector-on time) | Marked lightcurve |
|---|---|---|---|---|---|---|---|
| A | 3582 | 3582 | 0 | 0 | 0.00% | 0.00% | 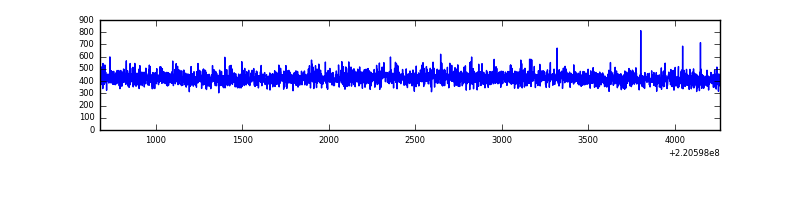 |
| B | 3582 | 3582 | 0 | 0 | 0.00% | 0.00% | 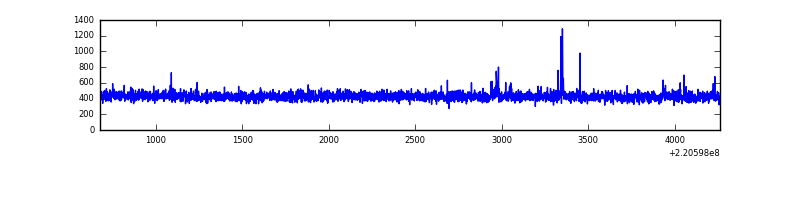 |
| C | 3582 | 3582 | 1 | 1 | 0.03% | 0.03% | 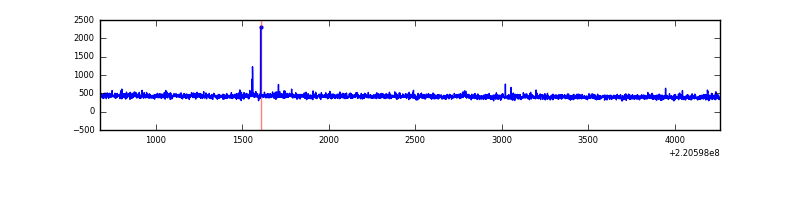 |
| D | 3582 | 3582 | 385 | 385 | 10.75% | 10.75% | 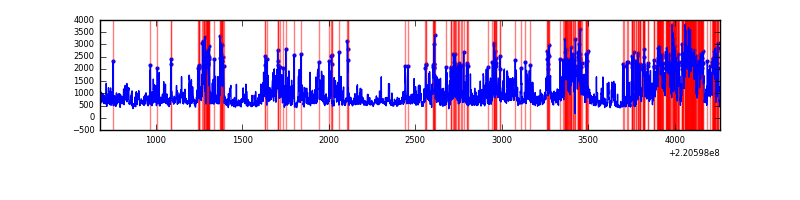 |
Top three noisy pixels from each quadrant. If the there are fewer than three noisy pixels in the level2.evt file, extra rows are filled as -1
| Pixel properties | Quadrant properties | ||||||
|---|---|---|---|---|---|---|---|
| Quadrant | DetID | PixID | Counts | Sigma | Mean | Median | Sigma |
| A | 8 | 15 | 9898 | 117.61 | 390 | 382 | 80.9 |
| A | 0 | 226 | 3750 | 41.63 | 390 | 382 | 80.9 |
| A | 12 | 194 | 3647 | 40.35 | 390 | 382 | 80.9 |
| B | 4 | 81 | 14741 | 186.38 | 391 | 380 | 77.1 |
| B | 12 | 111 | 7657 | 94.44 | 391 | 380 | 77.1 |
| B | 0 | 187 | 6423 | 78.43 | 391 | 380 | 77.1 |
| C | 10 | 22 | 11706 | 127.23 | 376 | 378 | 89.0 |
| C | 9 | 16 | 5931 | 62.37 | 376 | 378 | 89.0 |
| C | 13 | 61 | 2808 | 27.29 | 376 | 378 | 89.0 |
| D | 12 | 220 | 1341303 | 15144.1 | 355 | 343 | 88.5 |
| D | 2 | 33 | 358845 | 4048.73 | 355 | 343 | 88.5 |
| D | 2 | 152 | 334477 | 3773.53 | 355 | 343 | 88.5 |
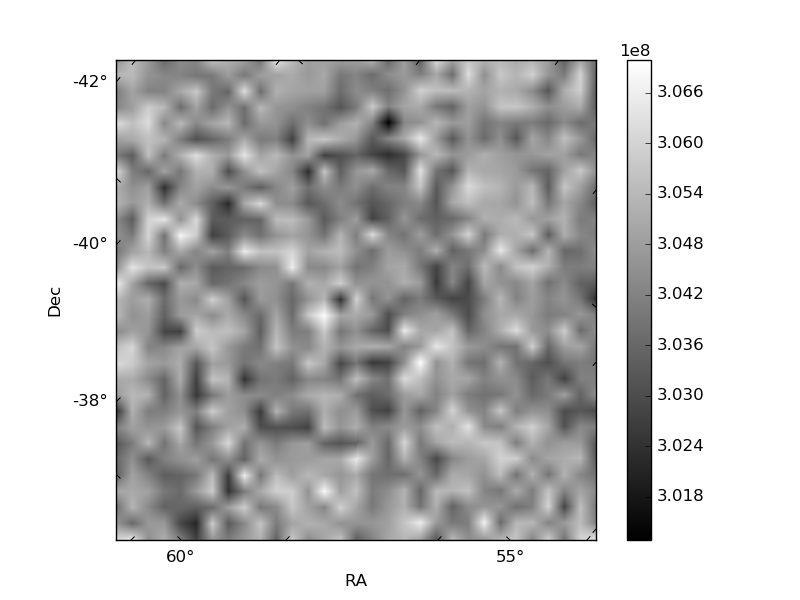
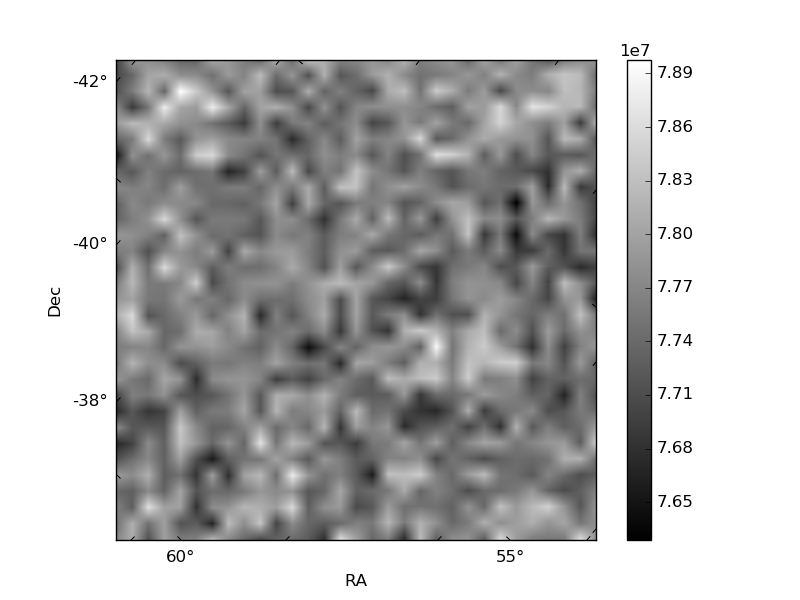
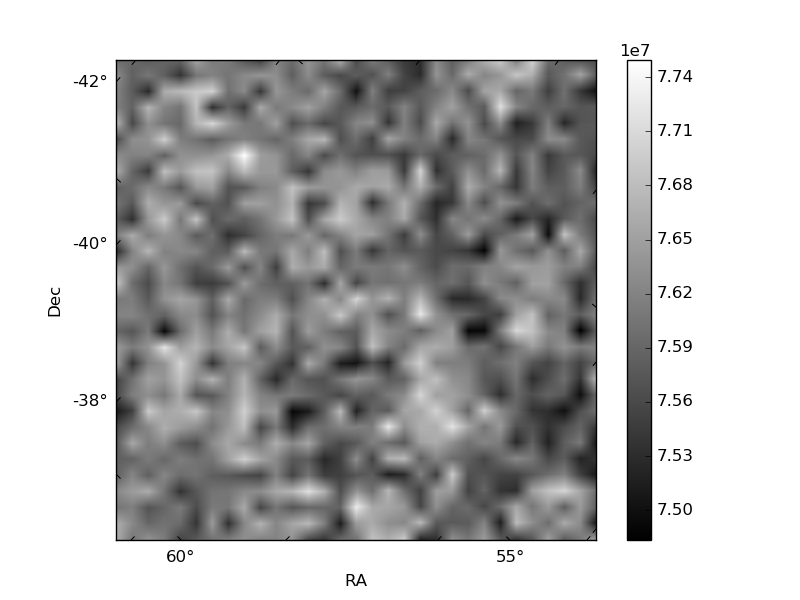
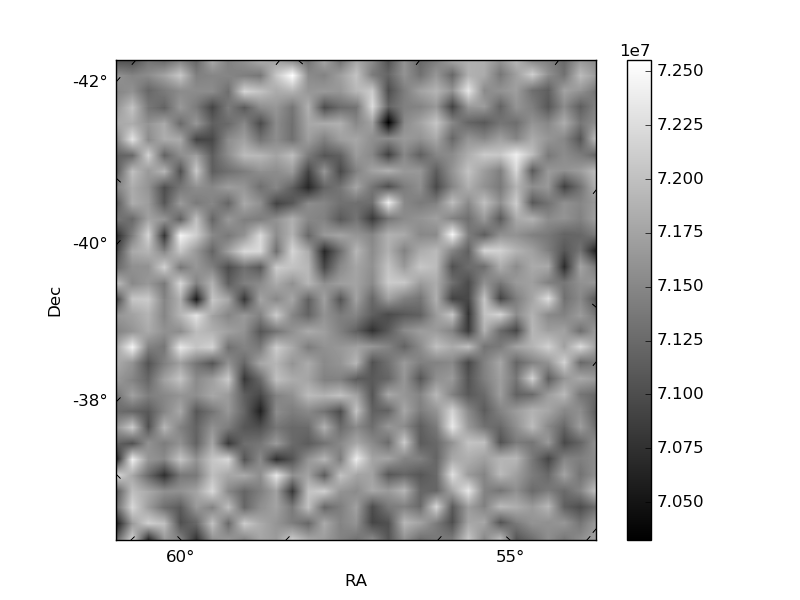
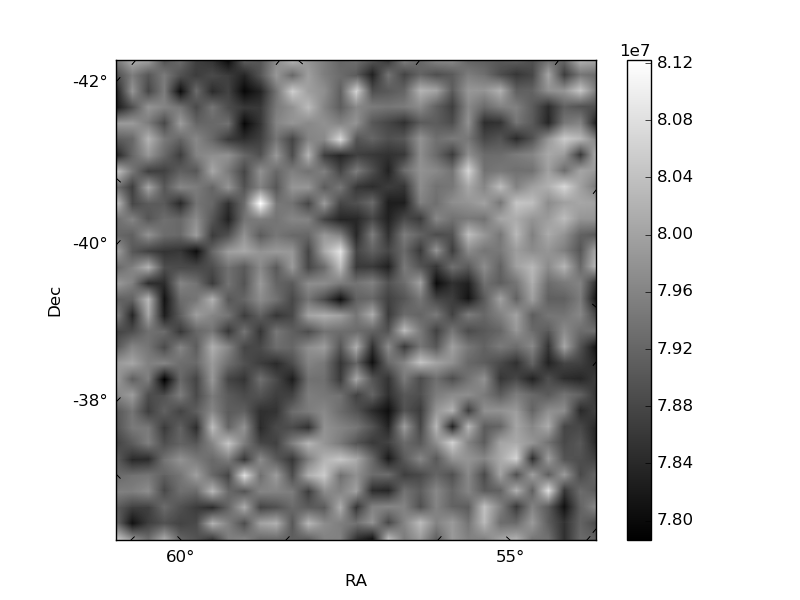
Histogram calculated using DETX and DETY for each event in the final _common_clean file
| Quadrant A | 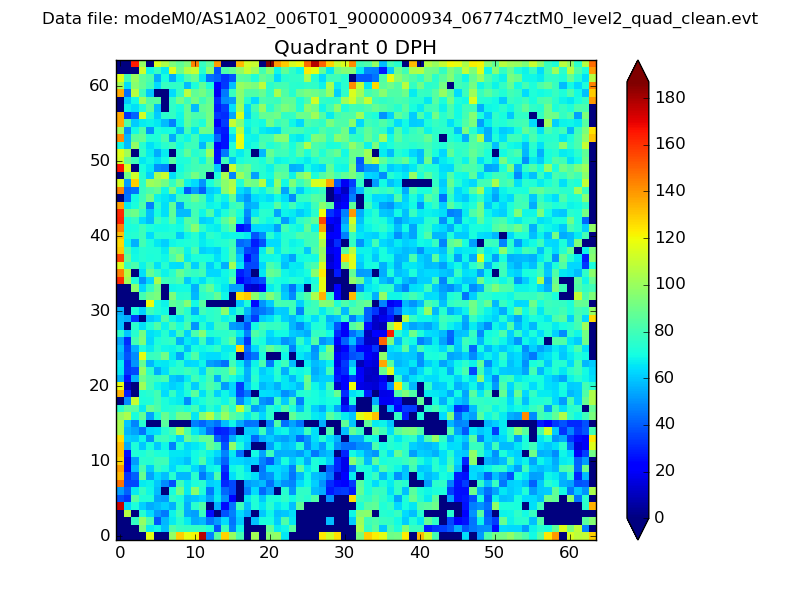 |
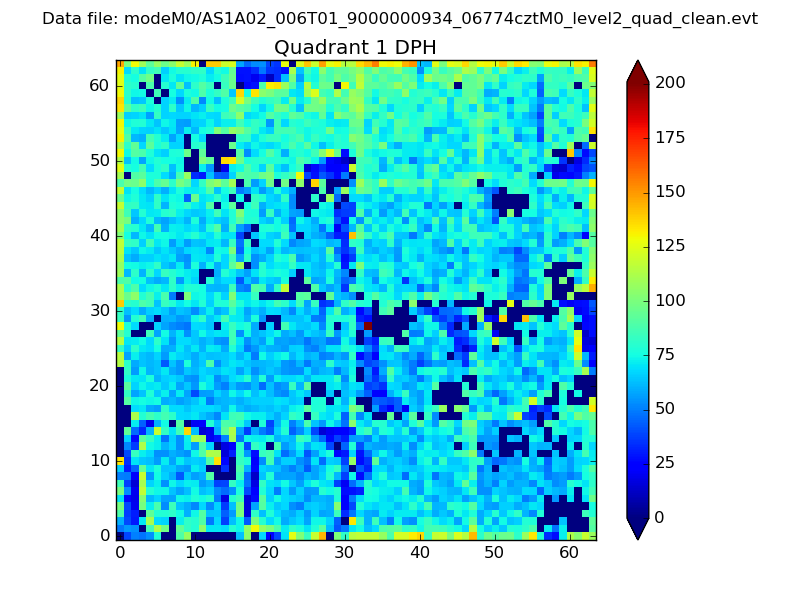 |
Quadrant B |
|---|---|---|---|
| Quadrant D | 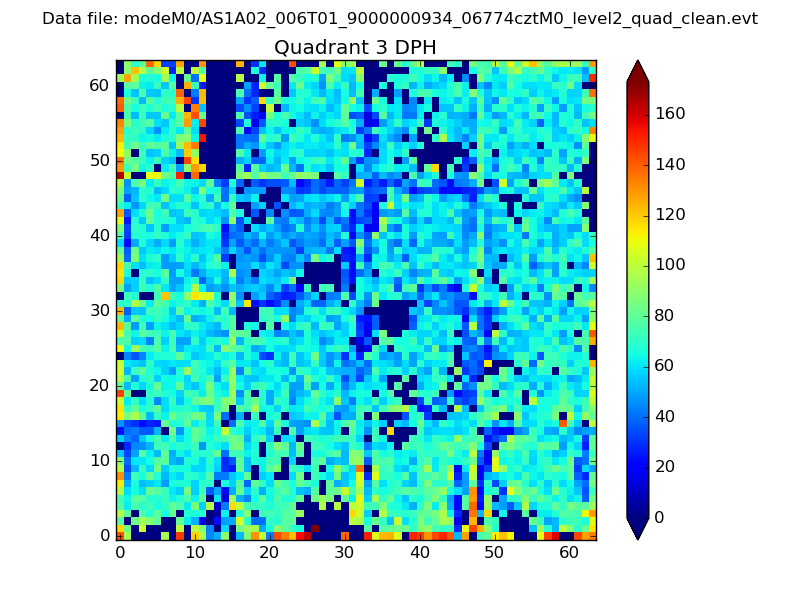 |
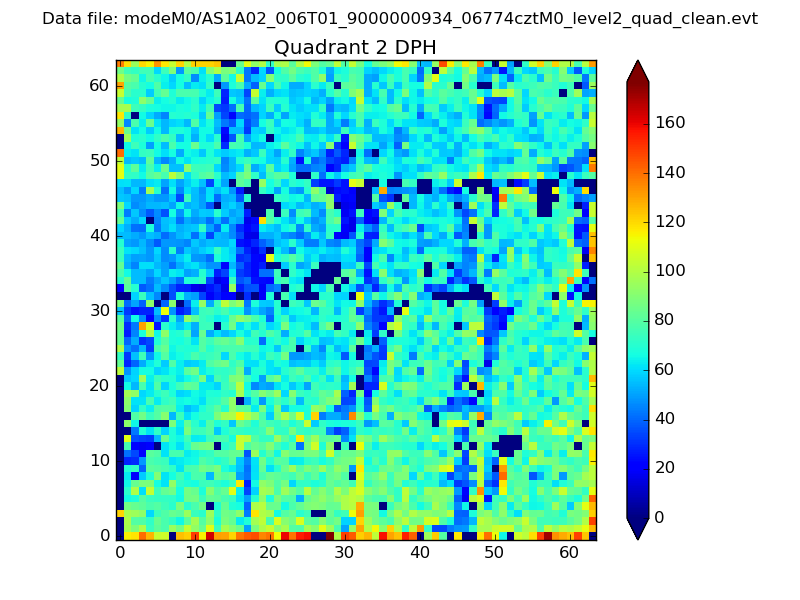 |
Quadrant C |
| Plot type | Count rate plots | Images |
|---|---|---|
| Comparison with Poisson distribution Blue bars denote a histogram of data divided into 1 sec bins. Red curve is a Poisson curve with rate = median count rate of data. |
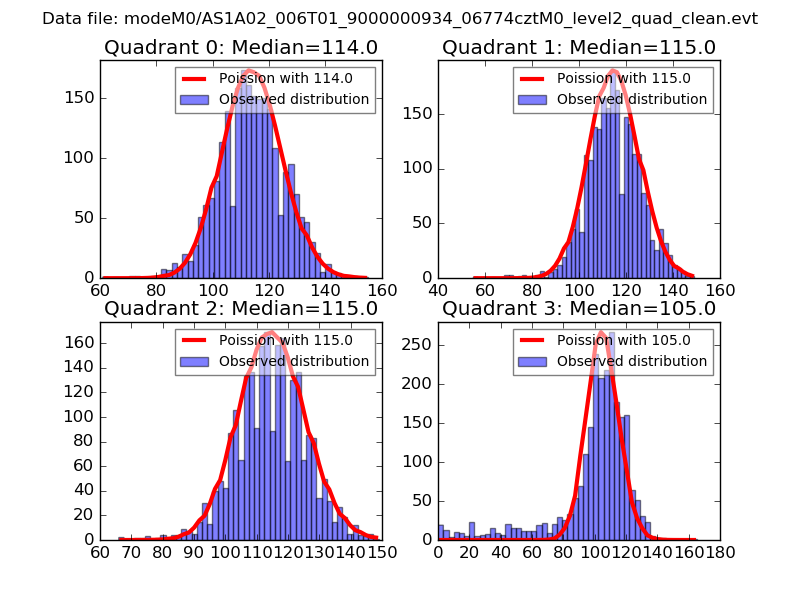 |
 |
| Quadrant-wise count rates Data is divided into 100 sec bins |
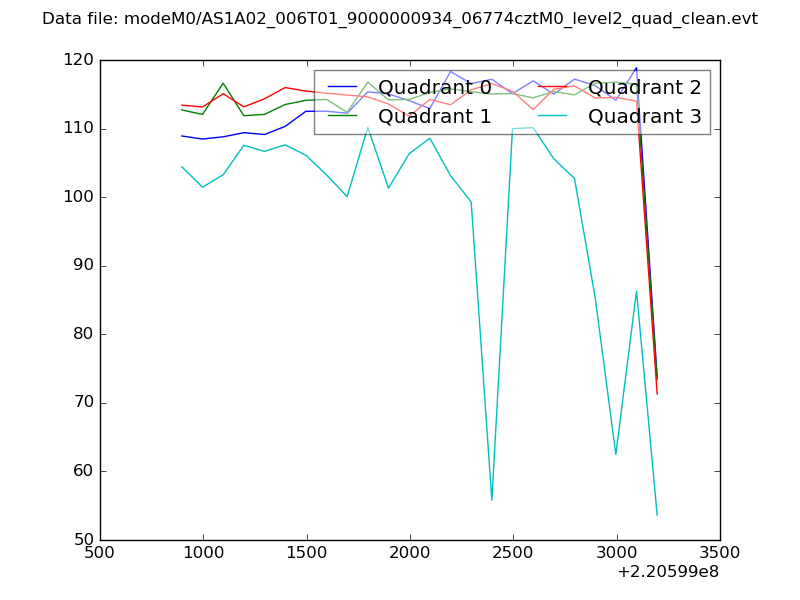 |
|
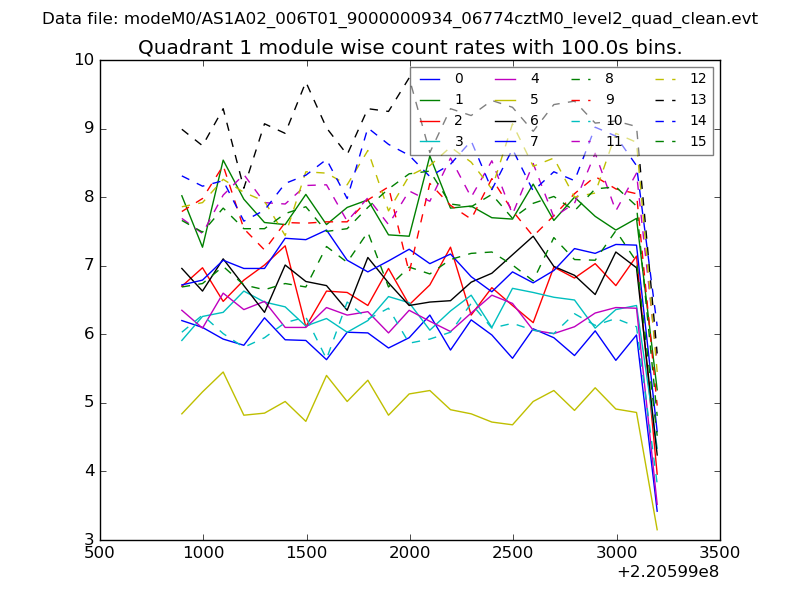
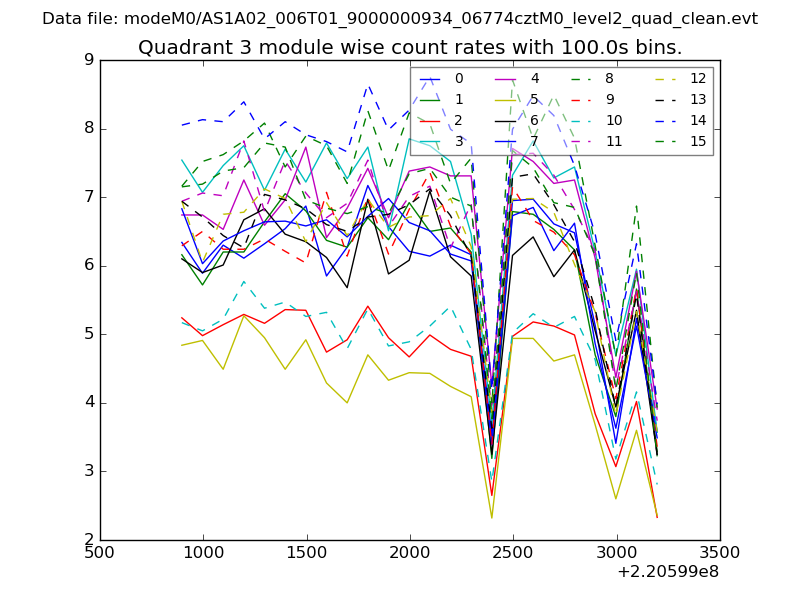
| Module-wise count rates for Quadrant A Data is divided into 100 sec bins |
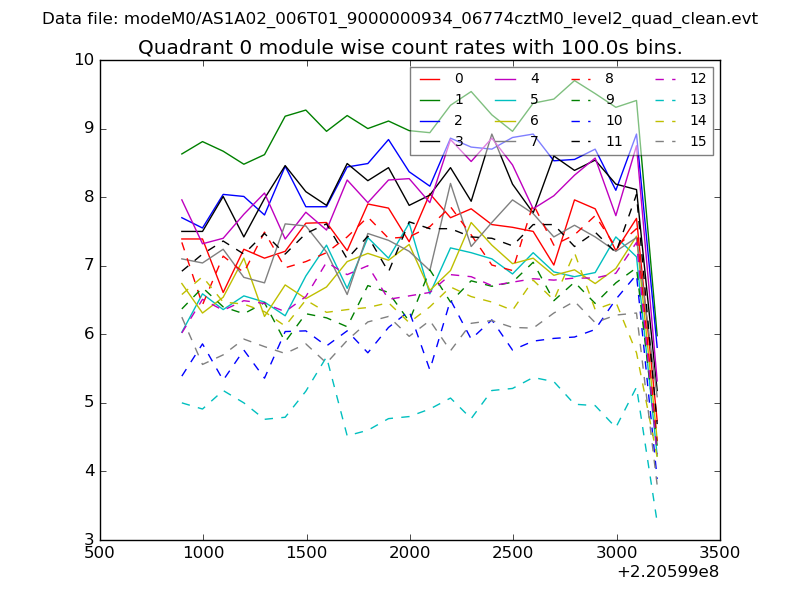 |
 |
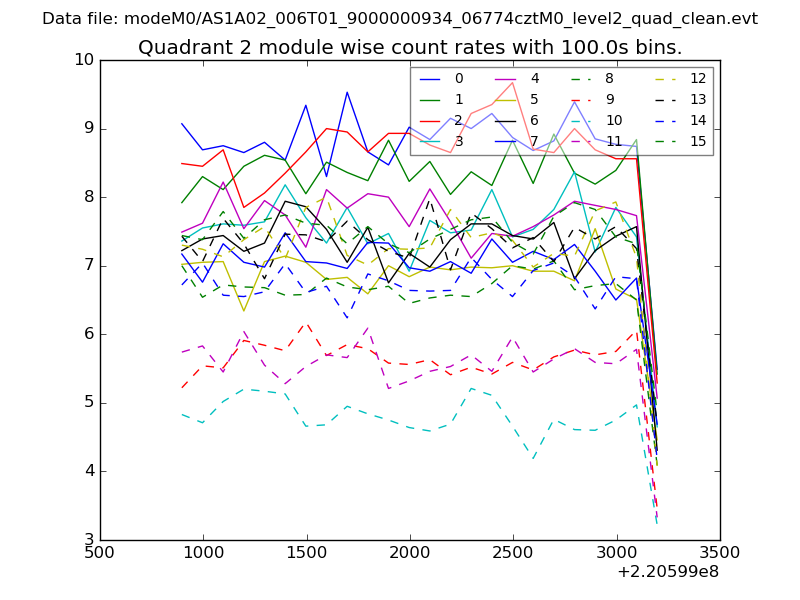
| Module-wise count rates for Quadrant B Data is divided into 100 sec bins |
 |
 |
| Module-wise count rates for Quadrant C Data is divided into 100 sec bins |
 |
 |
| Module-wise count rates for Quadrant D Data is divided into 100 sec bins |
 |
 |
| Parameter | Plot |
|---|---|
| CZT HV Monitor | 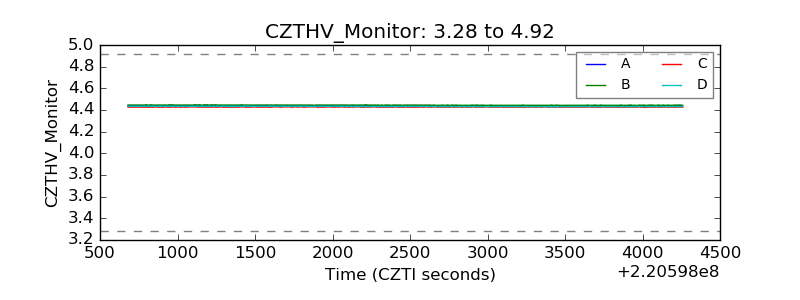 |
| D_VDD | 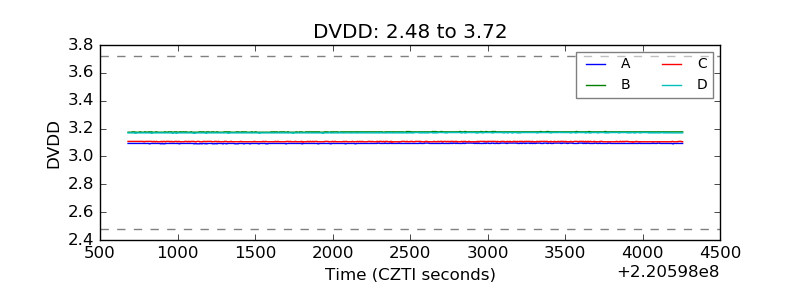 |
| Temperature 1 | 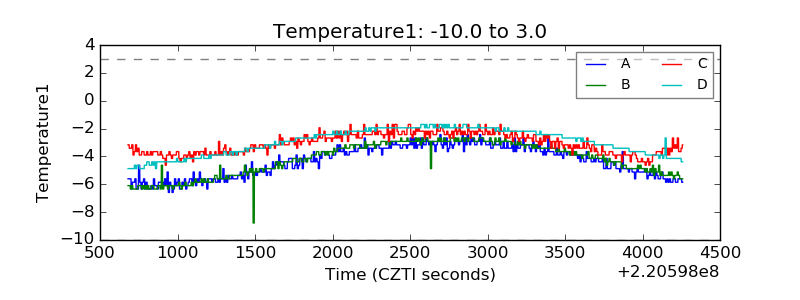 |
| Veto HV Monitor | 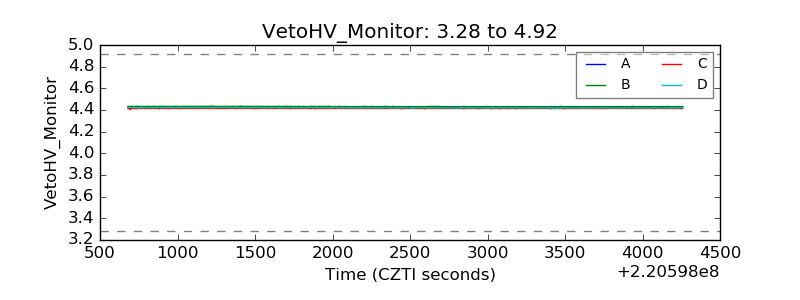 |
| Veto LLD | 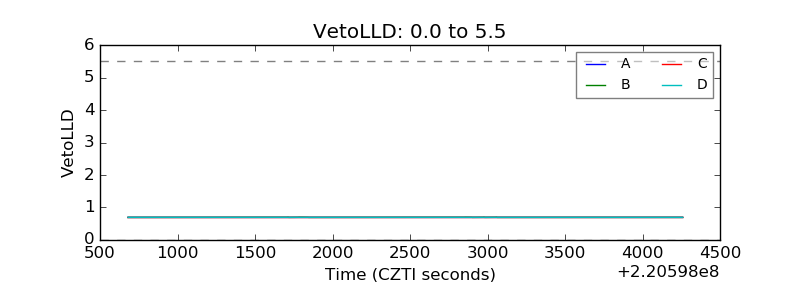 |
| Alpha Counter |  |
| _CPM_Rate |  |
| CZT Counter | 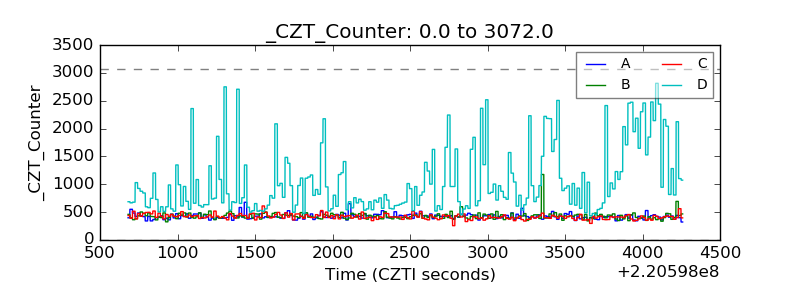 |
| +2.5 Volts monitor |  |
| +5 Volts monitor |  |
| _ROLL_ROT | 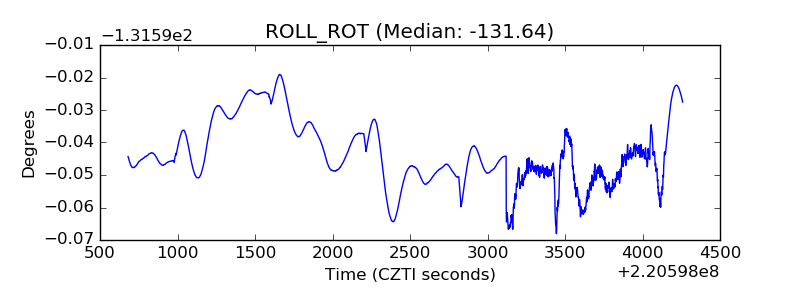 |
| _Roll_DEC | 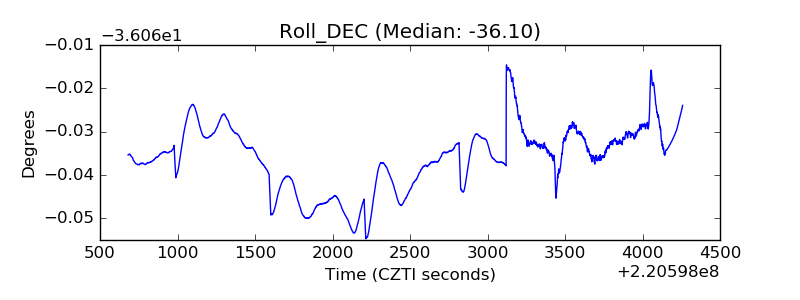 |
| _Roll_RA | 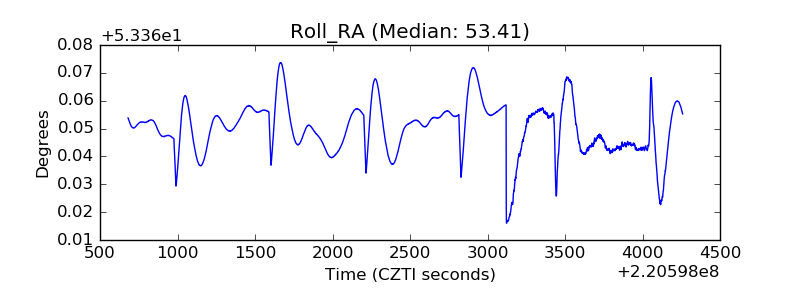 |
| Veto Counter | 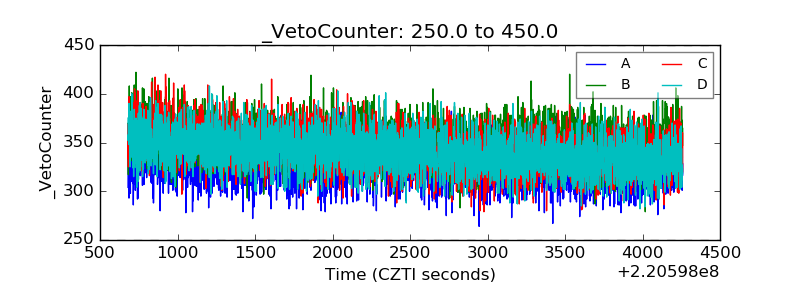 |