| Param | Original file | Final file |
|---|---|---|
| Filename | modeM0/AS1G06_086T02_9000000936cztM0_level2.fits | modeM0/AS1G06_086T02_9000000936cztM0_level2_quad_clean.evt |
| Size (bytes) | 2,204,645,760 | 2,221,951,680 |
| Size | 2.1 GB | 2.1 GB |
| Events in quadrant A | 13,381,436 | 13,412,223 |
| Events in quadrant B | 12,928,732 | 13,411,757 |
| Events in quadrant C | 13,110,336 | 12,702,799 |
| Events in quadrant D | 11,105,016 | 11,531,277 |
| Mode M9 | |||
|---|---|---|---|
| Quadrant | BADHDUFLAG | Total packets | Discarded packets |
| A | 0 | 378 | 0 |
| B | 0 | 373 | 0 |
| C | 0 | 374 | 0 |
| D | 0 | 372 | 0 |
| Mode M0 | |||
|---|---|---|---|
| Quadrant | BADHDUFLAG | Total packets | Discarded packets |
| A | 0 | 496765 | 0 |
| B | 0 | 509021 | 0 |
| C | 0 | 498755 | 0 |
| D | 0 | 600066 | 0 |
| Mode SS | |||
|---|---|---|---|
| Quadrant | BADHDUFLAG | Total packets | Discarded packets |
| A | 0 | 4856 | 0 |
| B | 0 | 4860 | 0 |
| C | 0 | 4842 | 0 |
| D | 0 | 4840 | 0 |
| Quadrant | Total seconds | Saturated seconds | Saturation percentage |
|---|---|---|---|
| A | 237024 | 2742 | 1.156845% |
| B | 237062 | 4153 | 1.751862% |
| C | 237039 | 2426 | 1.023460% |
| D | 236966 | 7996 | 3.374324% |
Noise dominated data is calculated using 1-second bins in cleaned event files. If a bin has >2000 counts, and if more than 50% of those come from <1% of pixels, then it is considered to be noise-dominated and hence unusable.
| Quadrant | # 1 sec bins | Bins with >0 counts | Bins with >2000 counts | High rate bins dominated by noise | Noise dominated (total time) | Noise dominated (detector-on time) | Marked lightcurve |
|---|---|---|---|---|---|---|---|
| A | 305390 | 237473 | 0 | 0 | 0.00% | 0.00% | 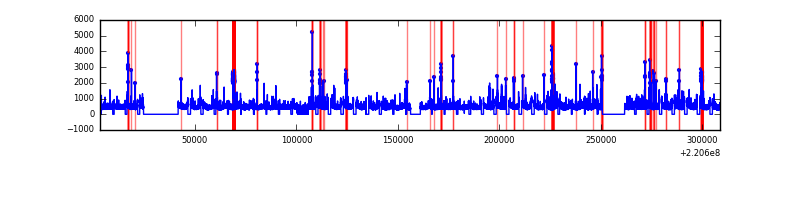 |
| B | 305390 | 237521 | 0 | 0 | 0.00% | 0.00% |  |
| C | 305390 | 237429 | 0 | 0 | 0.00% | 0.00% | 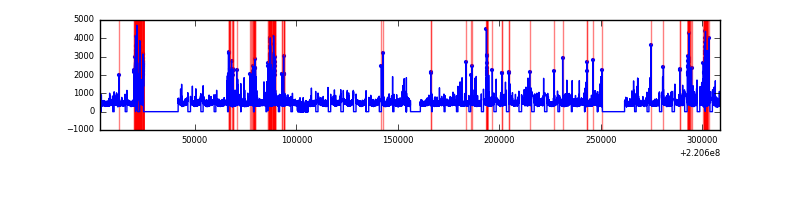 |
| D | 305390 | 237315 | 0 | 0 | 0.00% | 0.00% | 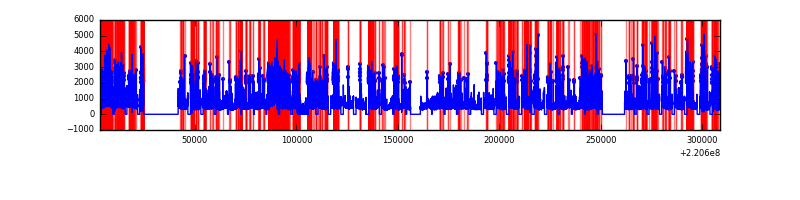 |
Top three noisy pixels from each quadrant. If the there are fewer than three noisy pixels in the level2.evt file, extra rows are filled as -1
| Pixel properties | Quadrant properties | ||||||
|---|---|---|---|---|---|---|---|
| Quadrant | DetID | PixID | Counts | Sigma | Mean | Median | Sigma |
| A | 0 | 29 | 12729 | 10.78 | 3480 | 3243 | 879.9 |
| A | 7 | 110 | 11249 | 9.1 | 3480 | 3243 | 879.9 |
| A | 0 | 30 | 9937 | 7.61 | 3480 | 3243 | 879.9 |
| B | 2 | 9 | 10961 | 11.36 | 3411 | 3235 | 680.1 |
| B | 12 | 226 | 8930 | 8.37 | 3411 | 3235 | 680.1 |
| B | 14 | 254 | 8817 | 8.21 | 3411 | 3235 | 680.1 |
| C | 1 | 80 | 9742 | 7.18 | 3462 | 3195 | 912.0 |
| C | 1 | 81 | 9533 | 6.95 | 3462 | 3195 | 912.0 |
| C | 12 | 241 | 9267 | 6.66 | 3462 | 3195 | 912.0 |
| D | 7 | 5 | 8167 | 6.32 | 3174 | 2876 | 837.0 |
| D | 6 | 231 | 8081 | 6.22 | 3174 | 2876 | 837.0 |
| D | 7 | 3 | 7943 | 6.05 | 3174 | 2876 | 837.0 |
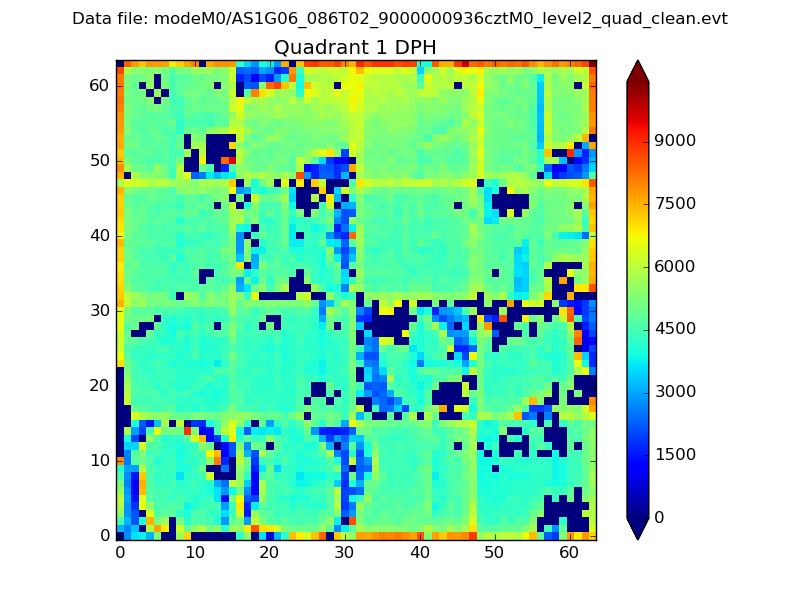
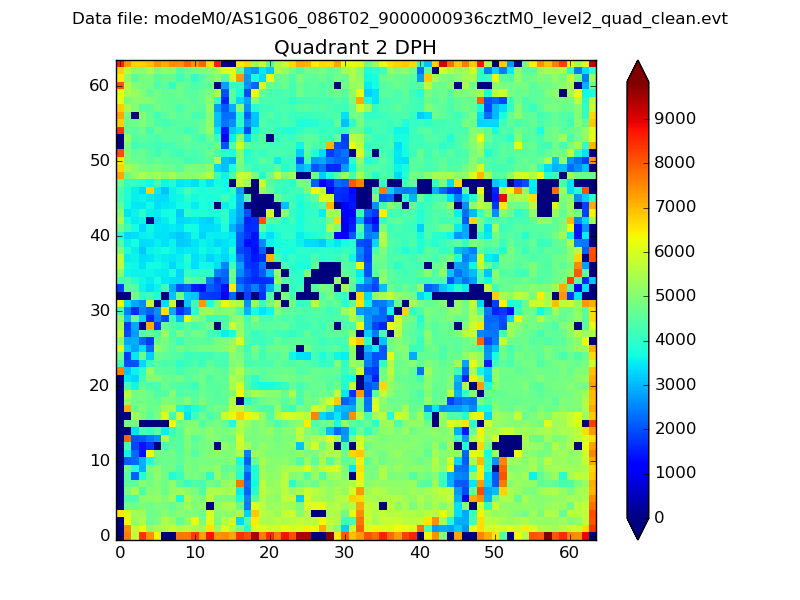
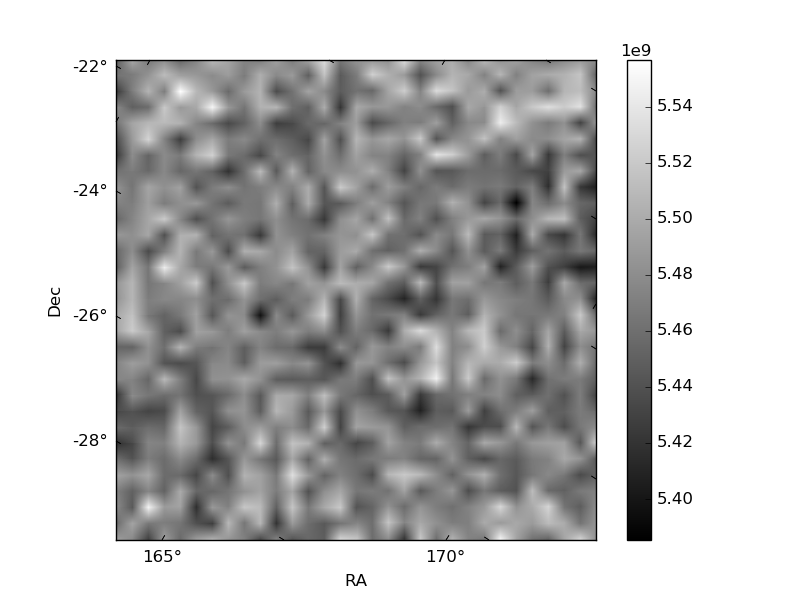
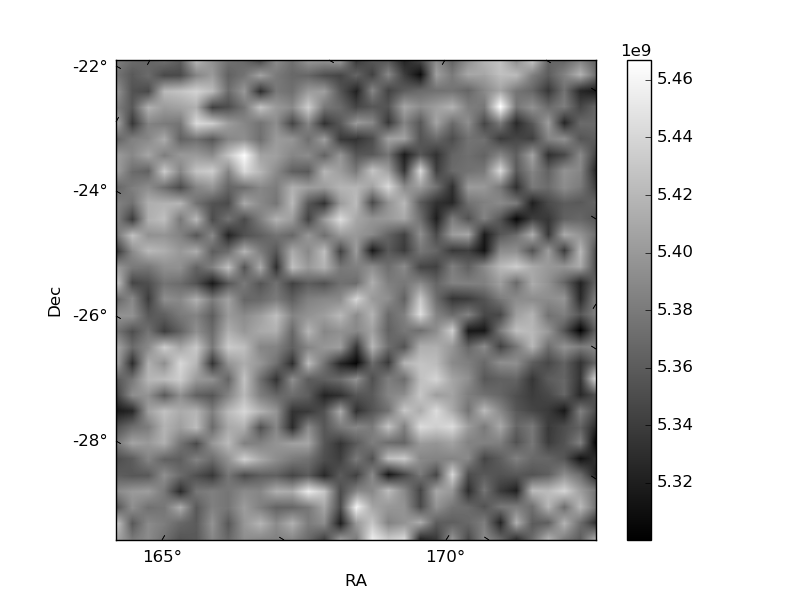
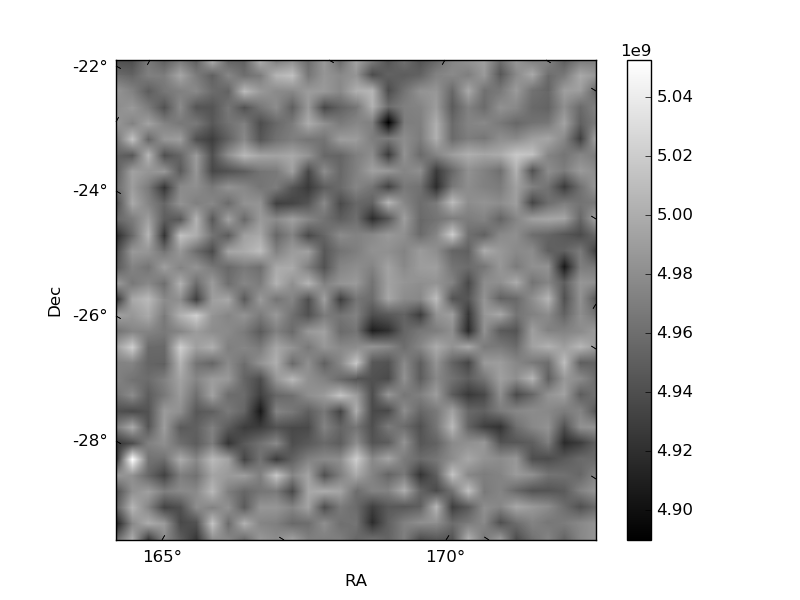
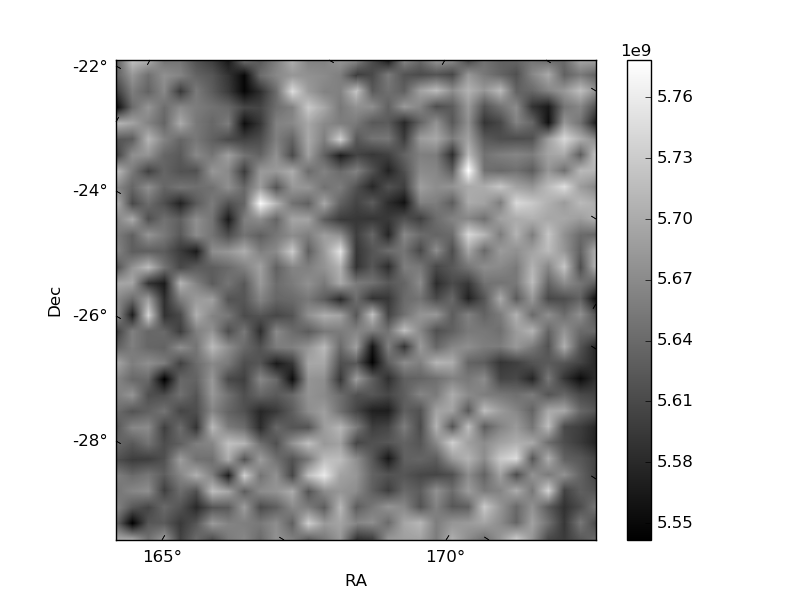
Histogram calculated using DETX and DETY for each event in the final _common_clean file
| Quadrant A | 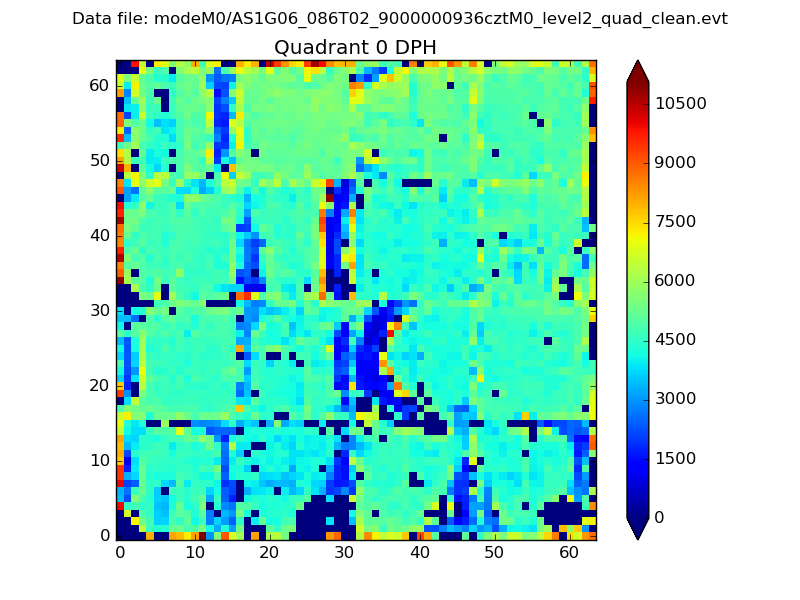 |
 |
Quadrant B |
|---|---|---|---|
| Quadrant D | 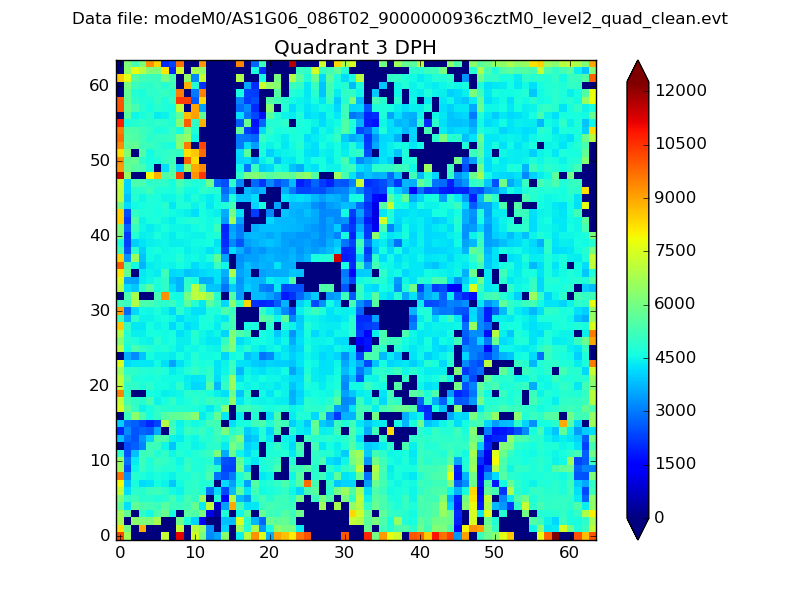 |
 |
Quadrant C |
| Plot type | Count rate plots | Images |
|---|---|---|
| Comparison with Poisson distribution Blue bars denote a histogram of data divided into 1 sec bins. Red curve is a Poisson curve with rate = median count rate of data. |
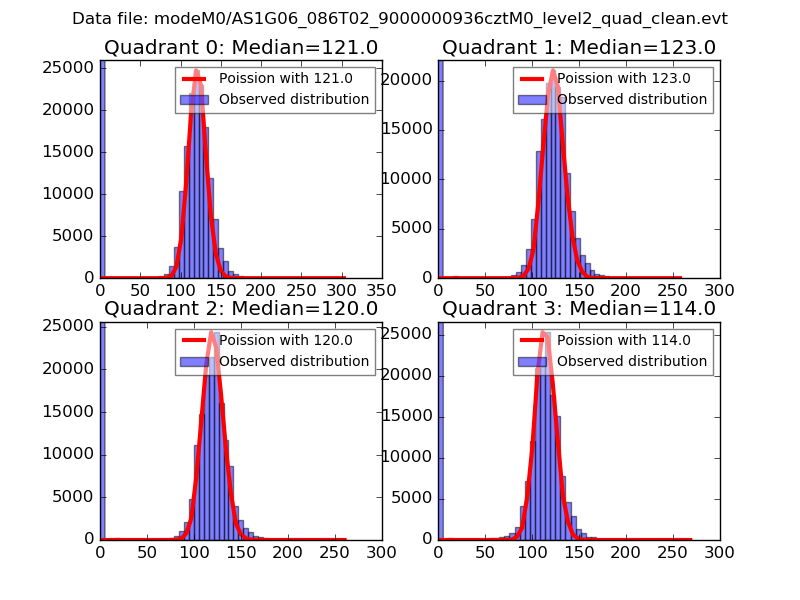 |
 |
| Quadrant-wise count rates Data is divided into 100 sec bins |
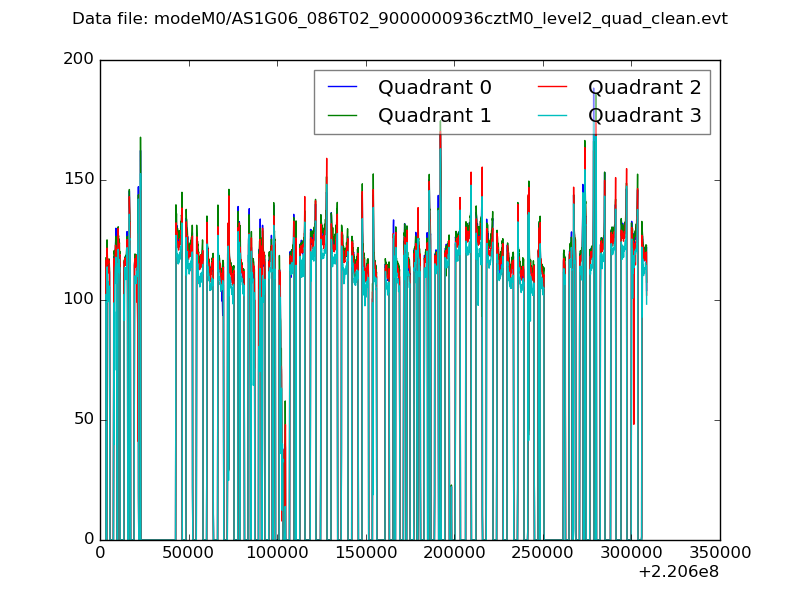 |
|
| Module-wise count rates for Quadrant A Data is divided into 100 sec bins |
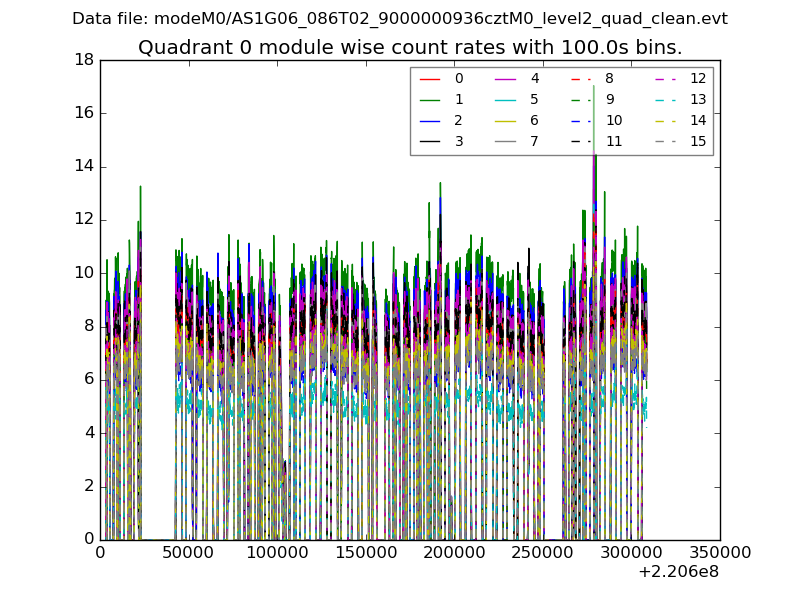 |
 |
| Module-wise count rates for Quadrant B Data is divided into 100 sec bins |
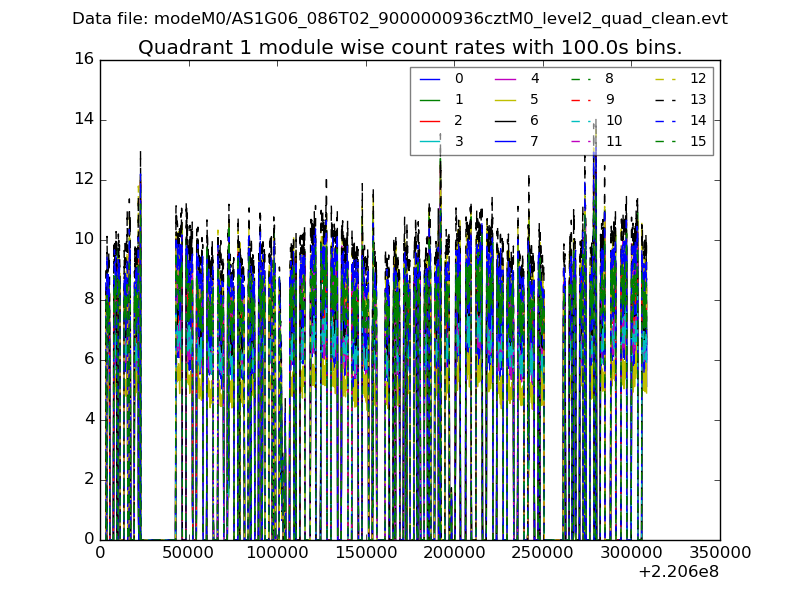 |
 |
| Module-wise count rates for Quadrant C Data is divided into 100 sec bins |
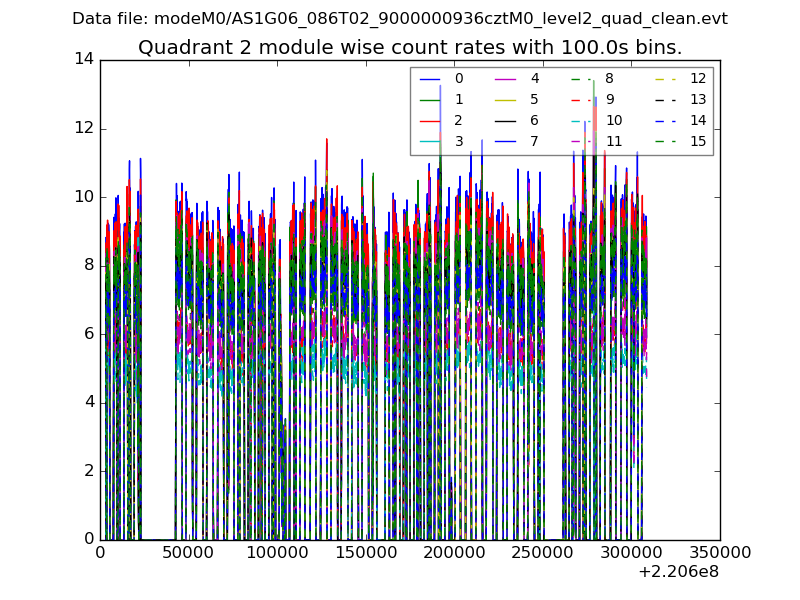 |
 |
| Module-wise count rates for Quadrant D Data is divided into 100 sec bins |
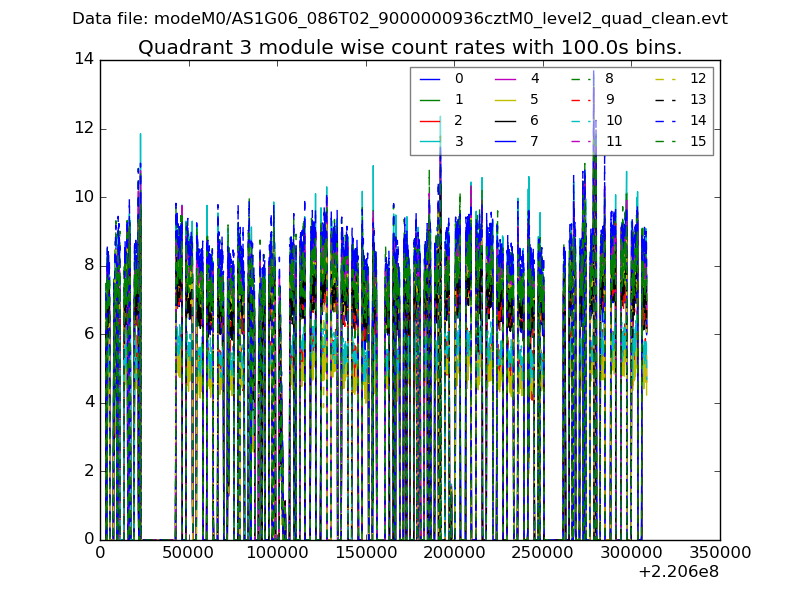 |
 |
| Parameter | Plot |
|---|---|
| CZT HV Monitor | 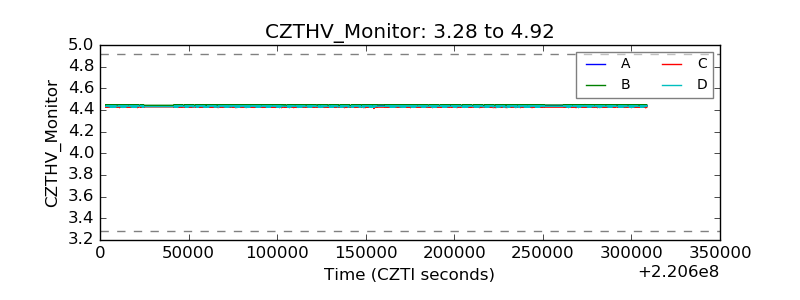 |
| D_VDD | 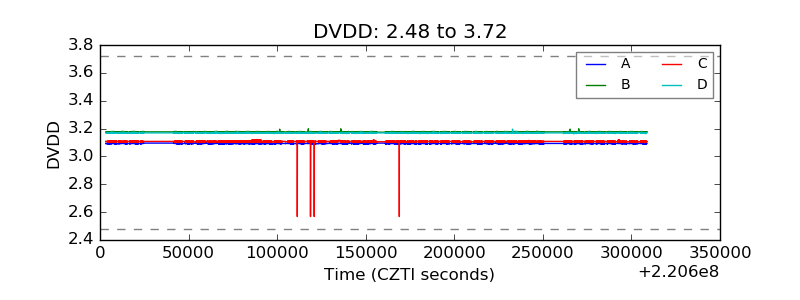 |
| Temperature 1 |  |
| Veto HV Monitor | 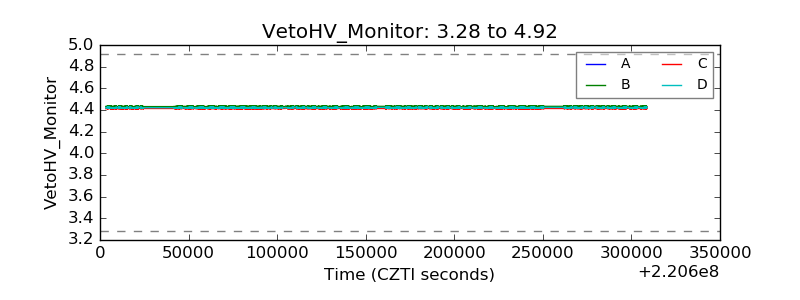 |
| Veto LLD | 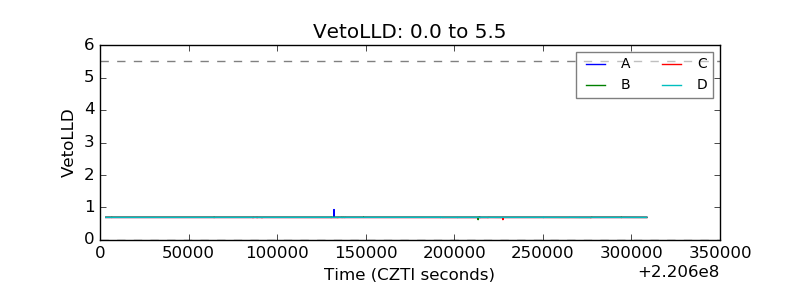 |
| Alpha Counter | 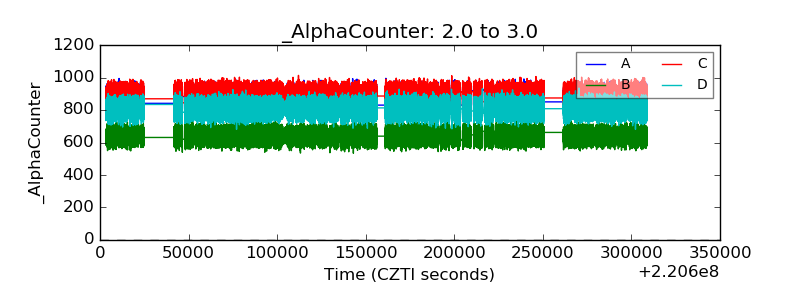 |
| _CPM_Rate |  |
| CZT Counter | 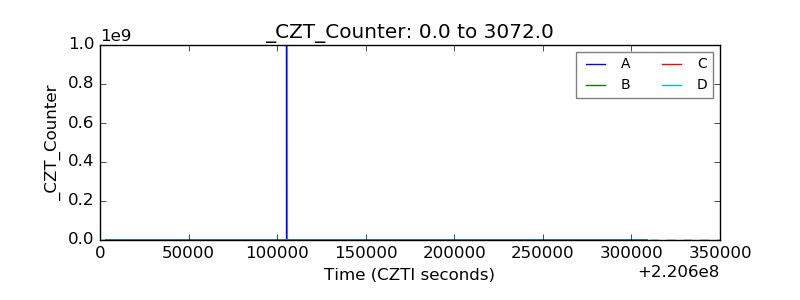 |
| +2.5 Volts monitor | 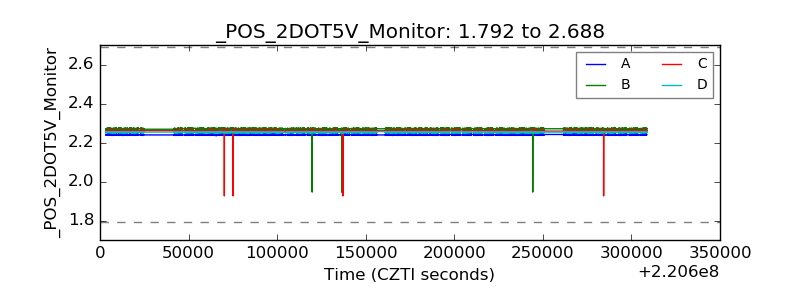 |
| +5 Volts monitor | 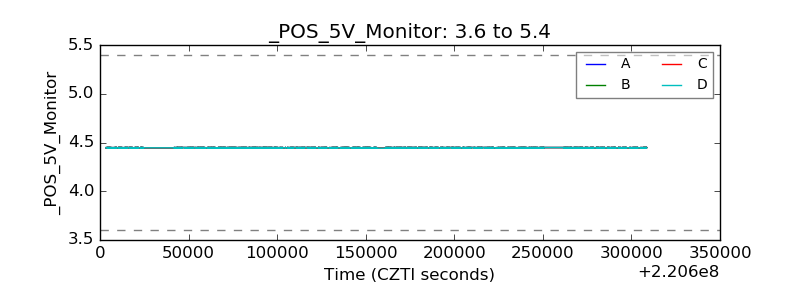 |
| _ROLL_ROT | 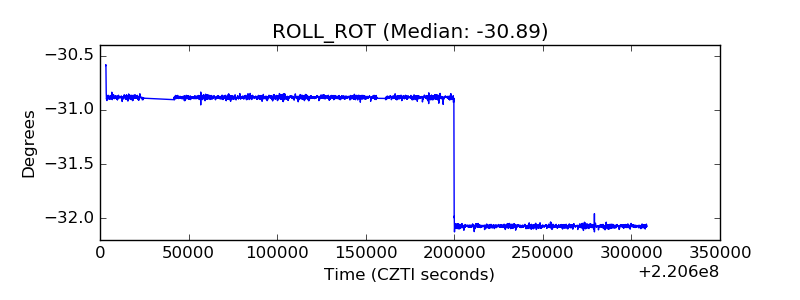 |
| _Roll_DEC | 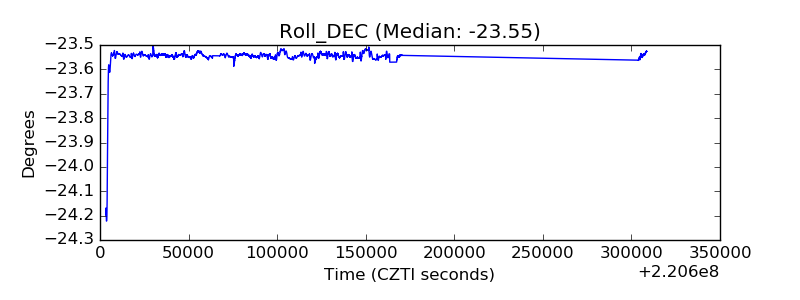 |
| _Roll_RA |  |
| Veto Counter | 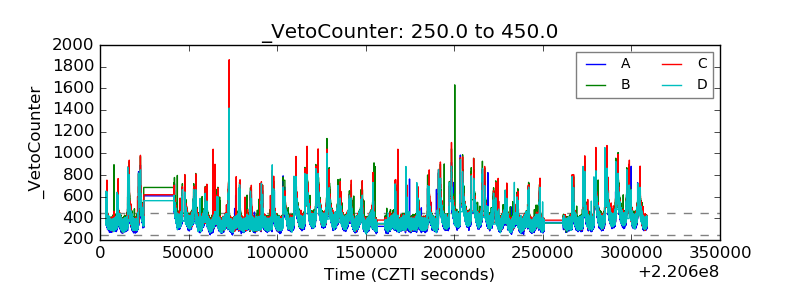 |