| Param | Original file | Final file |
|---|---|---|
| Filename | modeM0/AS1G06_086T02_9000000936_06771cztM0_level2.evt | modeM0/AS1G06_086T02_9000000936_06771cztM0_level2_quad_clean.evt |
| Size (bytes) | 1,942,937,280 | 226,941,120 |
| Size | 1.8 GB | 216.4 MB |
| Events in quadrant A | 10,301,815 | 1,418,113 |
| Events in quadrant B | 10,459,566 | 1,433,284 |
| Events in quadrant C | 16,304,947 | 1,183,396 |
| Events in quadrant D | 20,284,773 | 1,314,067 |
| Mode M9 | |||
|---|---|---|---|
| Quadrant | BADHDUFLAG | Total packets | Discarded packets |
| A | 0 | 39 | 0 |
| B | 0 | 39 | 0 |
| C | 0 | 39 | 0 |
| D | 0 | 39 | 0 |
| Mode M0 | |||
|---|---|---|---|
| Quadrant | BADHDUFLAG | Total packets | Discarded packets |
| A | 0 | 45674 | 5 |
| B | 0 | 45884 | 4 |
| C | 0 | 63735 | 4 |
| D | 0 | 75760 | 4 |
| Mode SS | |||
|---|---|---|---|
| Quadrant | BADHDUFLAG | Total packets | Discarded packets |
| A | 0 | 448 | 0 |
| B | 0 | 448 | 0 |
| C | 0 | 448 | 0 |
| D | 0 | 448 | 0 |
| Quadrant | Total seconds | Saturated seconds | Saturation percentage |
|---|---|---|---|
| A | 22123 | 241 | 1.089364% |
| B | 22123 | 260 | 1.175247% |
| C | 22123 | 2997 | 13.546987% |
| D | 22123 | 1853 | 8.375898% |
Noise dominated data is calculated using 1-second bins in cleaned event files. If a bin has >2000 counts, and if more than 50% of those come from <1% of pixels, then it is considered to be noise-dominated and hence unusable.
| Quadrant | # 1 sec bins | Bins with >0 counts | Bins with >2000 counts | High rate bins dominated by noise | Noise dominated (total time) | Noise dominated (detector-on time) | Marked lightcurve |
|---|---|---|---|---|---|---|---|
| A | 25898 | 22127 | 9 | 9 | 0.03% | 0.04% | 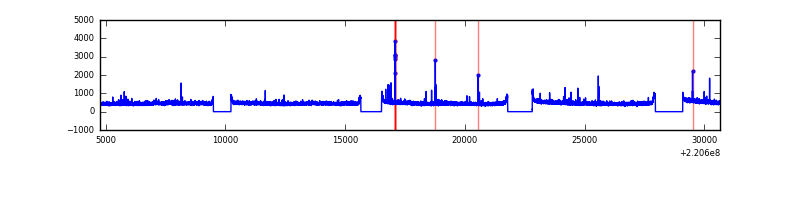 |
| B | 25898 | 22127 | 4 | 4 | 0.02% | 0.02% | 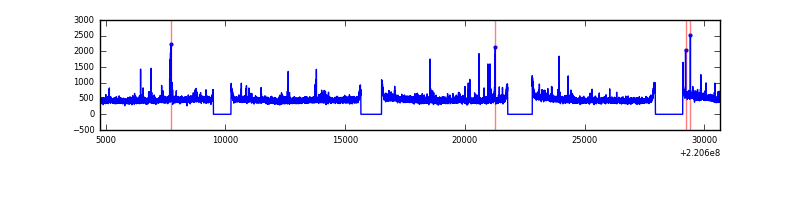 |
| C | 25898 | 22127 | 1981 | 1981 | 7.65% | 8.95% | 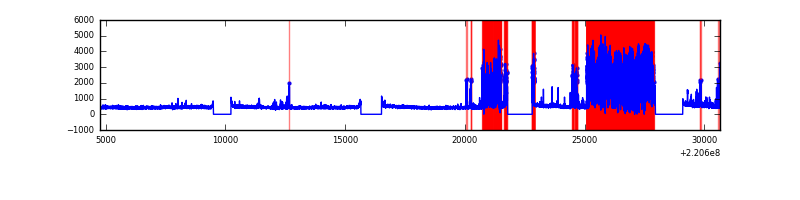 |
| D | 25898 | 22127 | 1270 | 1270 | 4.90% | 5.74% | 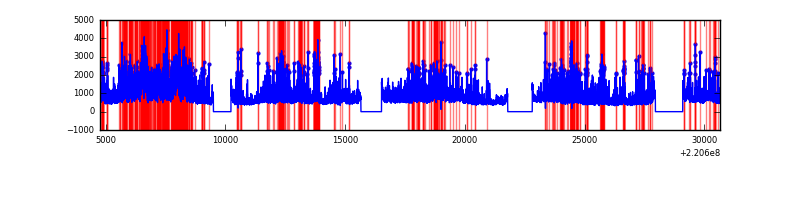 |
Top three noisy pixels from each quadrant. If the there are fewer than three noisy pixels in the level2.evt file, extra rows are filled as -1
| Pixel properties | Quadrant properties | ||||||
|---|---|---|---|---|---|---|---|
| Quadrant | DetID | PixID | Counts | Sigma | Mean | Median | Sigma |
| A | 8 | 15 | 146746 | 271.47 | 2604 | 2541 | 531.2 |
| A | 15 | 239 | 73385 | 133.37 | 2604 | 2541 | 531.2 |
| A | 13 | 248 | 40646 | 71.73 | 2604 | 2541 | 531.2 |
| B | 4 | 81 | 113907 | 222.47 | 2620 | 2553 | 500.5 |
| B | 4 | 48 | 106206 | 207.09 | 2620 | 2553 | 500.5 |
| B | 0 | 214 | 64402 | 123.57 | 2620 | 2553 | 500.5 |
| C | 9 | 247 | 7097385 | 13229.44 | 2335 | 2349 | 536.3 |
| C | 9 | 16 | 77471 | 140.07 | 2335 | 2349 | 536.3 |
| C | 13 | 61 | 18382 | 29.9 | 2335 | 2349 | 536.3 |
| D | 12 | 220 | 5760124 | 9584.76 | 2460 | 2382 | 600.7 |
| D | 2 | 33 | 1664600 | 2767.05 | 2460 | 2382 | 600.7 |
| D | 8 | 195 | 1512217 | 2513.38 | 2460 | 2382 | 600.7 |
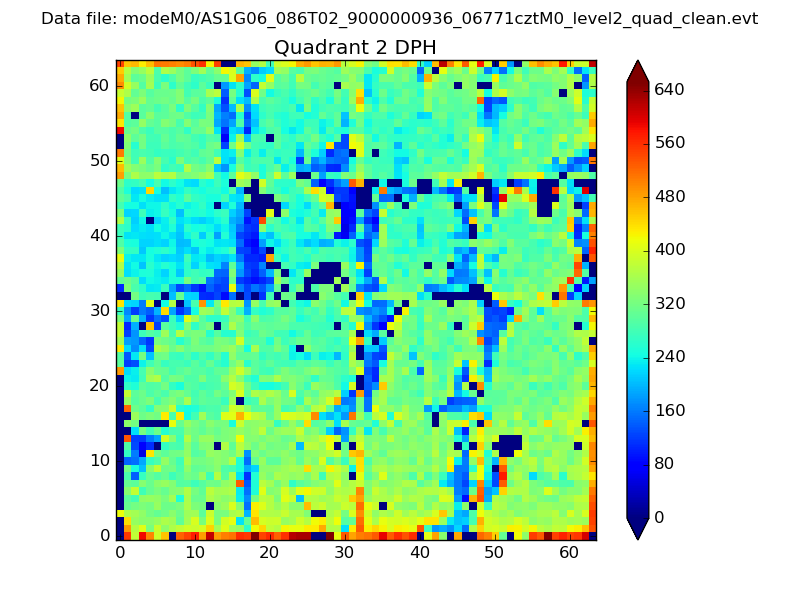
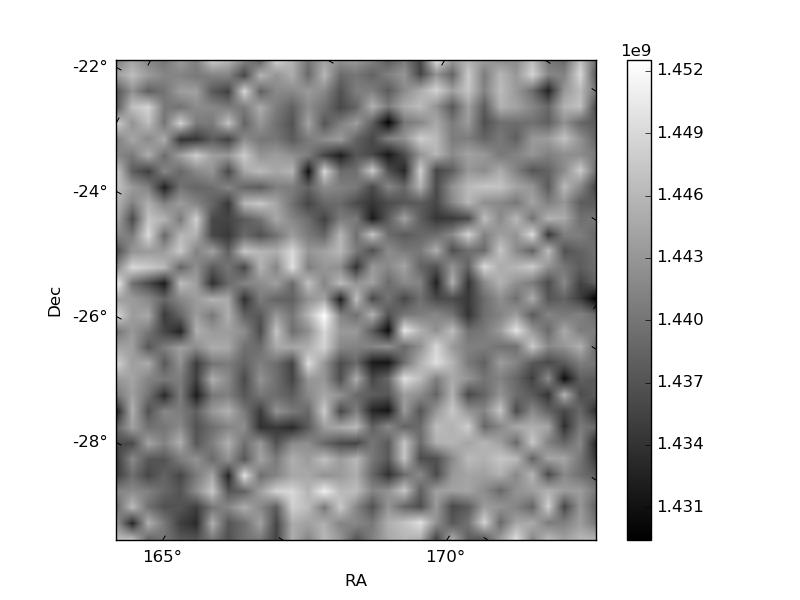
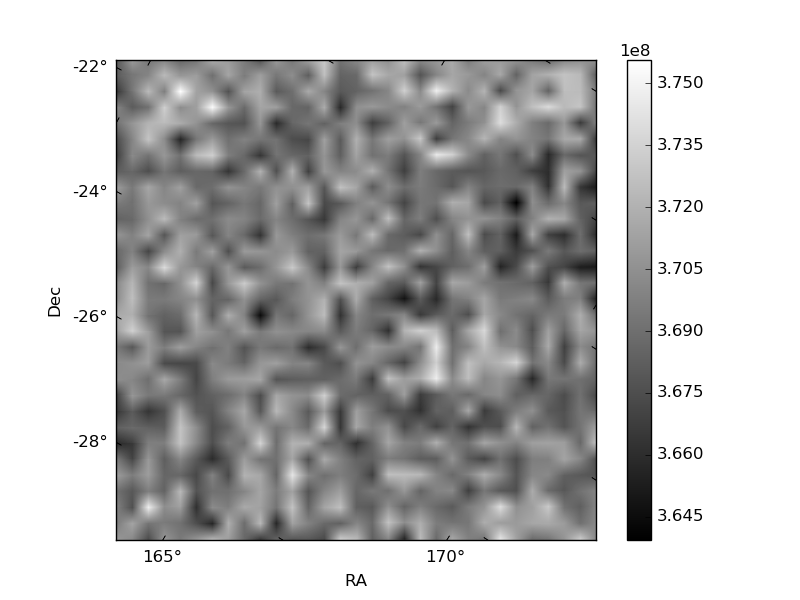
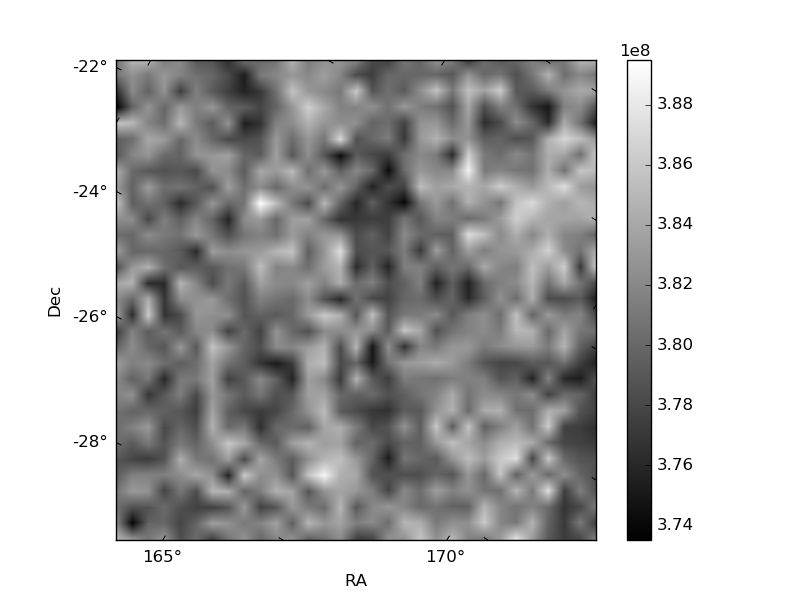
Histogram calculated using DETX and DETY for each event in the final _common_clean file
| Quadrant A | 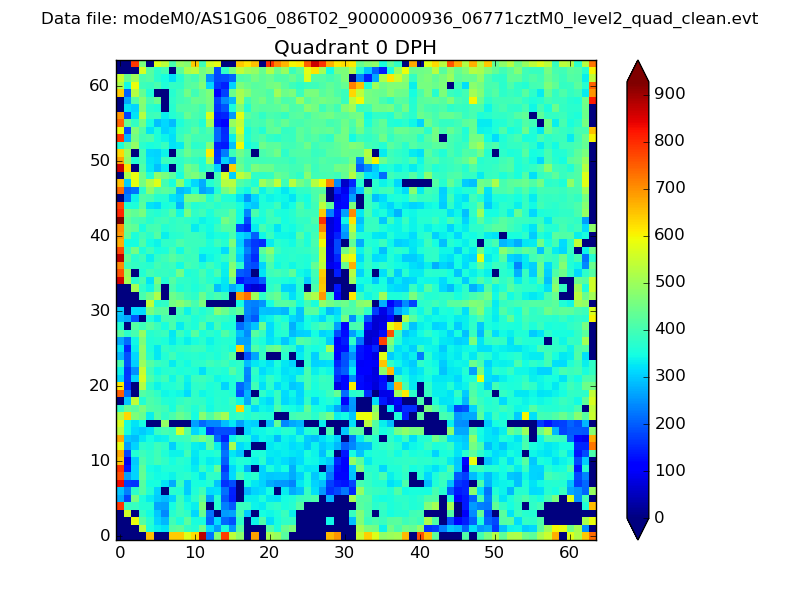 |
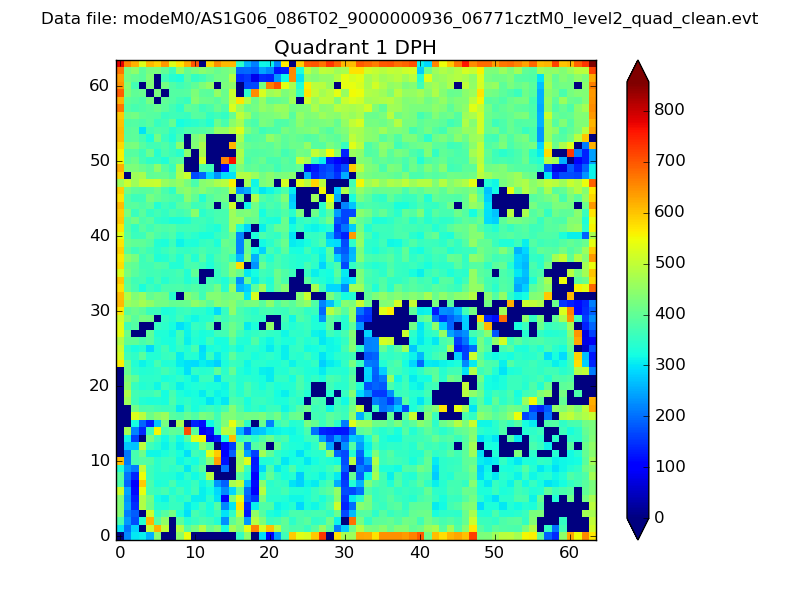 |
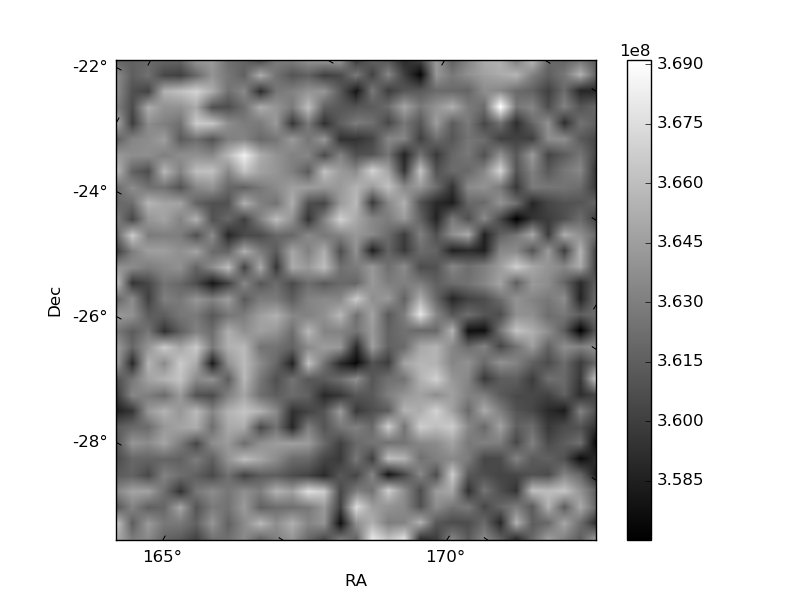
Quadrant B |
|---|---|---|---|
| Quadrant D | 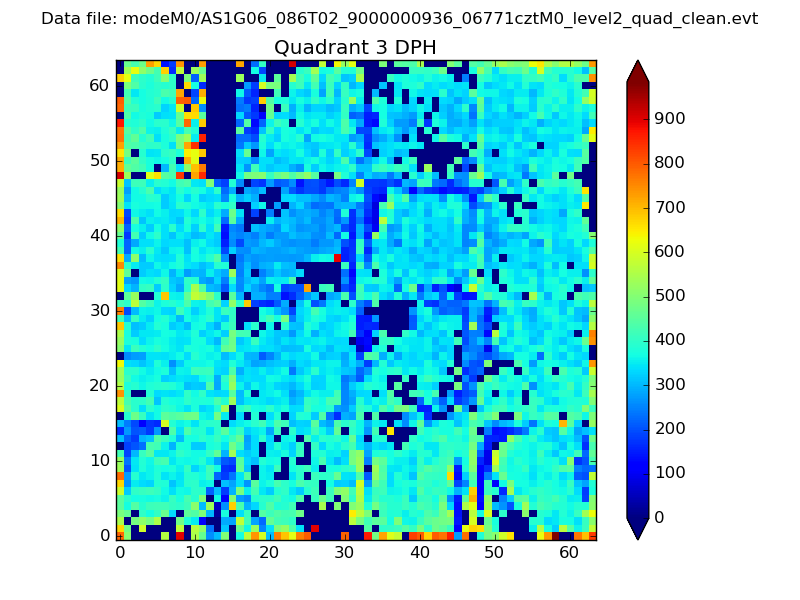 |
 |
Quadrant C |
| Plot type | Count rate plots | Images |
|---|---|---|
| Comparison with Poisson distribution Blue bars denote a histogram of data divided into 1 sec bins. Red curve is a Poisson curve with rate = median count rate of data. |
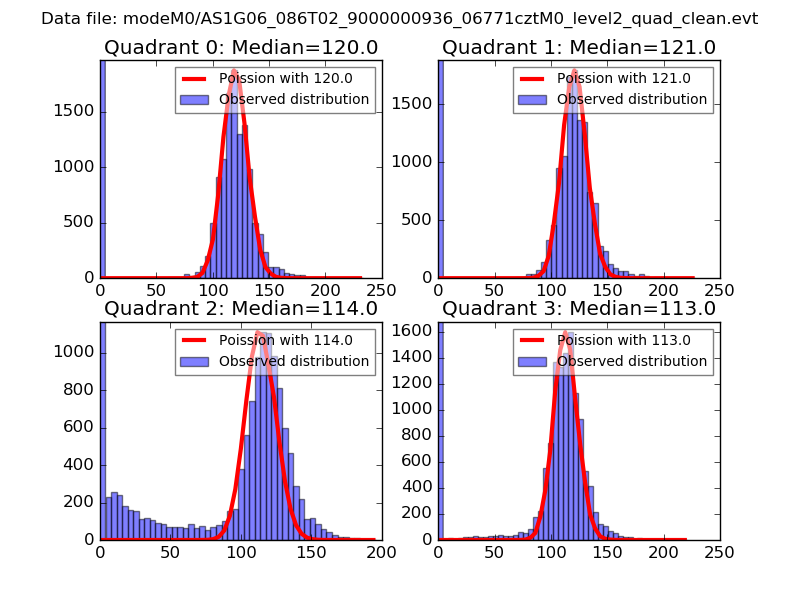 |
 |
| Quadrant-wise count rates Data is divided into 100 sec bins |
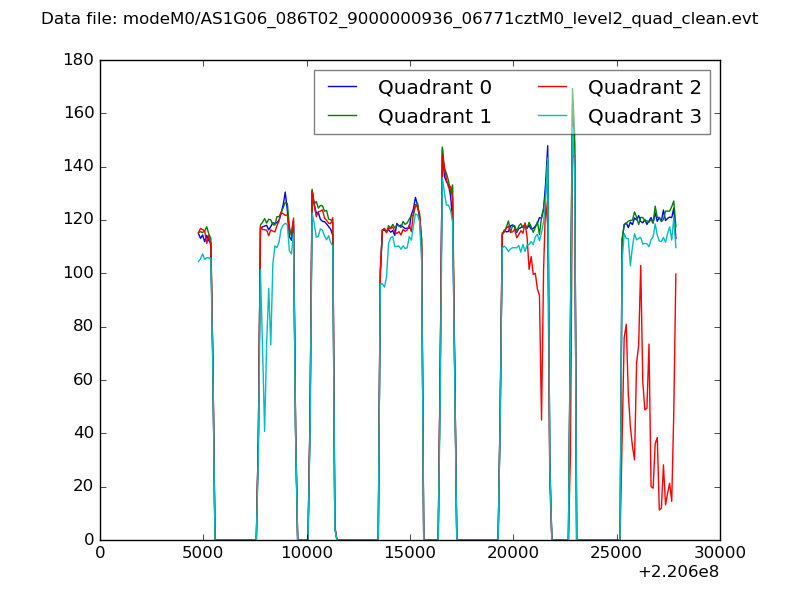 |
|
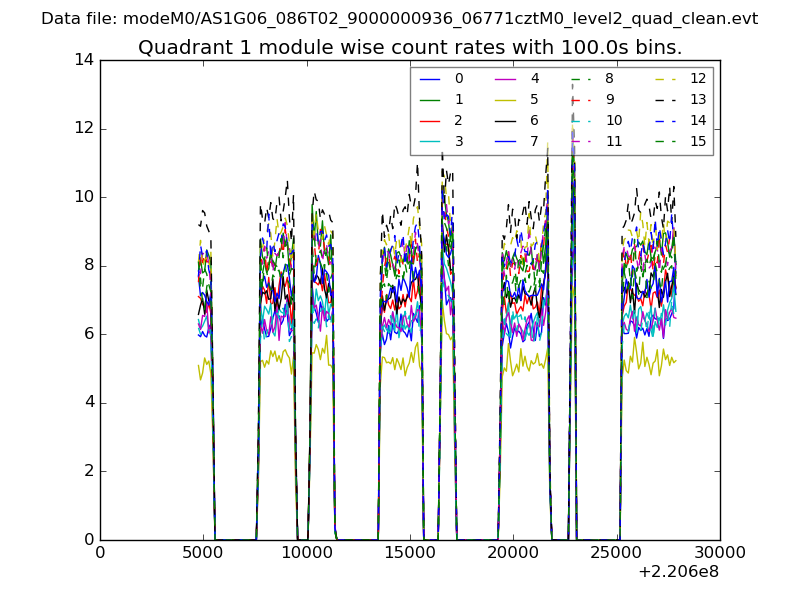
| Module-wise count rates for Quadrant A Data is divided into 100 sec bins |
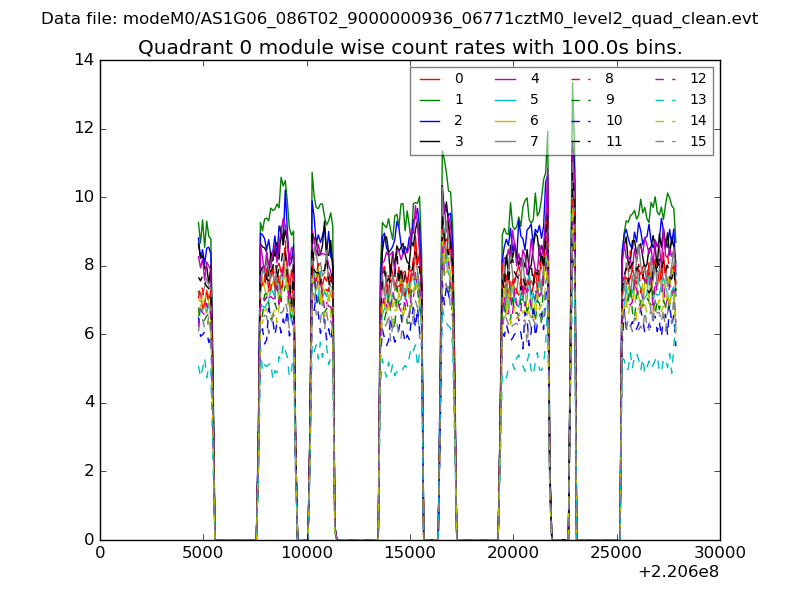 |
 |
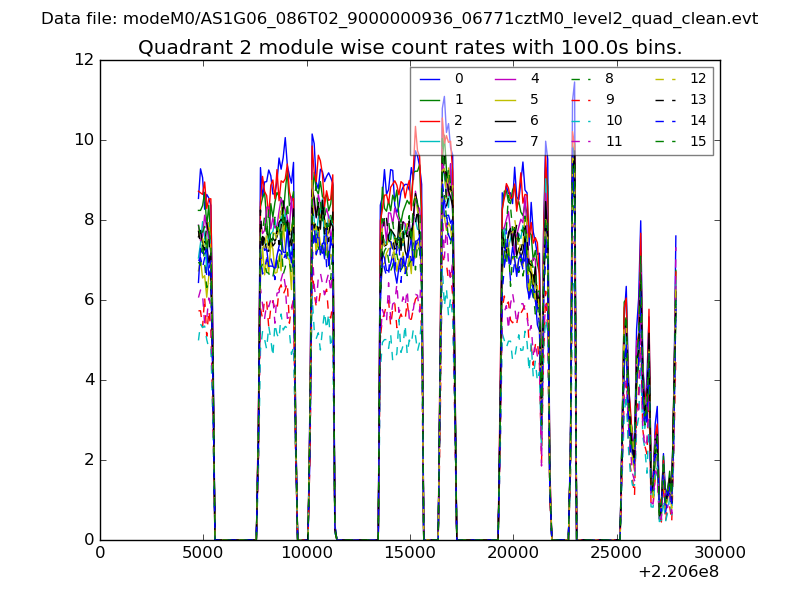
| Module-wise count rates for Quadrant B Data is divided into 100 sec bins |
 |
 |
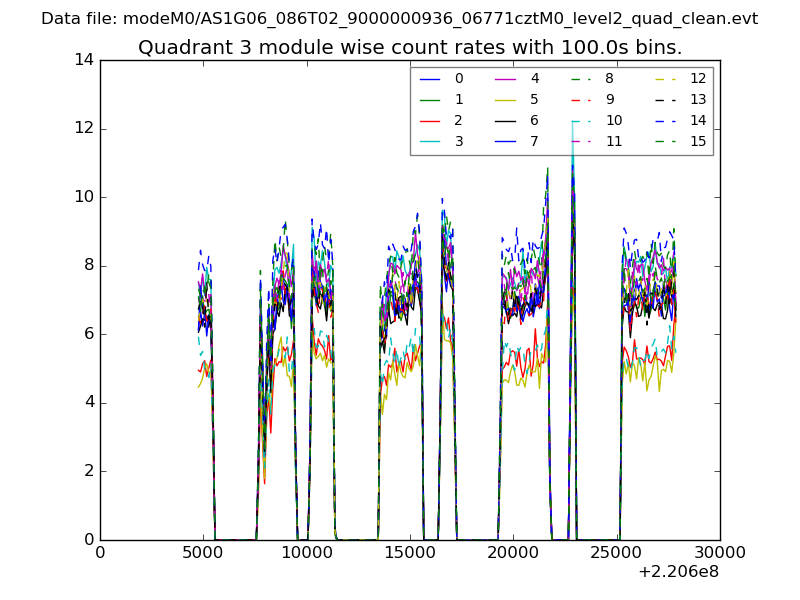
| Module-wise count rates for Quadrant C Data is divided into 100 sec bins |
 |
 |
| Module-wise count rates for Quadrant D Data is divided into 100 sec bins |
 |
 |
| Parameter | Plot |
|---|---|
| CZT HV Monitor | 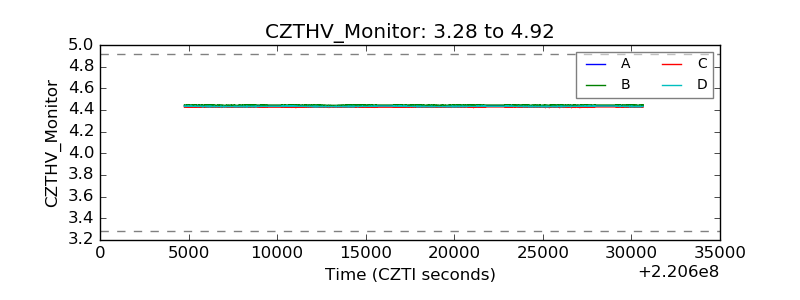 |
| D_VDD | 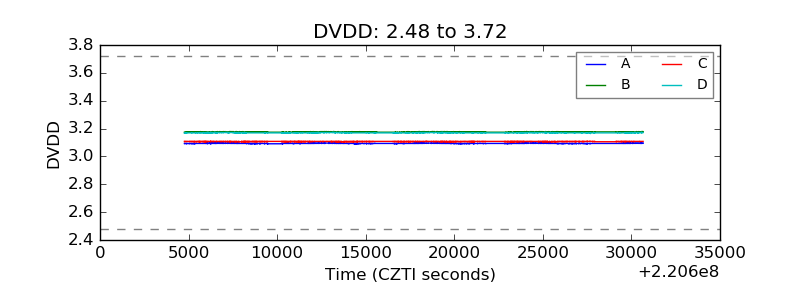 |
| Temperature 1 |  |
| Veto HV Monitor |  |
| Veto LLD | 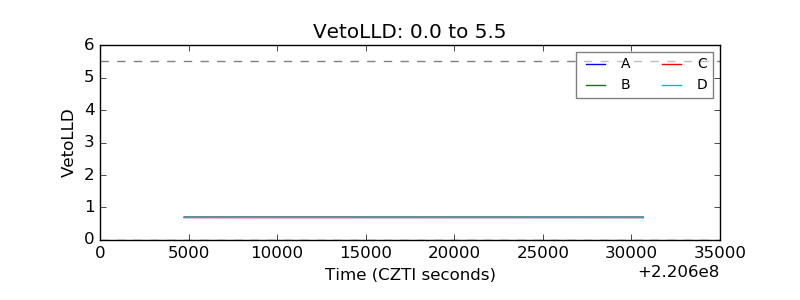 |
| Alpha Counter | 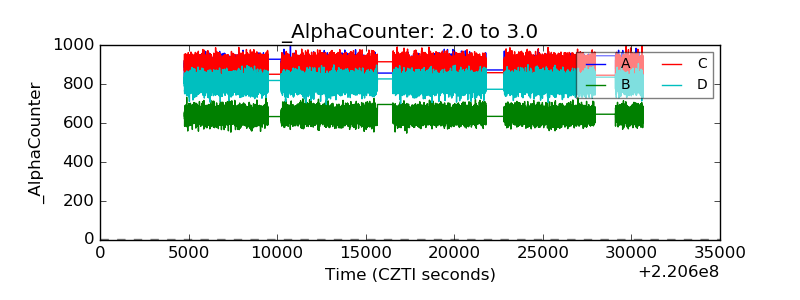 |
| _CPM_Rate | 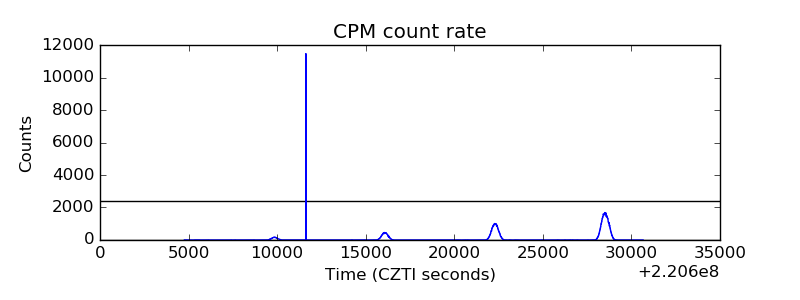 |
| CZT Counter | 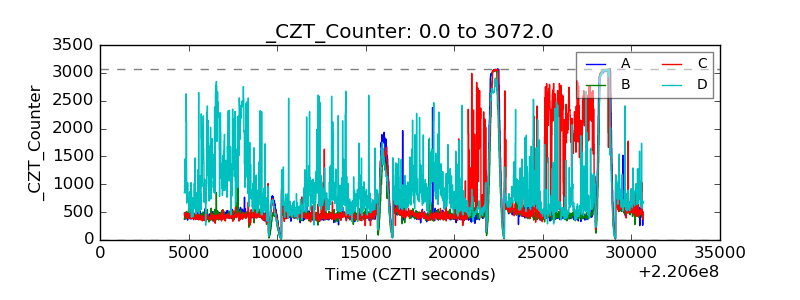 |
| +2.5 Volts monitor |  |
| +5 Volts monitor |  |
| _ROLL_ROT | 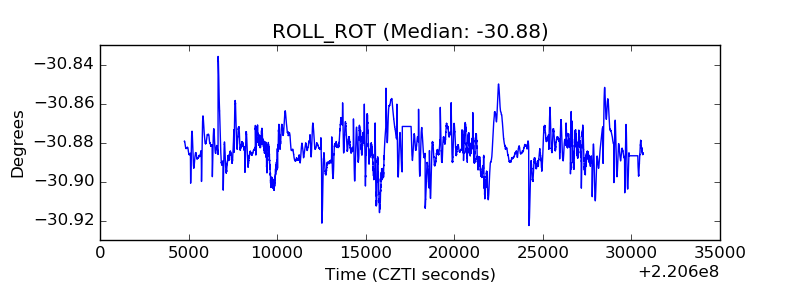 |
| _Roll_DEC | 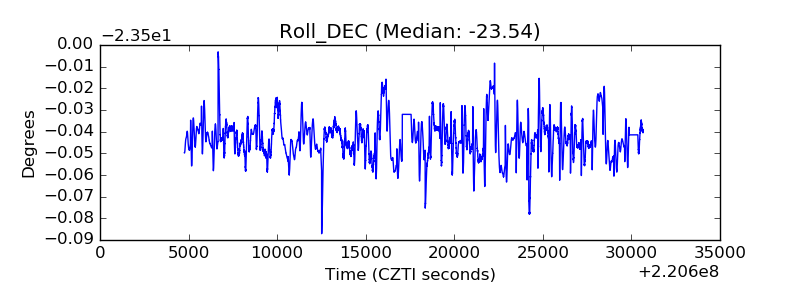 |
| _Roll_RA | 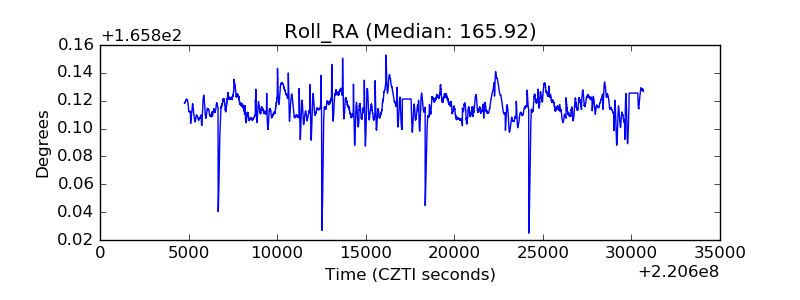 |
| Veto Counter | 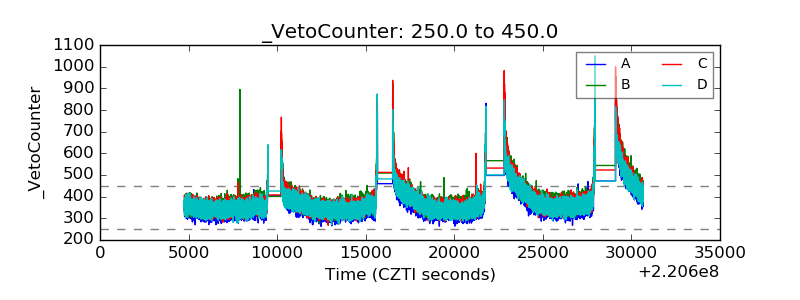 |