| Param | Original file | Final file |
|---|---|---|
| Filename | modeM0/AS1G06_086T02_9000000936_06772cztM0_level2.evt | modeM0/AS1G06_086T02_9000000936_06772cztM0_level2_quad_clean.evt |
| Size (bytes) | 477,072,000 | 62,965,440 |
| Size | 455.0 MB | 60.0 MB |
| Events in quadrant A | 3,069,110 | 373,042 |
| Events in quadrant B | 3,120,309 | 379,550 |
| Events in quadrant C | 3,531,476 | 368,213 |
| Events in quadrant D | 4,308,414 | 354,550 |
| Mode M9 | |||
|---|---|---|---|
| Quadrant | BADHDUFLAG | Total packets | Discarded packets |
| A | 0 | 12 | 0 |
| B | 0 | 12 | 0 |
| C | 0 | 12 | 0 |
| D | 0 | 12 | 0 |
| Mode M0 | |||
|---|---|---|---|
| Quadrant | BADHDUFLAG | Total packets | Discarded packets |
| A | 0 | 13083 | 2 |
| B | 0 | 13204 | 1 |
| C | 0 | 14485 | 1 |
| D | 0 | 17124 | 1 |
| Mode SS | |||
|---|---|---|---|
| Quadrant | BADHDUFLAG | Total packets | Discarded packets |
| A | 0 | 126 | 0 |
| B | 0 | 126 | 0 |
| C | 0 | 126 | 0 |
| D | 0 | 126 | 0 |
| Quadrant | Total seconds | Saturated seconds | Saturation percentage |
|---|---|---|---|
| A | 6171 | 76 | 1.231567% |
| B | 6171 | 72 | 1.166748% |
| C | 6171 | 133 | 2.155242% |
| D | 6171 | 159 | 2.576568% |
Noise dominated data is calculated using 1-second bins in cleaned event files. If a bin has >2000 counts, and if more than 50% of those come from <1% of pixels, then it is considered to be noise-dominated and hence unusable.
| Quadrant | # 1 sec bins | Bins with >0 counts | Bins with >2000 counts | High rate bins dominated by noise | Noise dominated (total time) | Noise dominated (detector-on time) | Marked lightcurve |
|---|---|---|---|---|---|---|---|
| A | 7426 | 6172 | 1 | 1 | 0.01% | 0.02% | 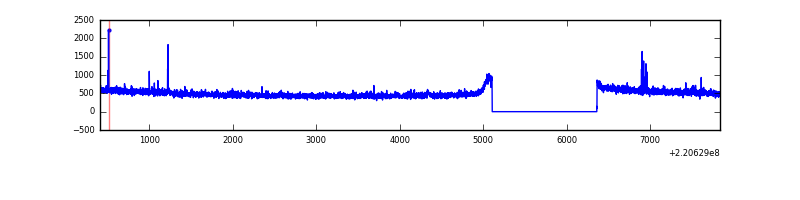 |
| B | 7426 | 6172 | 1 | 1 | 0.01% | 0.02% | 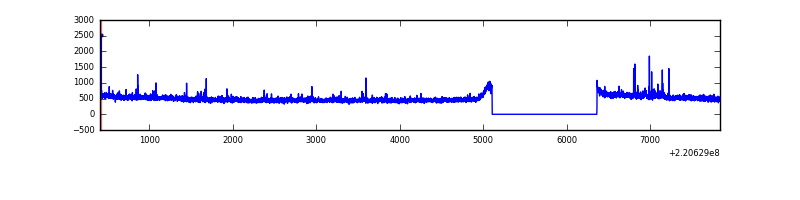 |
| C | 7426 | 6172 | 70 | 70 | 0.94% | 1.13% | 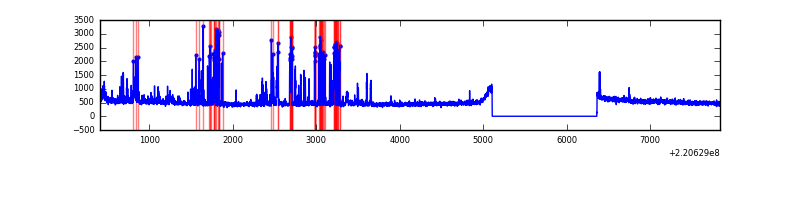 |
| D | 7426 | 6172 | 61 | 61 | 0.82% | 0.99% | 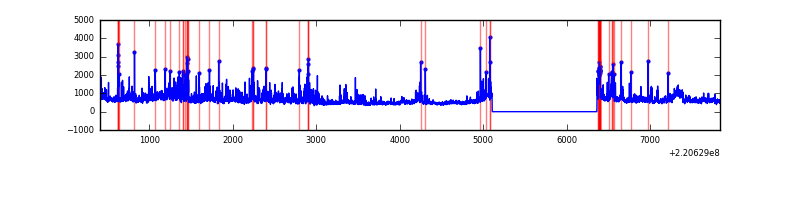 |
Top three noisy pixels from each quadrant. If the there are fewer than three noisy pixels in the level2.evt file, extra rows are filled as -1
| Pixel properties | Quadrant properties | ||||||
|---|---|---|---|---|---|---|---|
| Quadrant | DetID | PixID | Counts | Sigma | Mean | Median | Sigma |
| A | 8 | 15 | 28073 | 174.18 | 778 | 762 | 156.8 |
| A | 13 | 251 | 15766 | 95.69 | 778 | 762 | 156.8 |
| A | 4 | 2 | 11750 | 70.08 | 778 | 762 | 156.8 |
| B | 0 | 214 | 33779 | 223.5 | 781 | 765 | 147.7 |
| B | 4 | 48 | 28351 | 186.75 | 781 | 765 | 147.7 |
| B | 4 | 81 | 24937 | 163.64 | 781 | 765 | 147.7 |
| C | 9 | 247 | 609181 | 3507.23 | 747 | 750 | 173.5 |
| C | 13 | 61 | 6085 | 30.75 | 747 | 750 | 173.5 |
| C | 9 | 16 | 4861 | 23.7 | 747 | 750 | 173.5 |
| D | 8 | 195 | 452850 | 2488.07 | 743 | 721 | 181.7 |
| D | 12 | 220 | 409131 | 2247.48 | 743 | 721 | 181.7 |
| D | 2 | 216 | 282983 | 1553.29 | 743 | 721 | 181.7 |
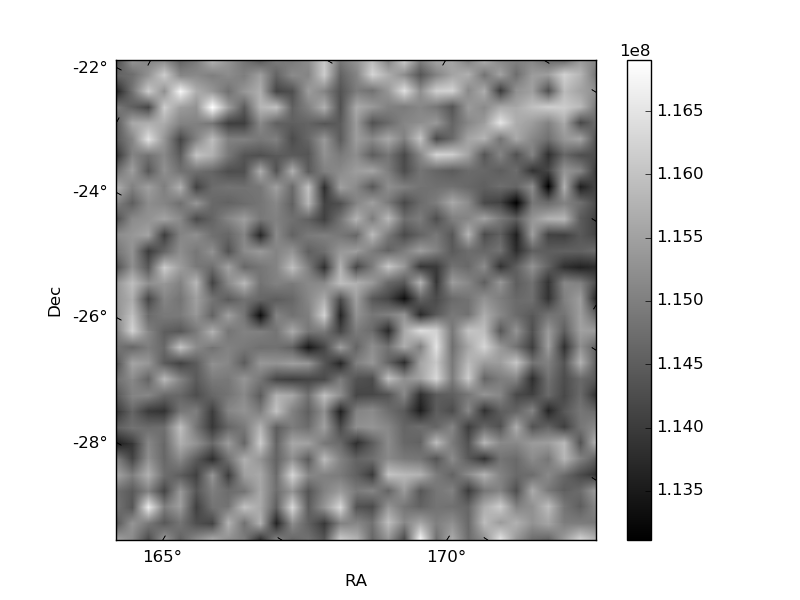
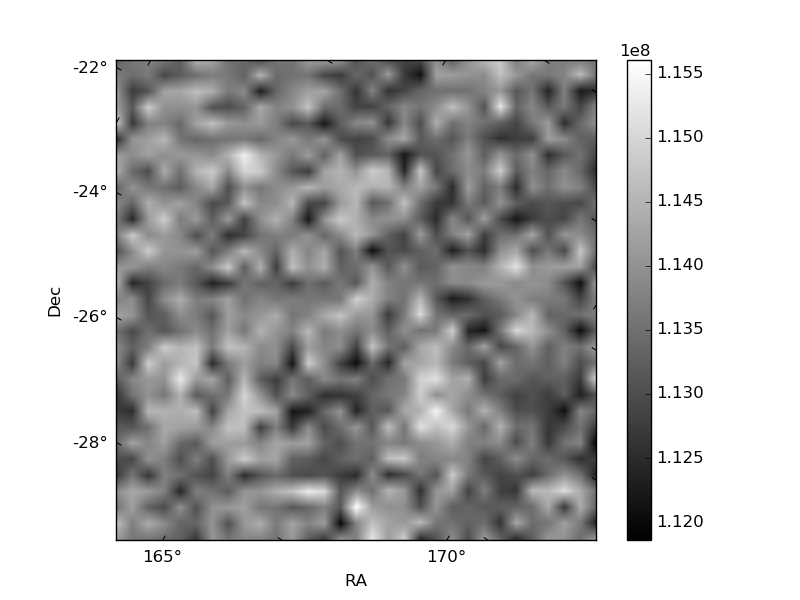
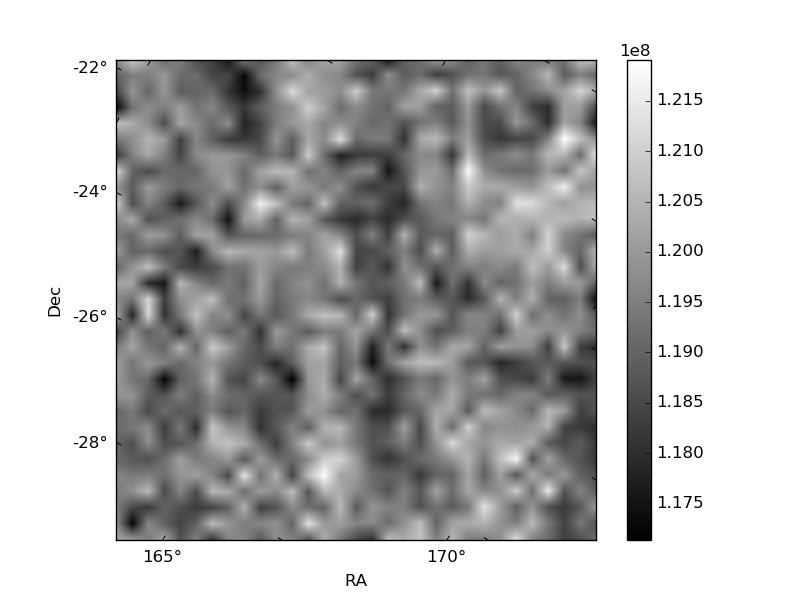
Histogram calculated using DETX and DETY for each event in the final _common_clean file
| Quadrant A | 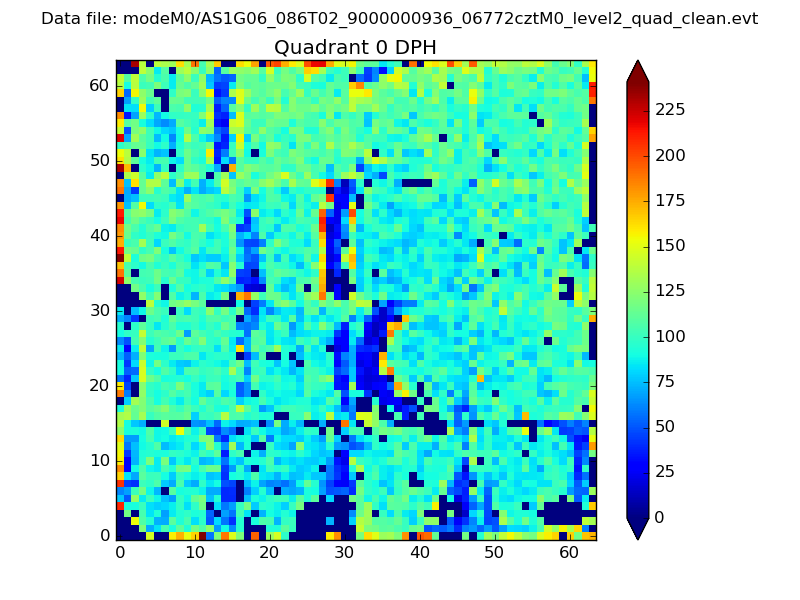 |
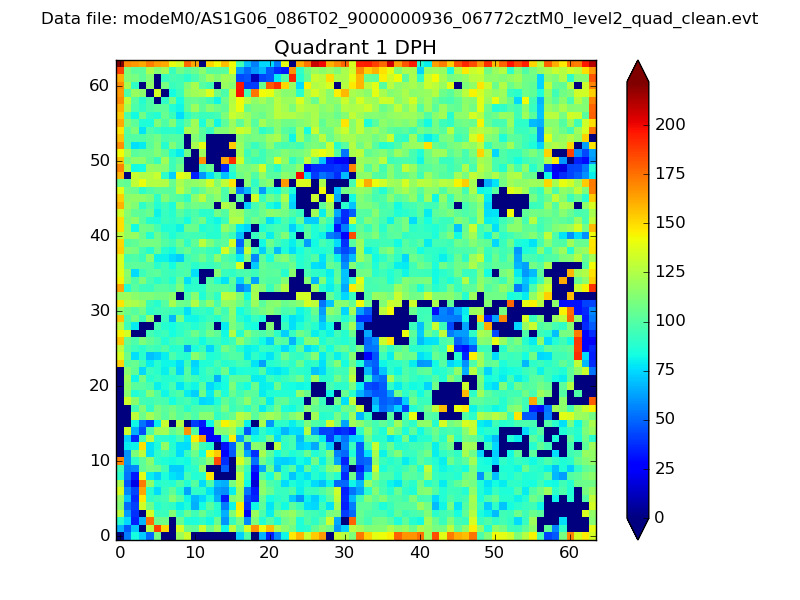 |
Quadrant B |
|---|---|---|---|
| Quadrant D | 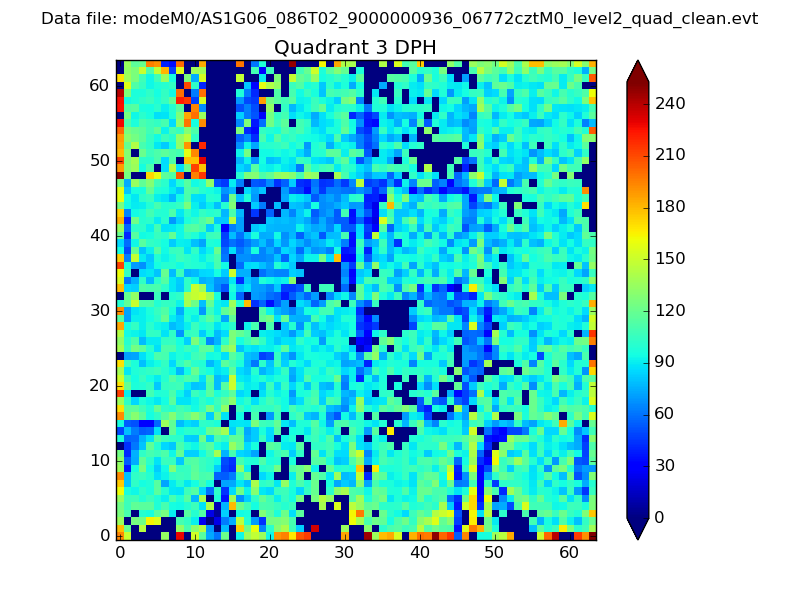 |
 |
Quadrant C |
| Plot type | Count rate plots | Images |
|---|---|---|
| Comparison with Poisson distribution Blue bars denote a histogram of data divided into 1 sec bins. Red curve is a Poisson curve with rate = median count rate of data. |
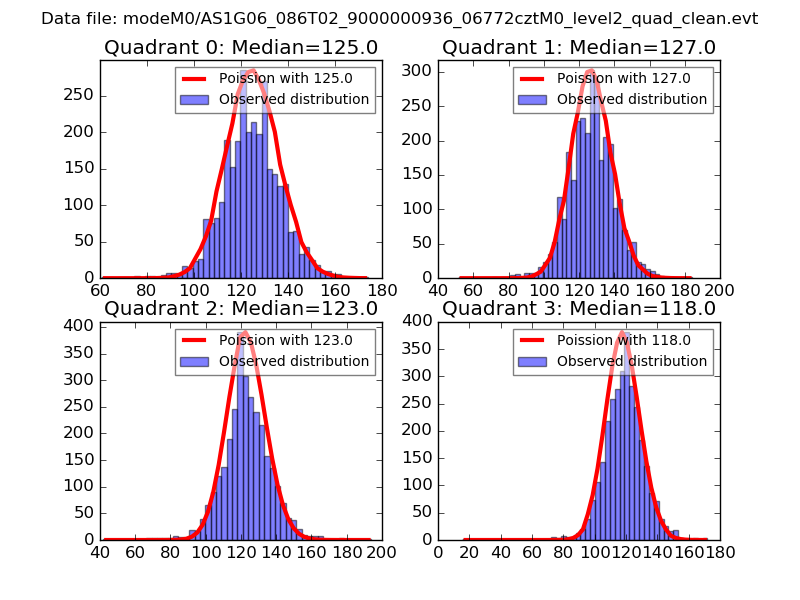 |
 |
| Quadrant-wise count rates Data is divided into 100 sec bins |
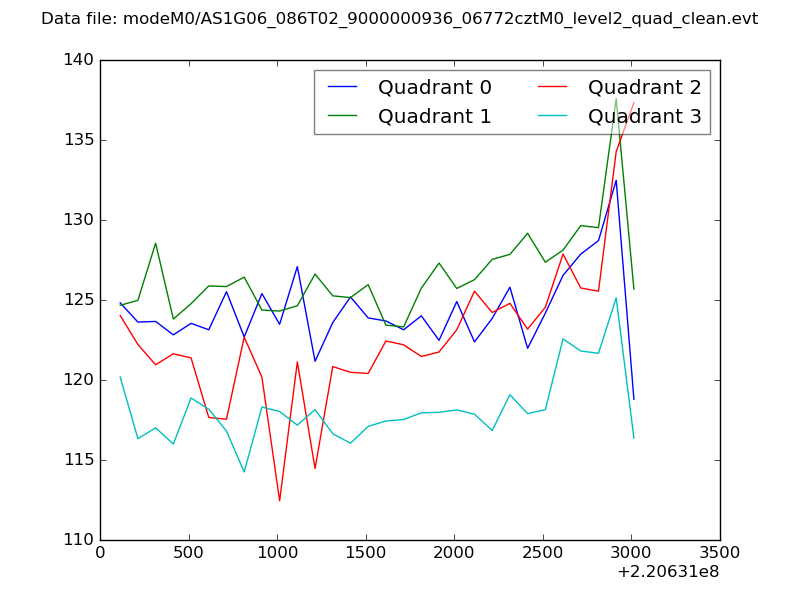 |
|
| Module-wise count rates for Quadrant A Data is divided into 100 sec bins |
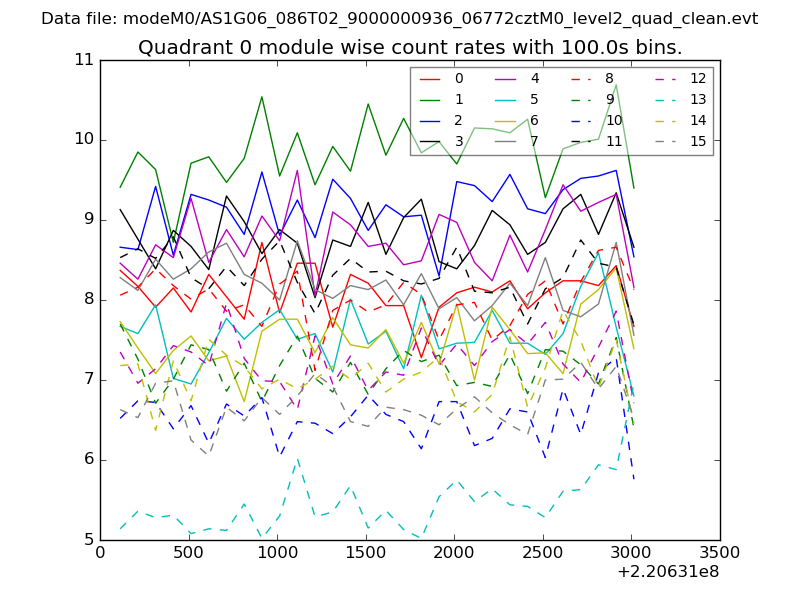 |
 |
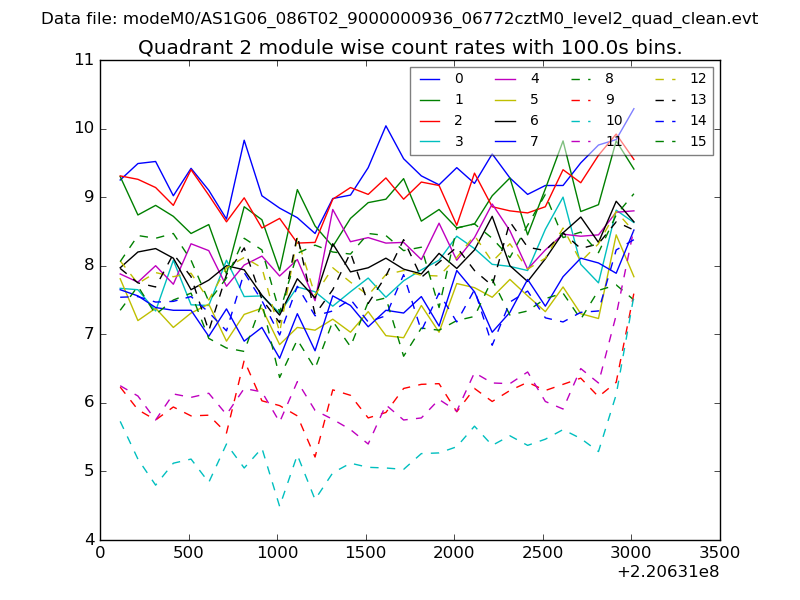
| Module-wise count rates for Quadrant B Data is divided into 100 sec bins |
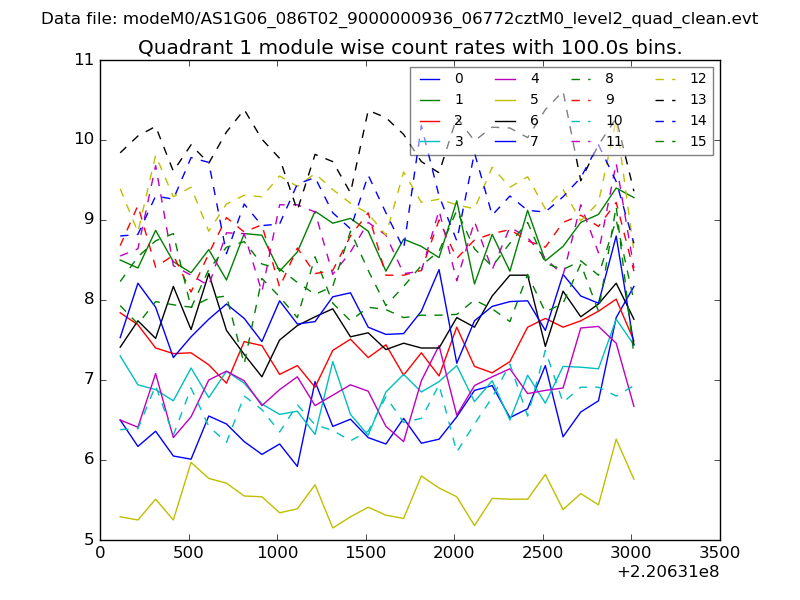 |
 |
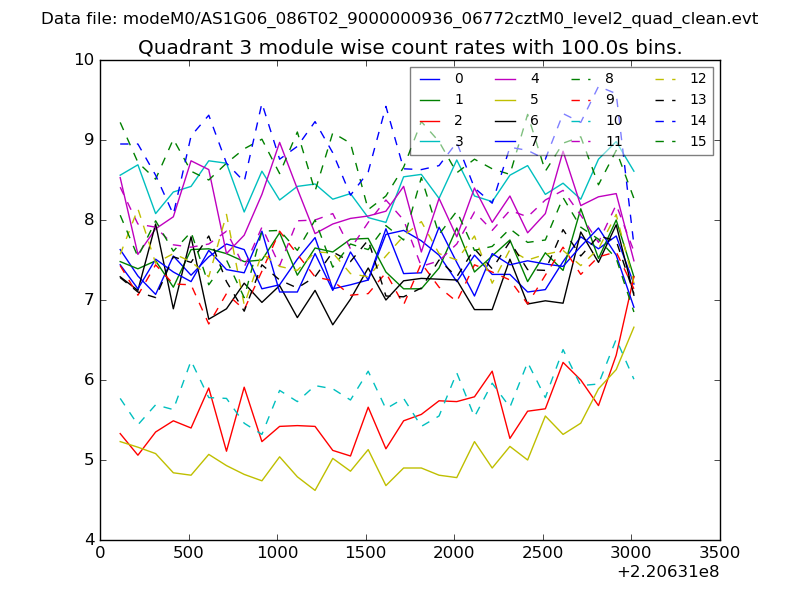
| Module-wise count rates for Quadrant C Data is divided into 100 sec bins |
 |
 |
| Module-wise count rates for Quadrant D Data is divided into 100 sec bins |
 |
 |
| Parameter | Plot |
|---|---|
| CZT HV Monitor | 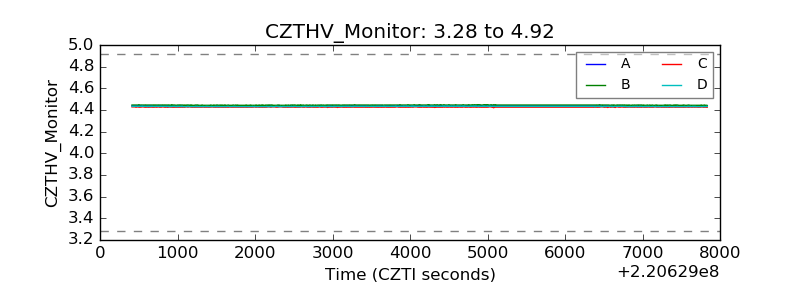 |
| D_VDD | 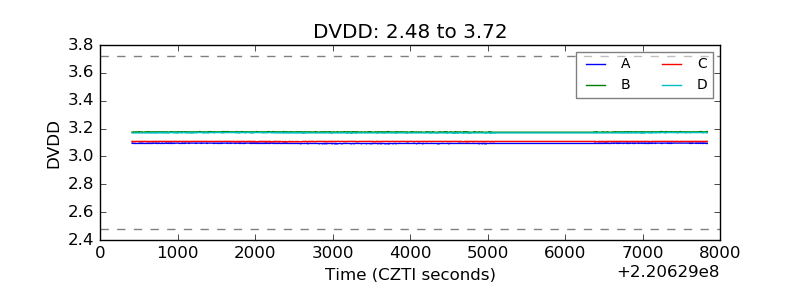 |
| Temperature 1 | 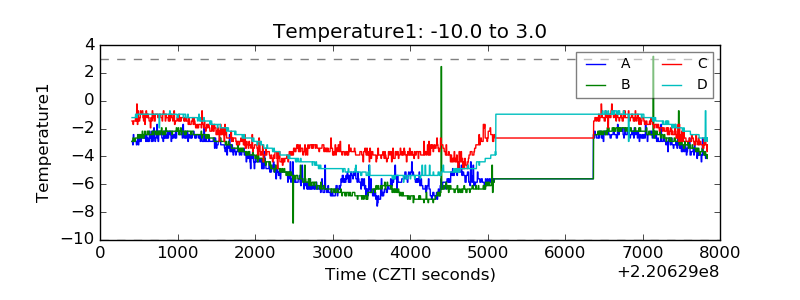 |
| Veto HV Monitor |  |
| Veto LLD | 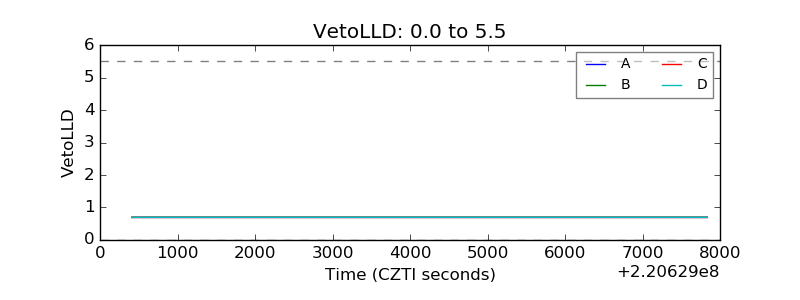 |
| Alpha Counter | 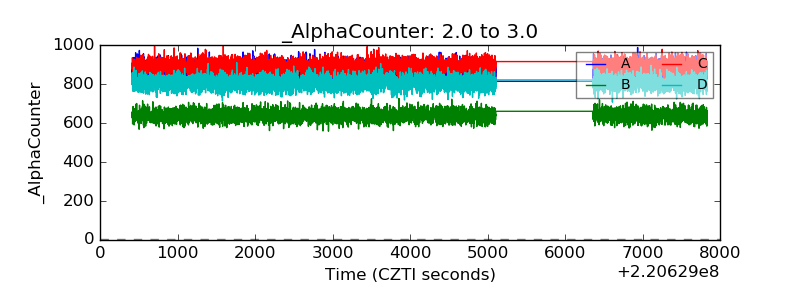 |
| _CPM_Rate | 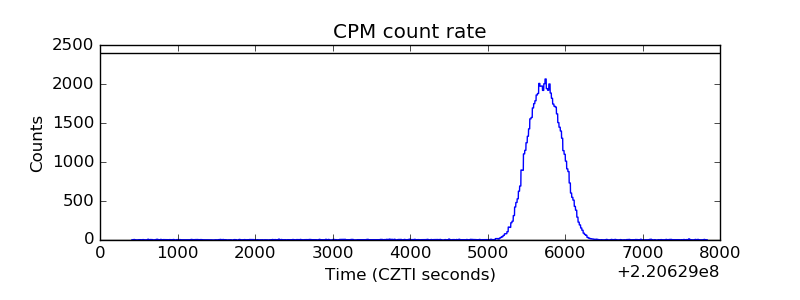 |
| CZT Counter |  |
| +2.5 Volts monitor |  |
| +5 Volts monitor |  |
| _ROLL_ROT | 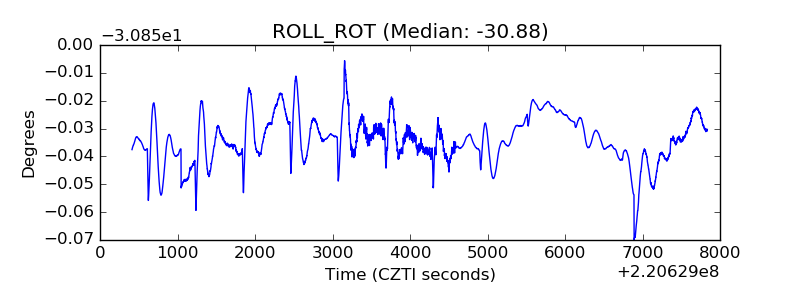 |
| _Roll_DEC | 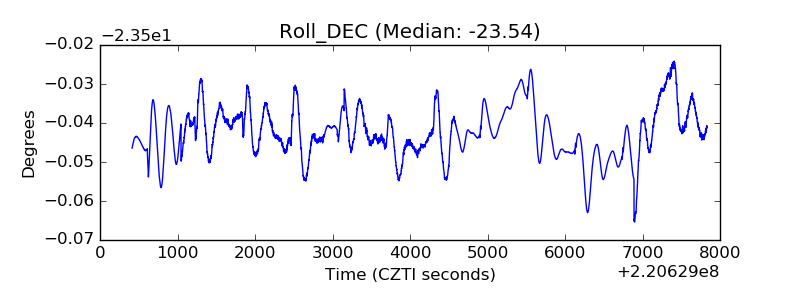 |
| _Roll_RA |  |
| Veto Counter | 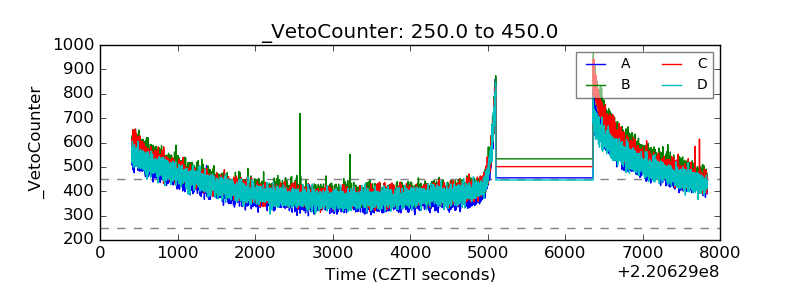 |