| Param | Original file | Final file |
|---|---|---|
| Filename | modeM0/AS1G06_086T02_9000000936_06773cztM0_level2.evt | modeM0/AS1G06_086T02_9000000936_06773cztM0_level2_quad_clean.evt |
| Size (bytes) | 475,715,520 | 74,136,960 |
| Size | 453.7 MB | 70.7 MB |
| Events in quadrant A | 3,239,626 | 456,026 |
| Events in quadrant B | 3,340,488 | 464,808 |
| Events in quadrant C | 3,152,917 | 450,906 |
| Events in quadrant D | 4,242,012 | 429,158 |
| Mode M9 | |||
|---|---|---|---|
| Quadrant | BADHDUFLAG | Total packets | Discarded packets |
| A | 0 | 19 | 0 |
| B | 0 | 19 | 0 |
| C | 0 | 19 | 0 |
| D | 0 | 20 | 0 |
| Mode M0 | |||
|---|---|---|---|
| Quadrant | BADHDUFLAG | Total packets | Discarded packets |
| A | 0 | 13716 | 3 |
| B | 0 | 14085 | 2 |
| C | 0 | 13487 | 2 |
| D | 0 | 17004 | 2 |
| Mode SS | |||
|---|---|---|---|
| Quadrant | BADHDUFLAG | Total packets | Discarded packets |
| A | 0 | 130 | 0 |
| B | 0 | 130 | 0 |
| C | 0 | 130 | 0 |
| D | 0 | 130 | 0 |
| Quadrant | Total seconds | Saturated seconds | Saturation percentage |
|---|---|---|---|
| A | 6360 | 113 | 1.776730% |
| B | 6360 | 124 | 1.949686% |
| C | 6360 | 74 | 1.163522% |
| D | 6360 | 151 | 2.374214% |
Noise dominated data is calculated using 1-second bins in cleaned event files. If a bin has >2000 counts, and if more than 50% of those come from <1% of pixels, then it is considered to be noise-dominated and hence unusable.
| Quadrant | # 1 sec bins | Bins with >0 counts | Bins with >2000 counts | High rate bins dominated by noise | Noise dominated (total time) | Noise dominated (detector-on time) | Marked lightcurve |
|---|---|---|---|---|---|---|---|
| A | 7620 | 6361 | 0 | 0 | 0.00% | 0.00% | 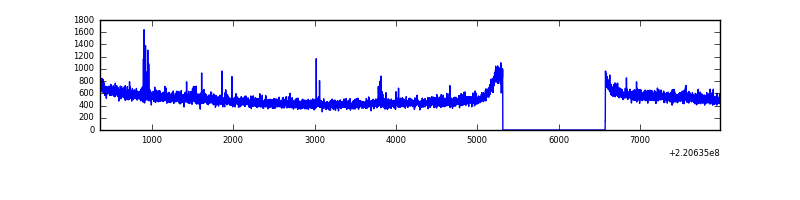 |
| B | 7620 | 6361 | 2 | 2 | 0.03% | 0.03% | 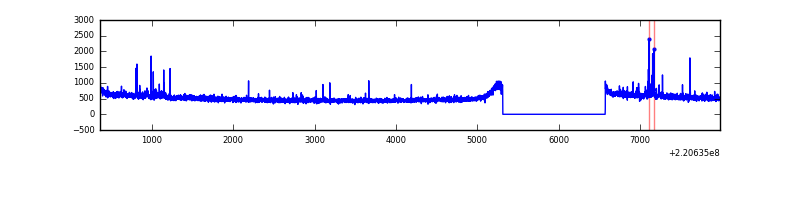 |
| C | 7620 | 6361 | 0 | 0 | 0.00% | 0.00% | 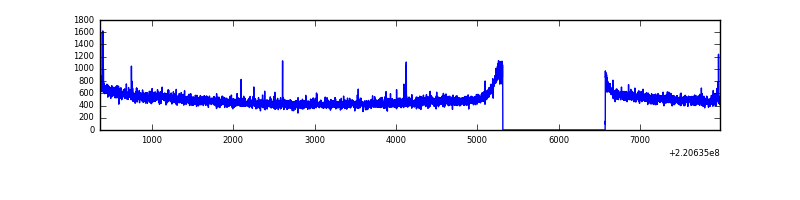 |
| D | 7620 | 6361 | 47 | 47 | 0.62% | 0.74% | 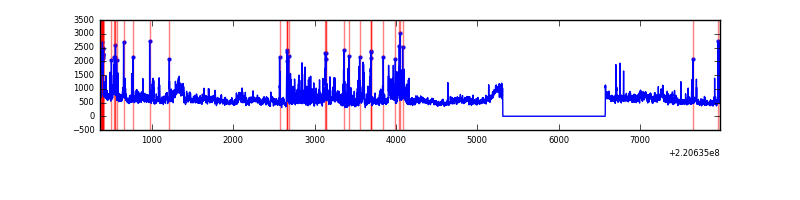 |
Top three noisy pixels from each quadrant. If the there are fewer than three noisy pixels in the level2.evt file, extra rows are filled as -1
| Pixel properties | Quadrant properties | ||||||
|---|---|---|---|---|---|---|---|
| Quadrant | DetID | PixID | Counts | Sigma | Mean | Median | Sigma |
| A | 8 | 15 | 35737 | 210.57 | 826 | 808 | 165.9 |
| A | 4 | 2 | 11909 | 66.92 | 826 | 808 | 165.9 |
| A | 0 | 226 | 7830 | 42.33 | 826 | 808 | 165.9 |
| B | 4 | 48 | 55120 | 345.98 | 832 | 815 | 157.0 |
| B | 0 | 214 | 26490 | 163.58 | 832 | 815 | 157.0 |
| B | 4 | 81 | 18558 | 113.04 | 832 | 815 | 157.0 |
| C | 9 | 247 | 38033 | 202.02 | 796 | 802 | 184.3 |
| C | 13 | 61 | 6320 | 29.94 | 796 | 802 | 184.3 |
| C | 5 | 236 | 4469 | 19.9 | 796 | 802 | 184.3 |
| D | 8 | 195 | 651767 | 3422.76 | 788 | 766 | 190.2 |
| D | 2 | 152 | 325125 | 1705.38 | 788 | 766 | 190.2 |
| D | 2 | 216 | 186427 | 976.15 | 788 | 766 | 190.2 |
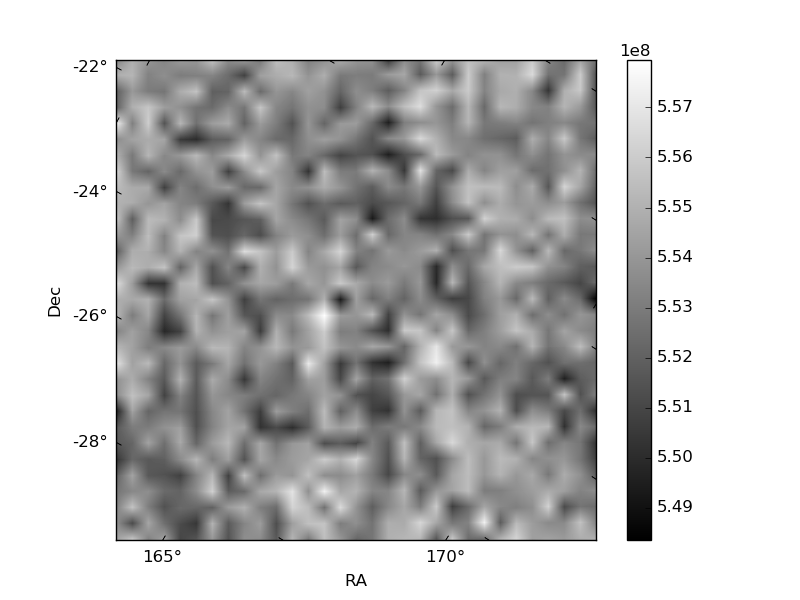
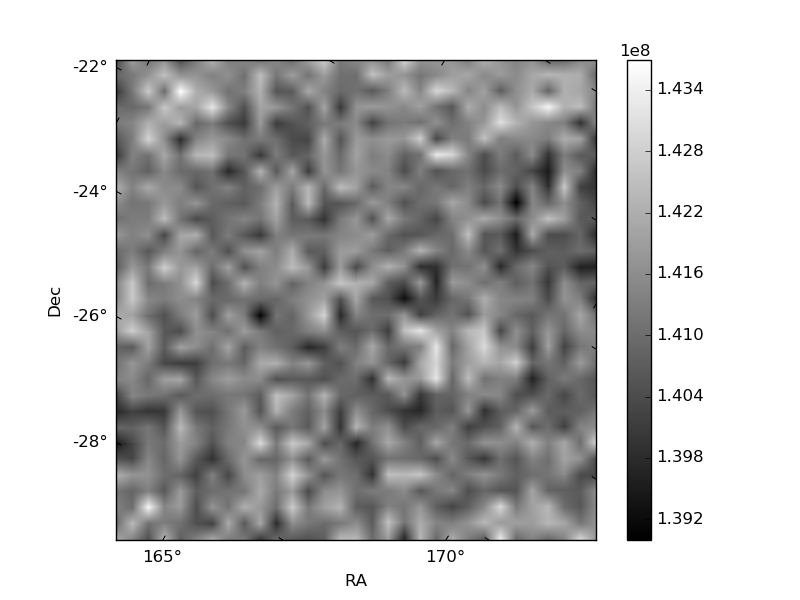
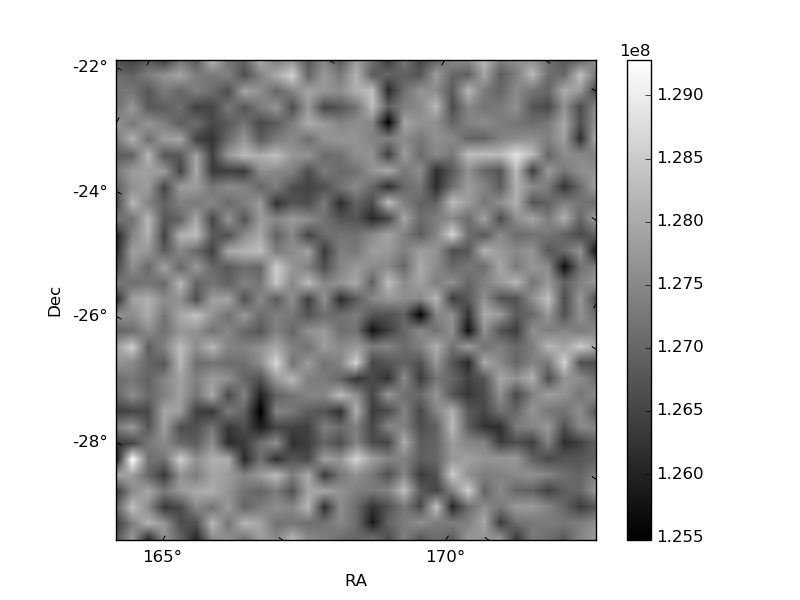
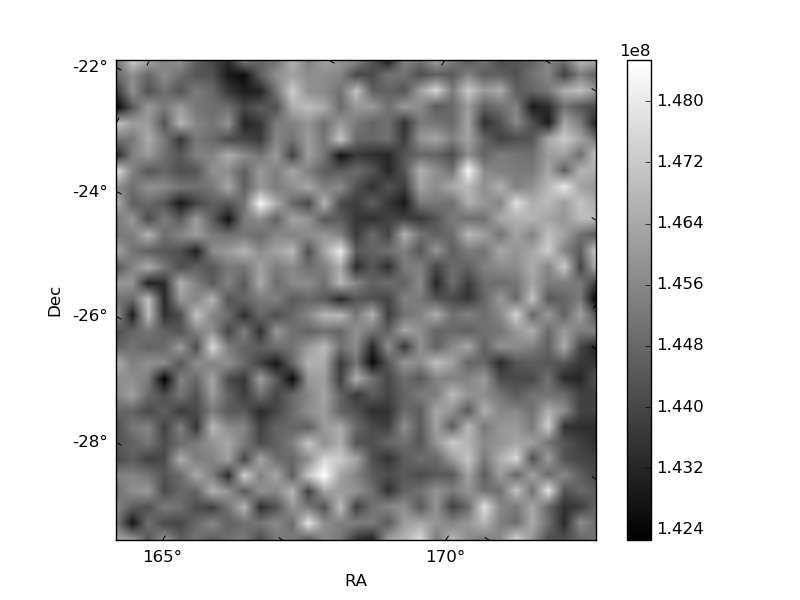
Histogram calculated using DETX and DETY for each event in the final _common_clean file
| Quadrant A | 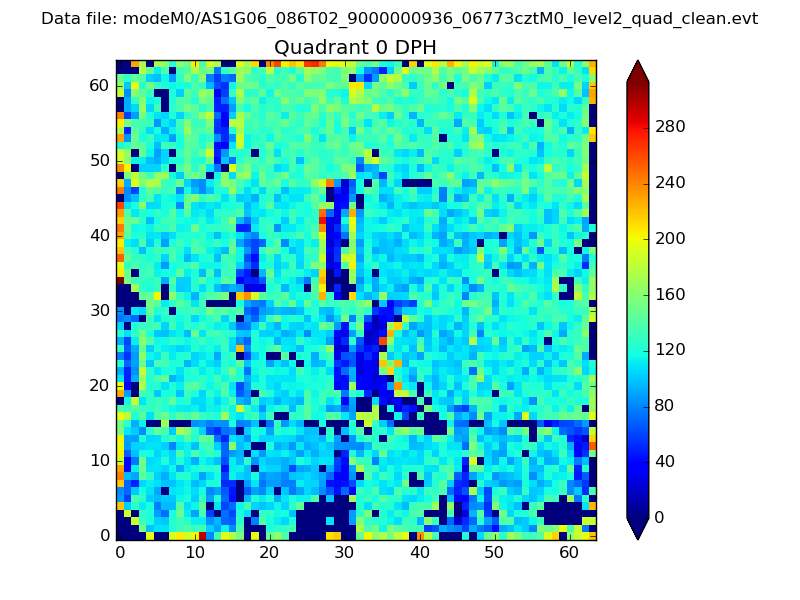 |
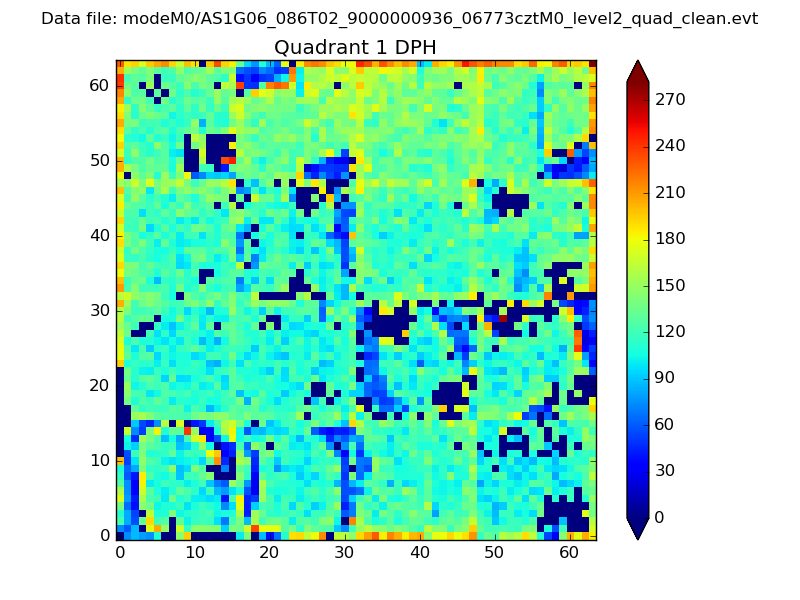 |
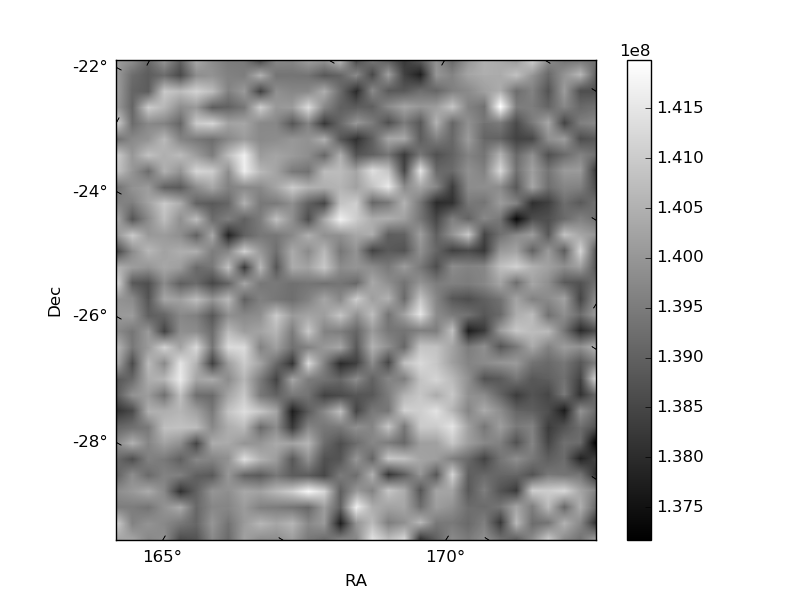
Quadrant B |
|---|---|---|---|
| Quadrant D | 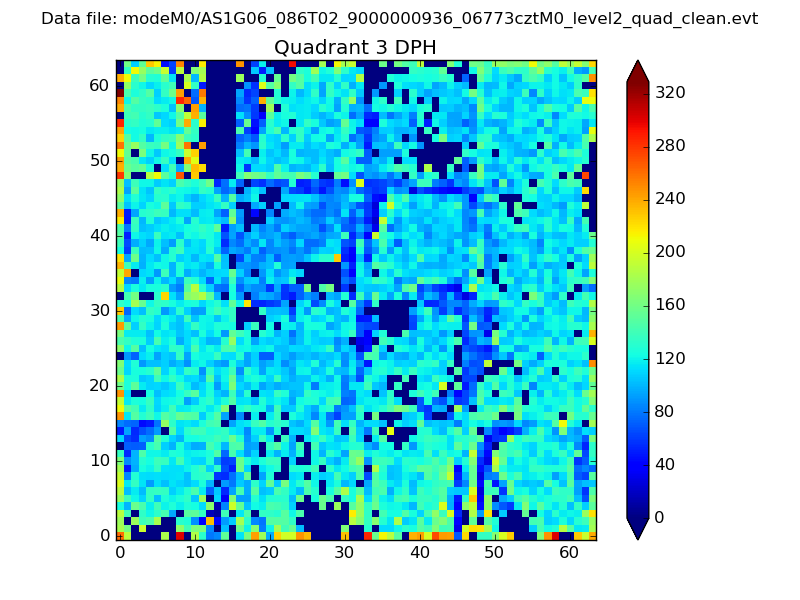 |
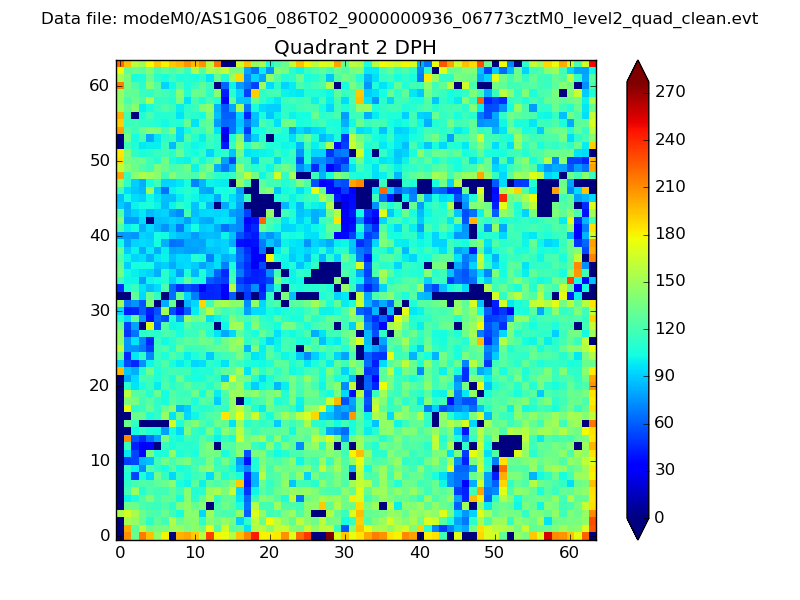 |
Quadrant C |
| Plot type | Count rate plots | Images |
|---|---|---|
| Comparison with Poisson distribution Blue bars denote a histogram of data divided into 1 sec bins. Red curve is a Poisson curve with rate = median count rate of data. |
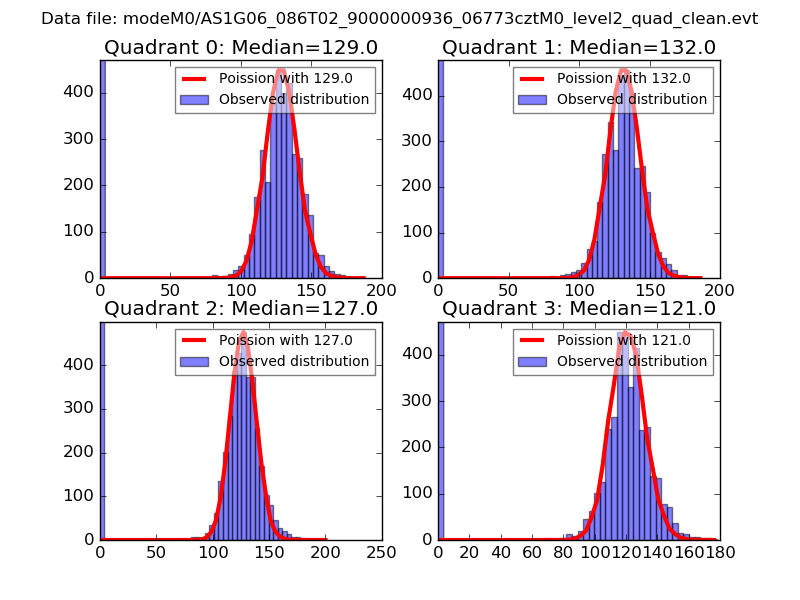 |
 |
| Quadrant-wise count rates Data is divided into 100 sec bins |
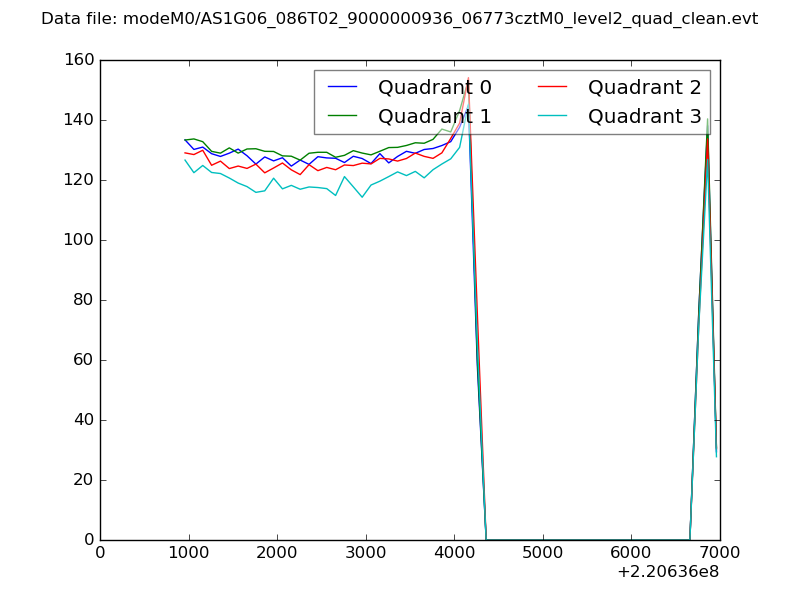 |
|
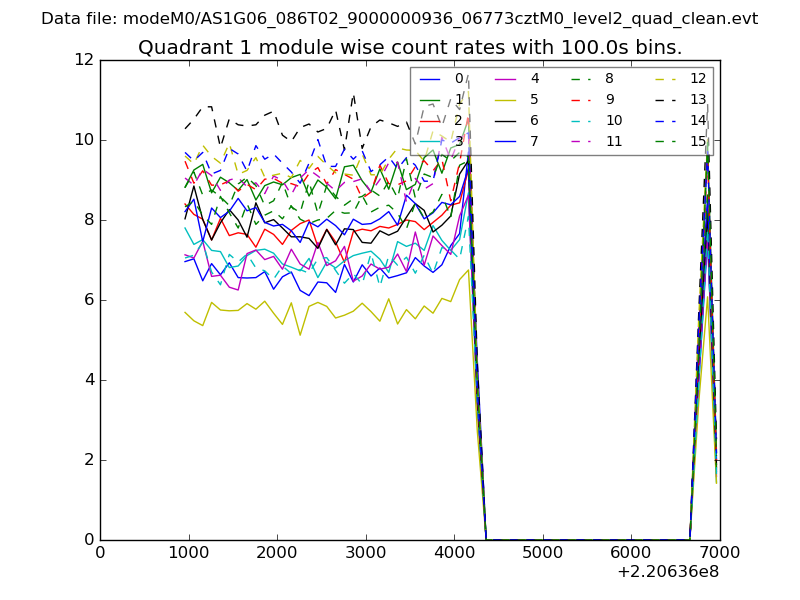
| Module-wise count rates for Quadrant A Data is divided into 100 sec bins |
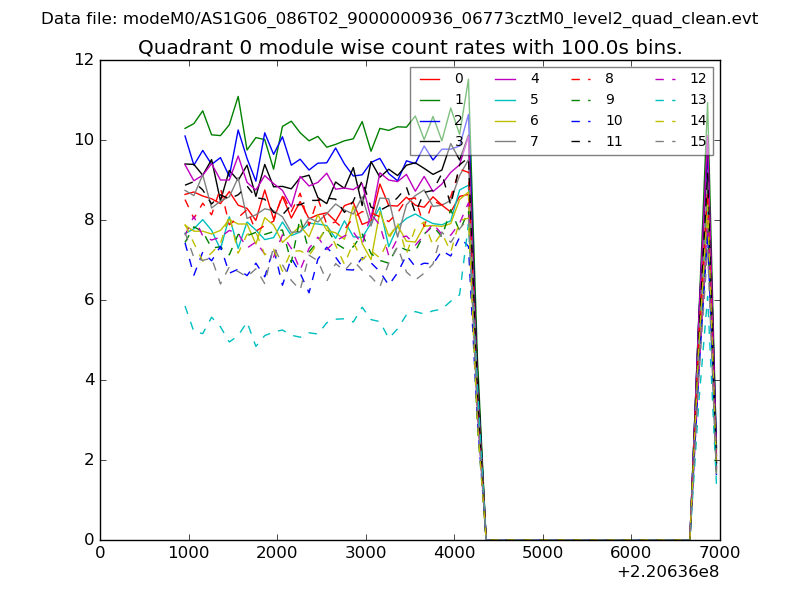 |
 |
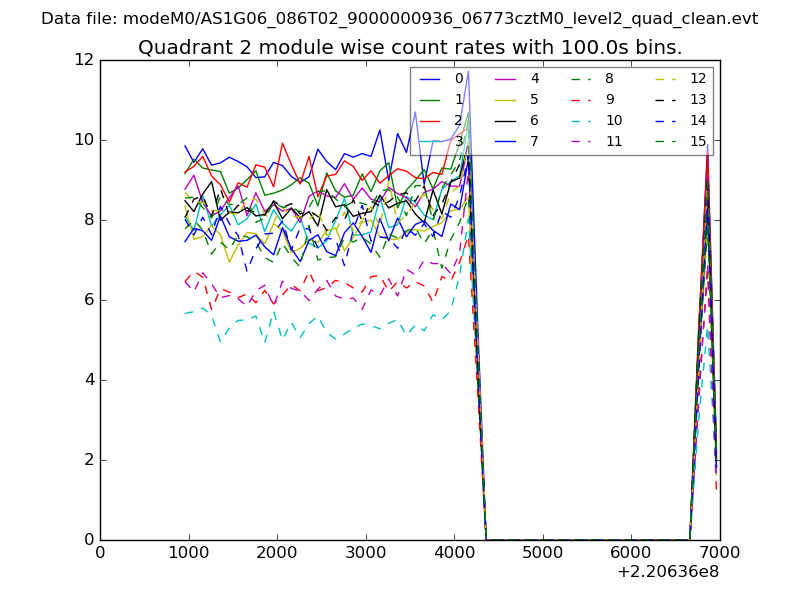
| Module-wise count rates for Quadrant B Data is divided into 100 sec bins |
 |
 |
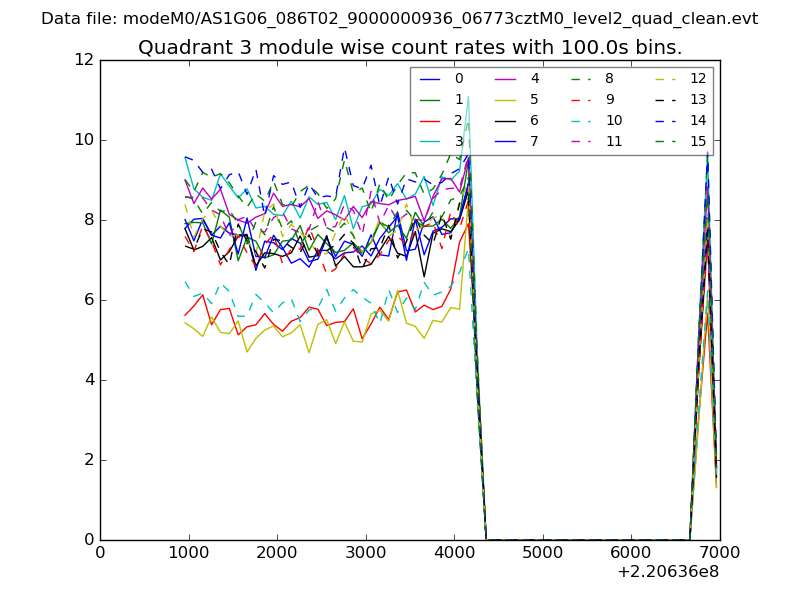
| Module-wise count rates for Quadrant C Data is divided into 100 sec bins |
 |
 |
| Module-wise count rates for Quadrant D Data is divided into 100 sec bins |
 |
 |
| Parameter | Plot |
|---|---|
| CZT HV Monitor | 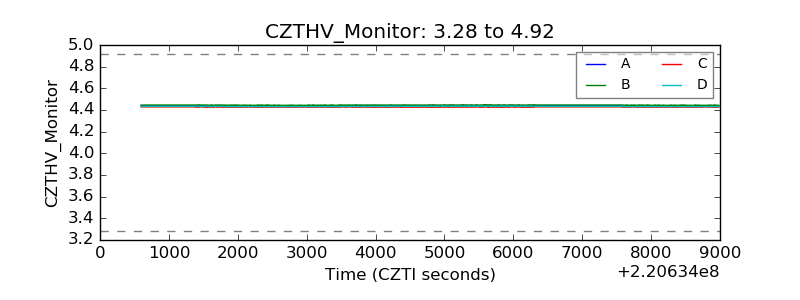 |
| D_VDD |  |
| Temperature 1 | 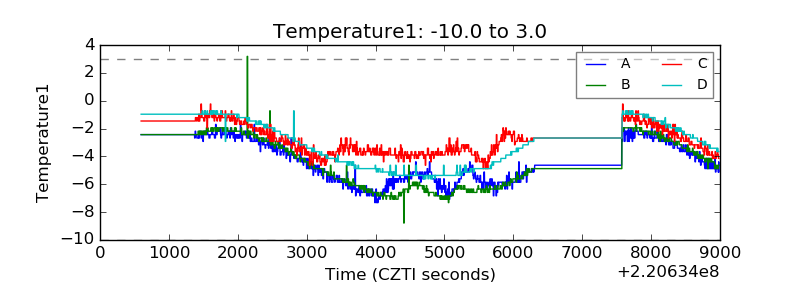 |
| Veto HV Monitor |  |
| Veto LLD | 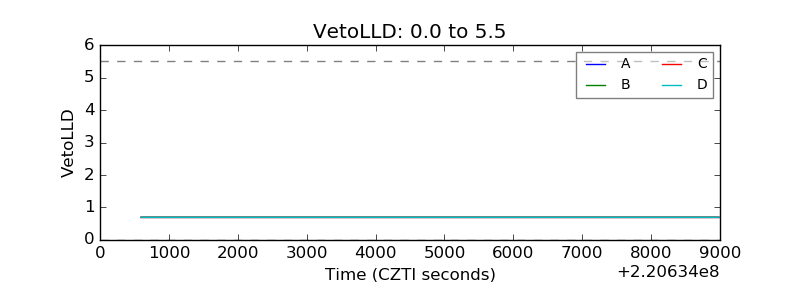 |
| Alpha Counter | 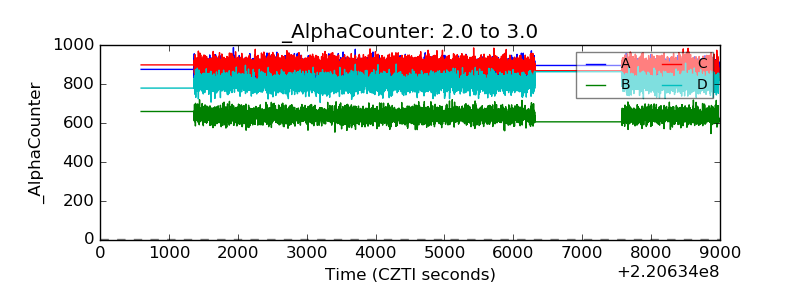 |
| _CPM_Rate | 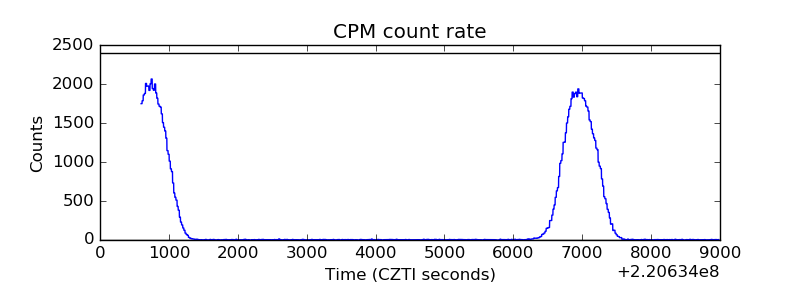 |
| CZT Counter | 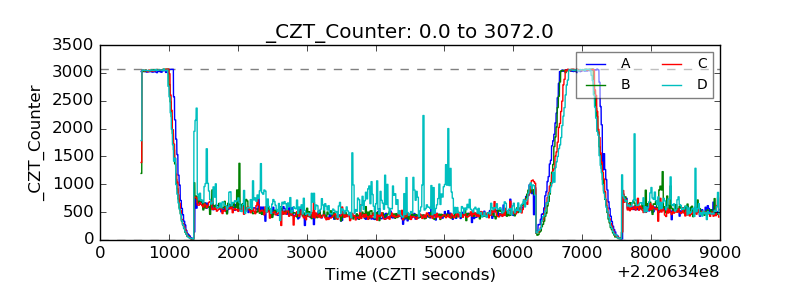 |
| +2.5 Volts monitor |  |
| +5 Volts monitor |  |
| _ROLL_ROT | 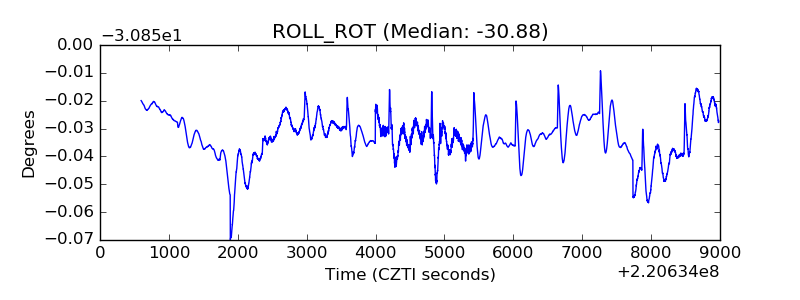 |
| _Roll_DEC | 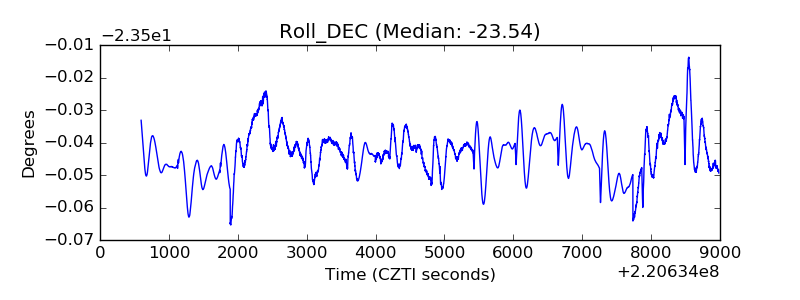 |
| _Roll_RA | 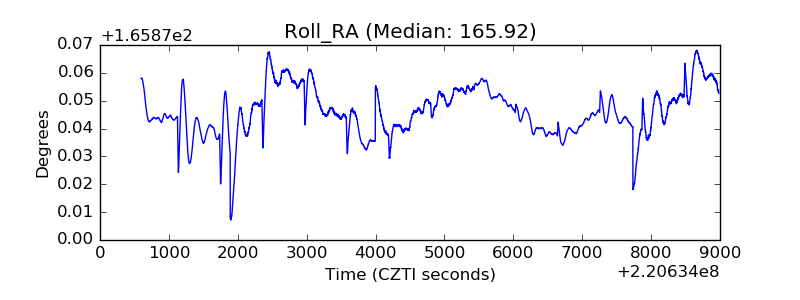 |
| Veto Counter | 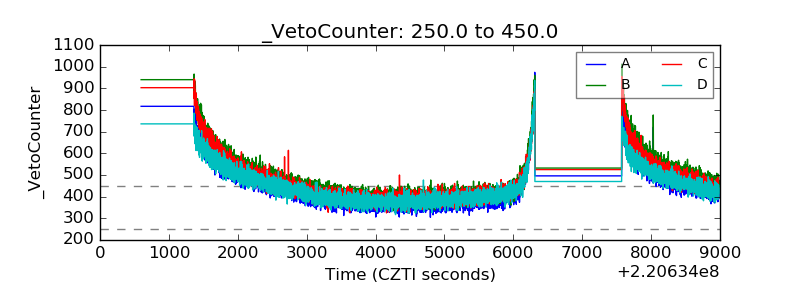 |