| Param | Original file | Final file |
|---|---|---|
| Filename | modeM0/AS1G06_086T02_9000000936_06774cztM0_level2.evt | modeM0/AS1G06_086T02_9000000936_06774cztM0_level2_quad_clean.evt |
| Size (bytes) | 1,916,202,240 | 279,109,440 |
| Size | 1.8 GB | 266.2 MB |
| Events in quadrant A | 11,361,566 | 1,733,587 |
| Events in quadrant B | 11,681,088 | 1,759,253 |
| Events in quadrant C | 12,338,311 | 1,691,600 |
| Events in quadrant D | 21,018,361 | 1,602,599 |
| Mode M9 | |||
|---|---|---|---|
| Quadrant | BADHDUFLAG | Total packets | Discarded packets |
| A | 0 | 46 | 0 |
| B | 0 | 46 | 0 |
| C | 0 | 46 | 0 |
| D | 0 | 46 | 0 |
| Mode M0 | |||
|---|---|---|---|
| Quadrant | BADHDUFLAG | Total packets | Discarded packets |
| A | 0 | 50017 | 6 |
| B | 0 | 50723 | 5 |
| C | 0 | 53246 | 5 |
| D | 0 | 79352 | 13 |
| Mode SS | |||
|---|---|---|---|
| Quadrant | BADHDUFLAG | Total packets | Discarded packets |
| A | 0 | 492 | 0 |
| B | 0 | 492 | 0 |
| C | 0 | 492 | 0 |
| D | 0 | 492 | 0 |
| Quadrant | Total seconds | Saturated seconds | Saturation percentage |
|---|---|---|---|
| A | 24220 | 267 | 1.102395% |
| B | 24220 | 304 | 1.255161% |
| C | 24220 | 579 | 2.390586% |
| D | 24219 | 1874 | 7.737727% |
Noise dominated data is calculated using 1-second bins in cleaned event files. If a bin has >2000 counts, and if more than 50% of those come from <1% of pixels, then it is considered to be noise-dominated and hence unusable.
| Quadrant | # 1 sec bins | Bins with >0 counts | Bins with >2000 counts | High rate bins dominated by noise | Noise dominated (total time) | Noise dominated (detector-on time) | Marked lightcurve |
|---|---|---|---|---|---|---|---|
| A | 45805 | 24226 | 9 | 9 | 0.02% | 0.04% | 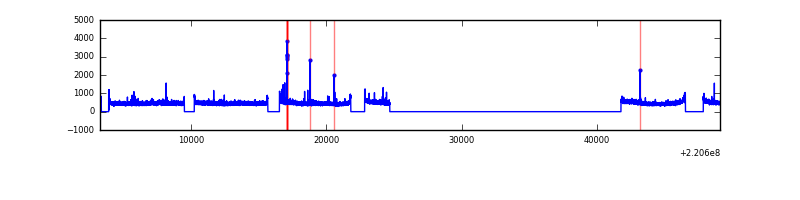 |
| B | 45805 | 24226 | 15 | 15 | 0.03% | 0.06% | 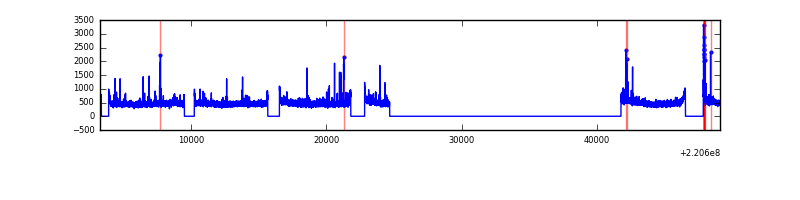 |
| C | 45805 | 24226 | 327 | 327 | 0.71% | 1.35% | 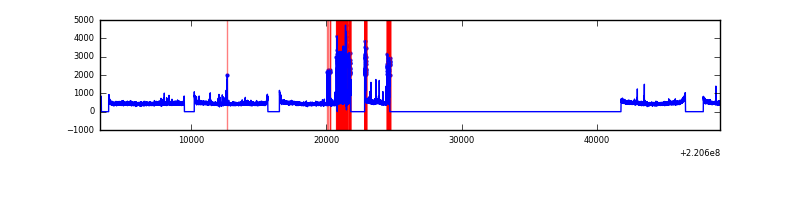 |
| D | 45805 | 24225 | 1285 | 1285 | 2.81% | 5.30% | 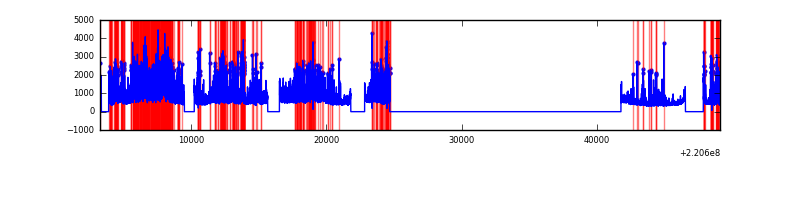 |
Top three noisy pixels from each quadrant. If the there are fewer than three noisy pixels in the level2.evt file, extra rows are filled as -1
| Pixel properties | Quadrant properties | ||||||
|---|---|---|---|---|---|---|---|
| Quadrant | DetID | PixID | Counts | Sigma | Mean | Median | Sigma |
| A | 8 | 15 | 159953 | 268.3 | 2881 | 2817 | 585.7 |
| A | 15 | 239 | 74354 | 122.14 | 2881 | 2817 | 585.7 |
| A | 0 | 226 | 28168 | 43.28 | 2881 | 2817 | 585.7 |
| B | 4 | 48 | 195622 | 349.12 | 2901 | 2825 | 552.2 |
| B | 4 | 81 | 129213 | 228.87 | 2901 | 2825 | 552.2 |
| B | 0 | 214 | 64679 | 112.01 | 2901 | 2825 | 552.2 |
| C | 9 | 247 | 1404603 | 2188.03 | 2776 | 2788 | 640.7 |
| C | 9 | 16 | 79106 | 119.12 | 2776 | 2788 | 640.7 |
| C | 13 | 61 | 21867 | 29.78 | 2776 | 2788 | 640.7 |
| D | 12 | 220 | 5654300 | 8550.15 | 2719 | 2634 | 661.0 |
| D | 2 | 33 | 1593420 | 2406.63 | 2719 | 2634 | 661.0 |
| D | 8 | 195 | 1389762 | 2098.52 | 2719 | 2634 | 661.0 |
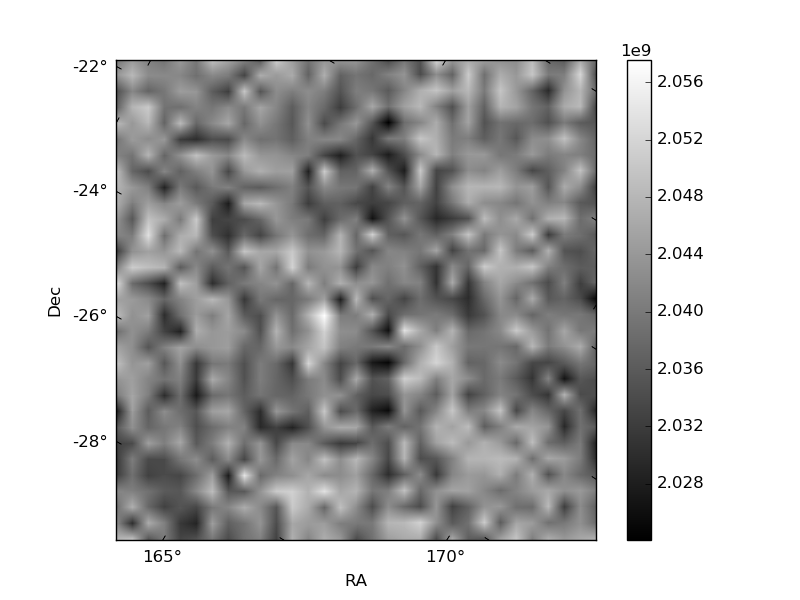
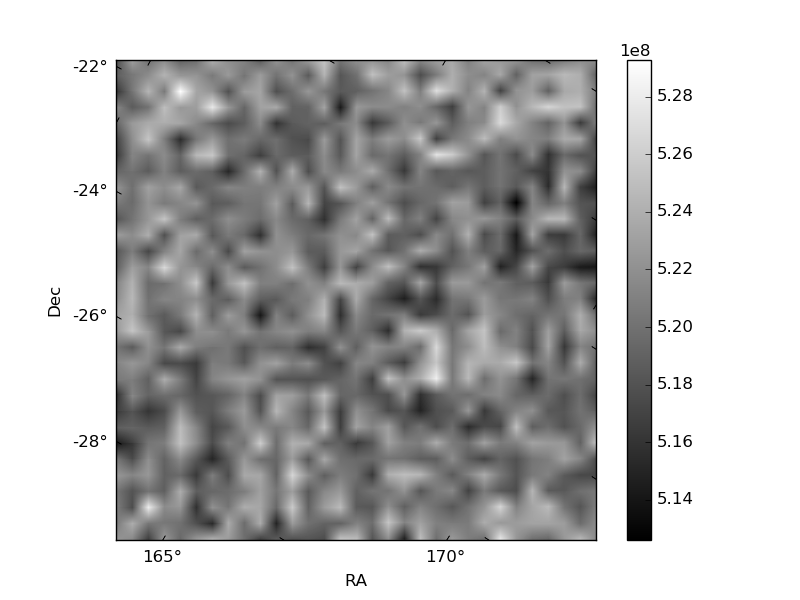
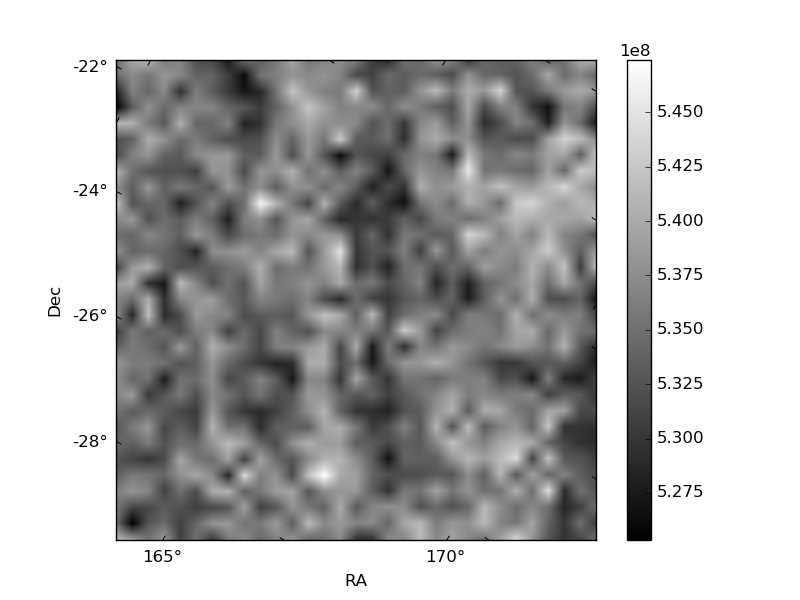
Histogram calculated using DETX and DETY for each event in the final _common_clean file
| Quadrant A | 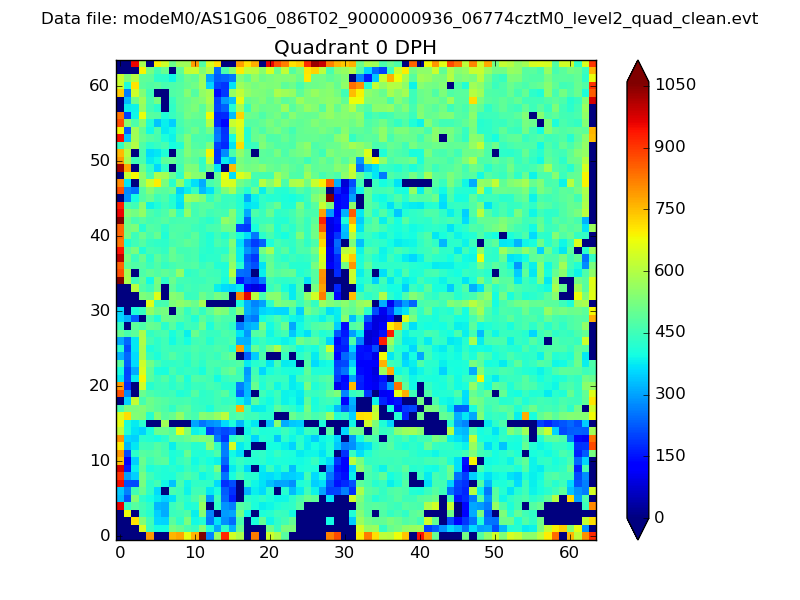 |
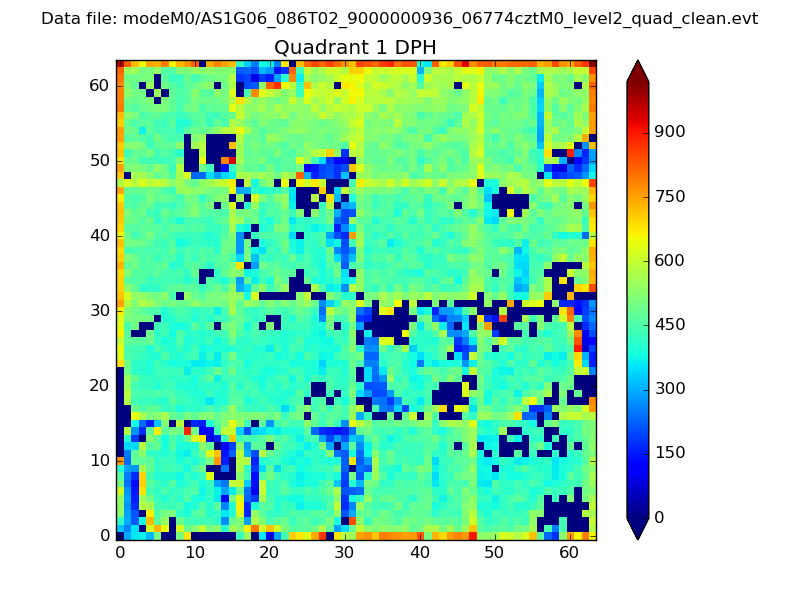 |
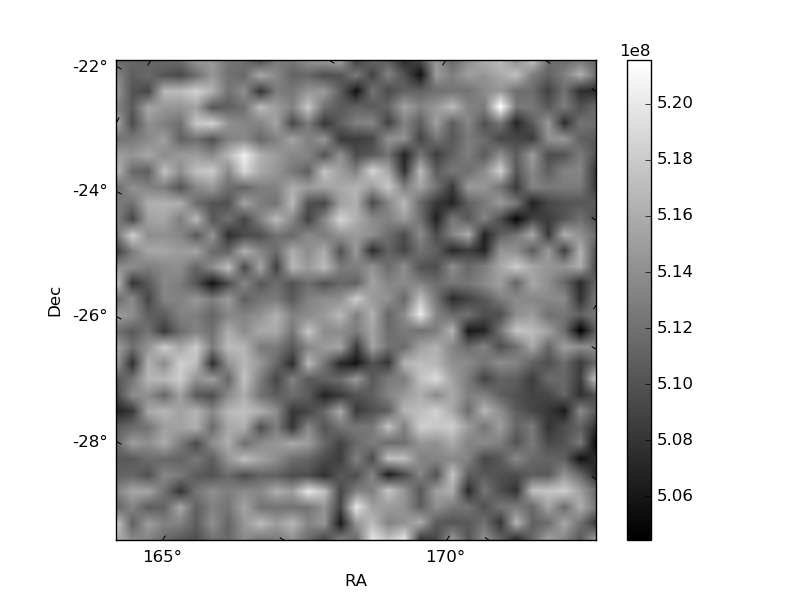
Quadrant B |
|---|---|---|---|
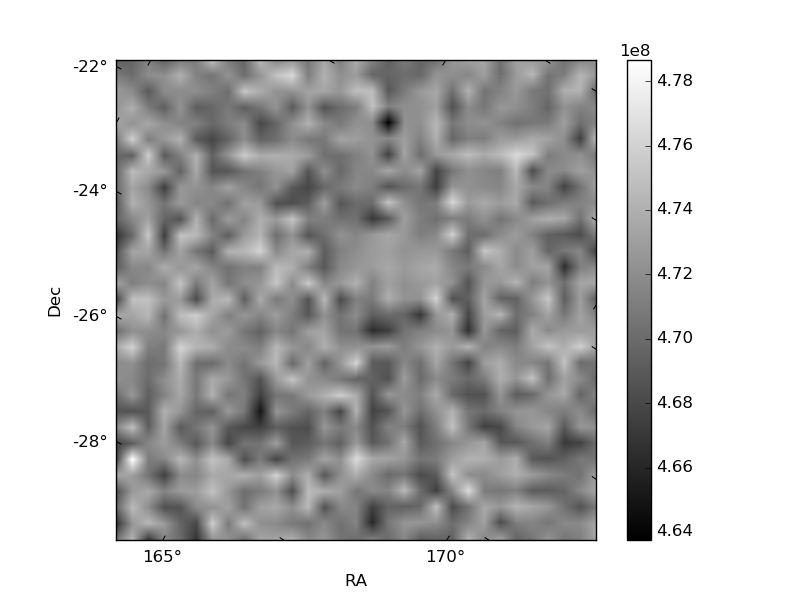
| Quadrant D | 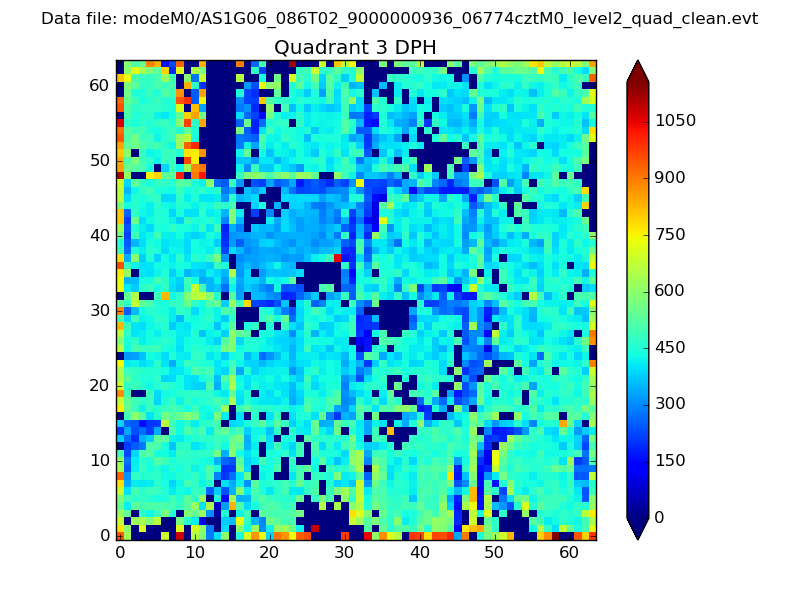 |
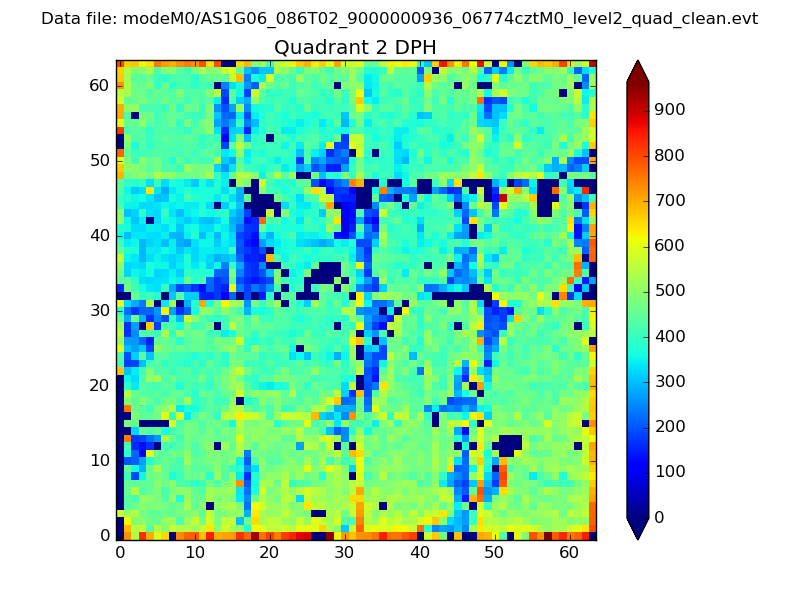 |
Quadrant C |
| Plot type | Count rate plots | Images |
|---|---|---|
| Comparison with Poisson distribution Blue bars denote a histogram of data divided into 1 sec bins. Red curve is a Poisson curve with rate = median count rate of data. |
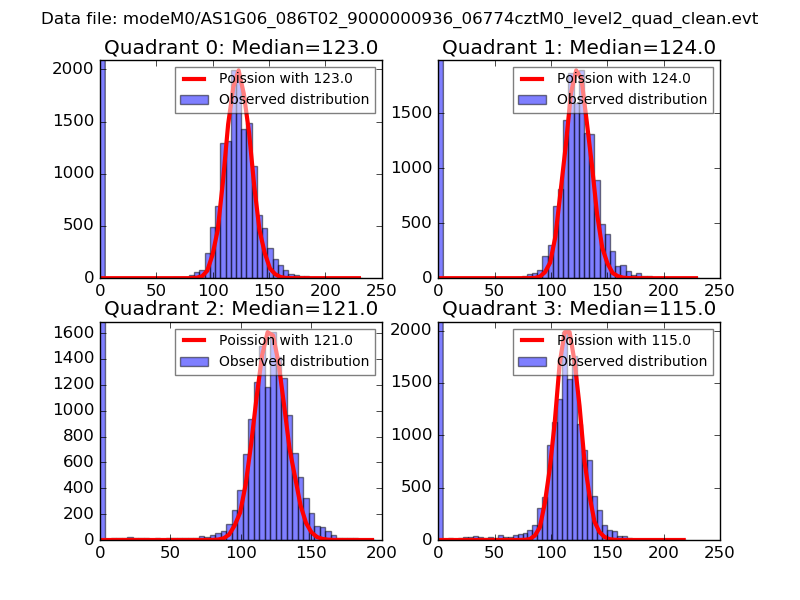 |
 |
| Quadrant-wise count rates Data is divided into 100 sec bins |
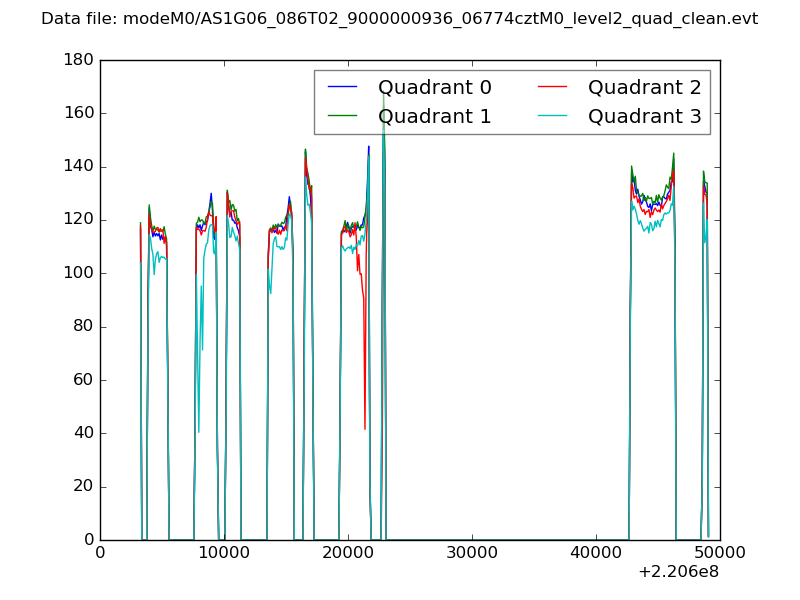 |
|
| Module-wise count rates for Quadrant A Data is divided into 100 sec bins |
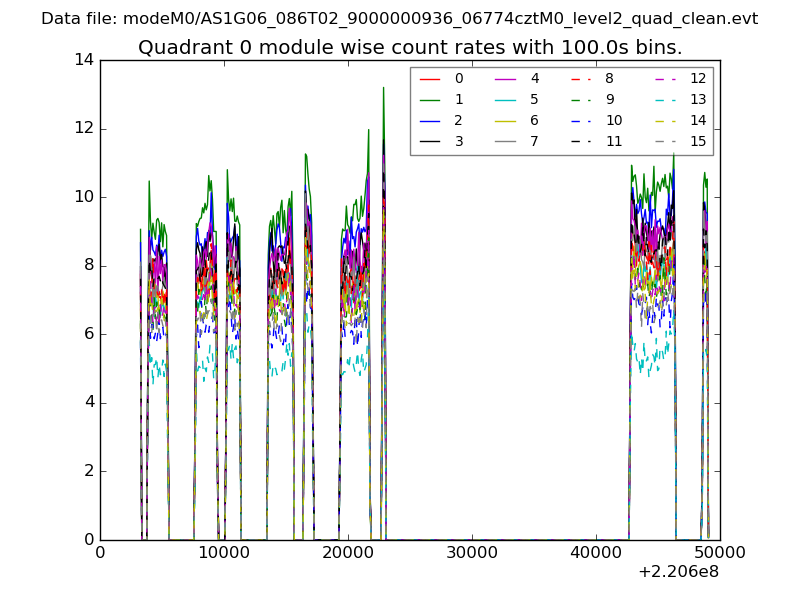 |
 |
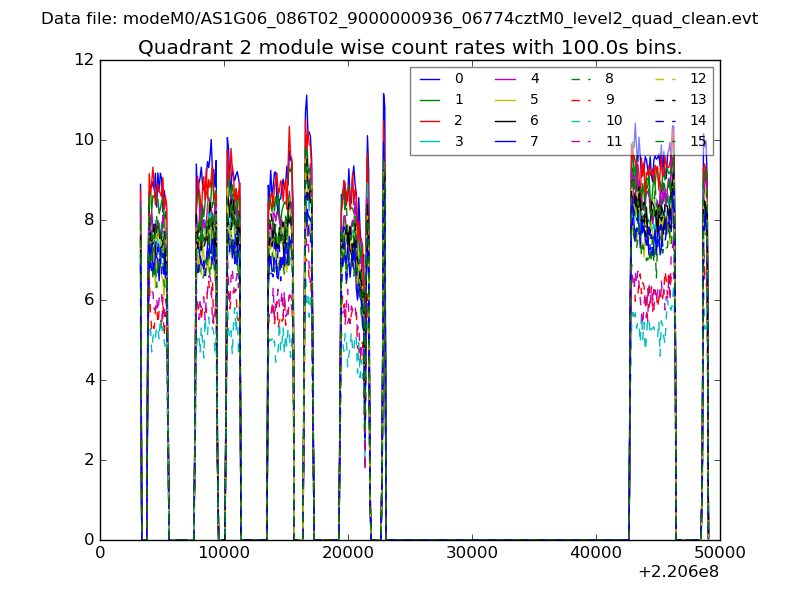
| Module-wise count rates for Quadrant B Data is divided into 100 sec bins |
 |
 |
| Module-wise count rates for Quadrant C Data is divided into 100 sec bins |
 |
 |
| Module-wise count rates for Quadrant D Data is divided into 100 sec bins |
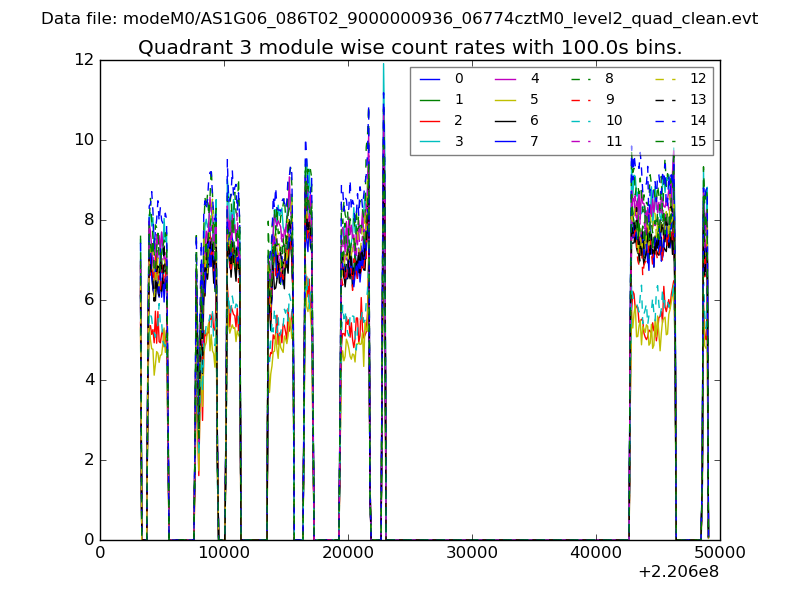 |
 |
| Parameter | Plot |
|---|---|
| CZT HV Monitor | 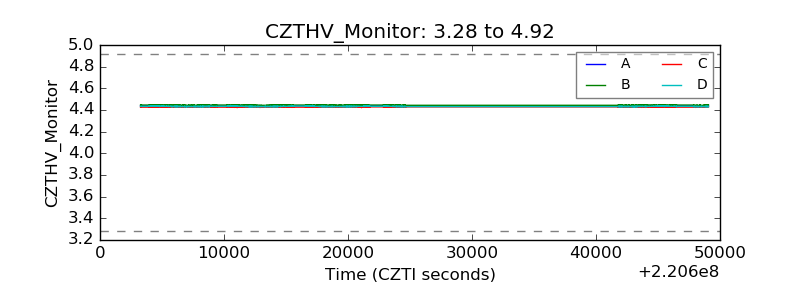 |
| D_VDD | 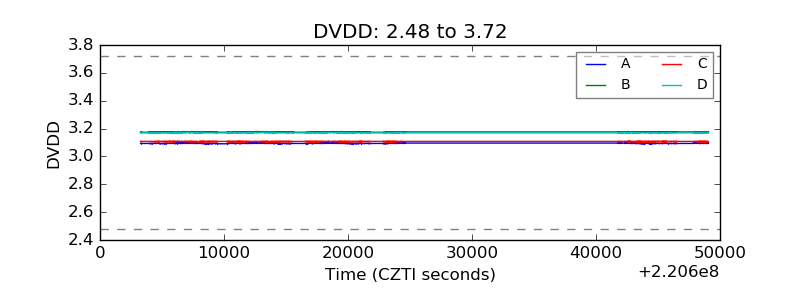 |
| Temperature 1 | 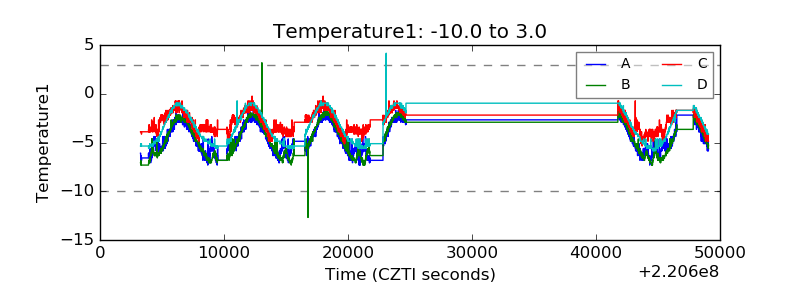 |
| Veto HV Monitor | 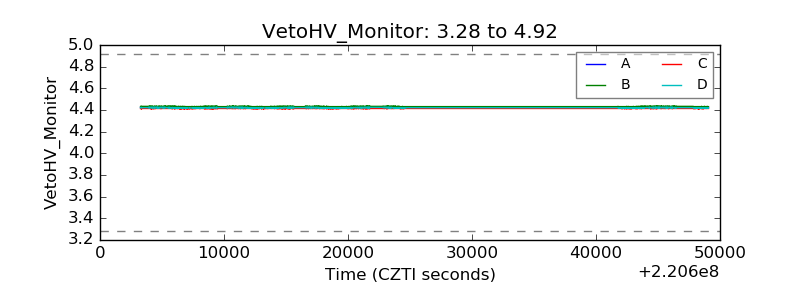 |
| Veto LLD | 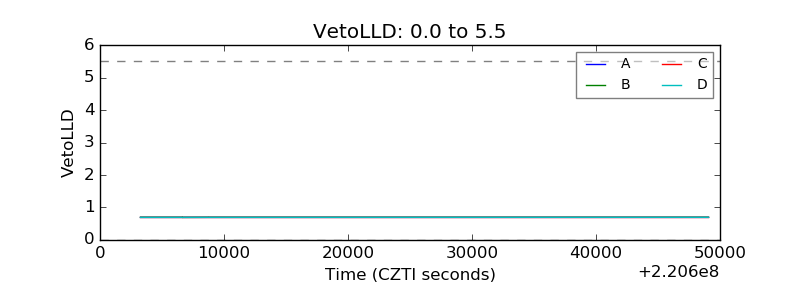 |
| Alpha Counter | 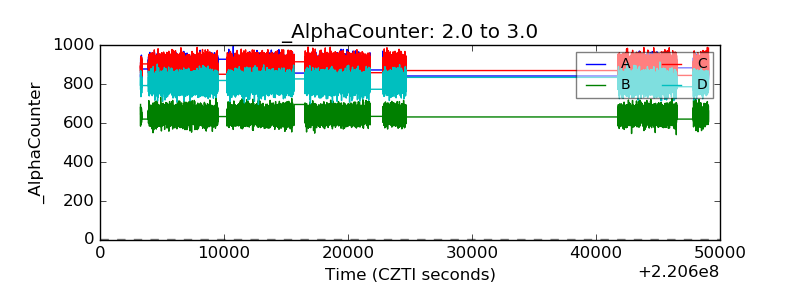 |
| _CPM_Rate | 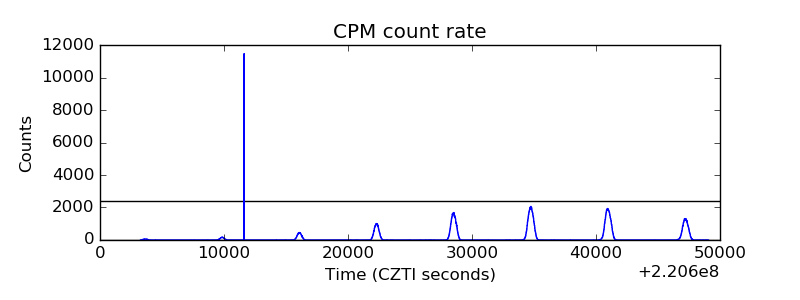 |
| CZT Counter | 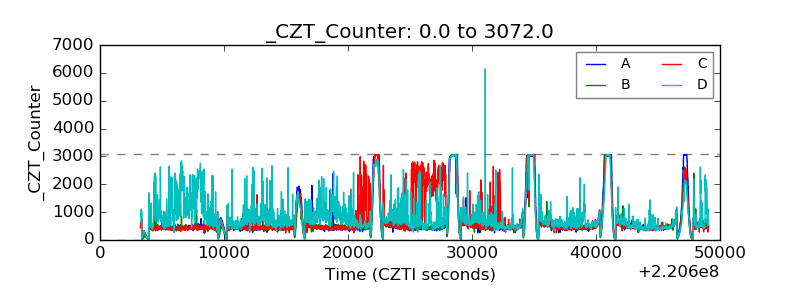 |
| +2.5 Volts monitor | 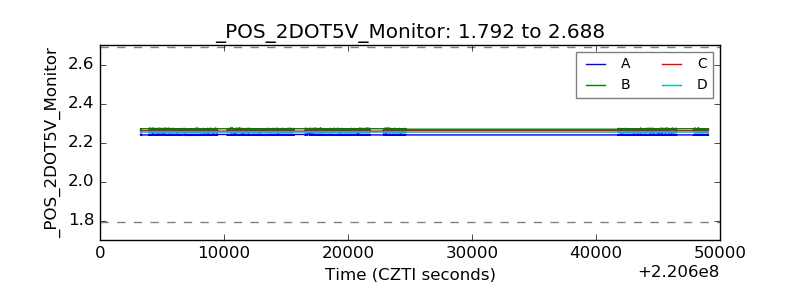 |
| +5 Volts monitor |  |
| _ROLL_ROT | 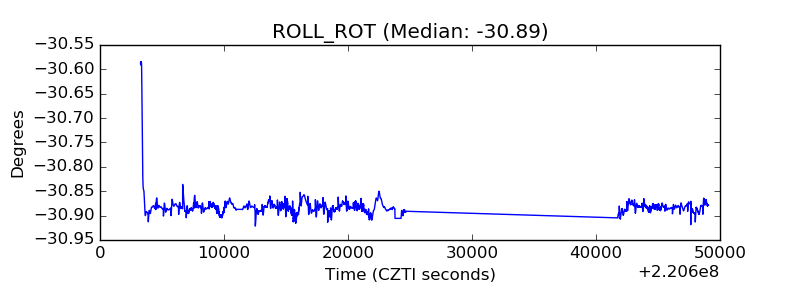 |
| _Roll_DEC | 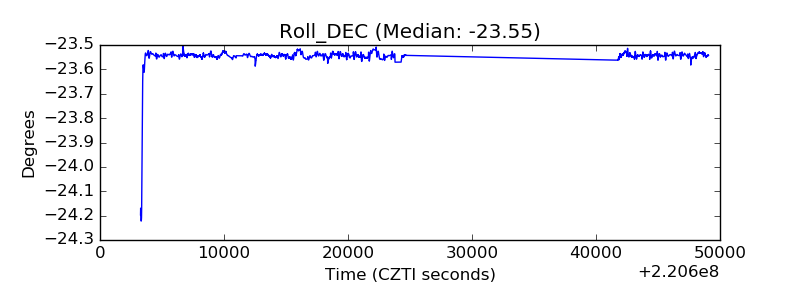 |
| _Roll_RA | 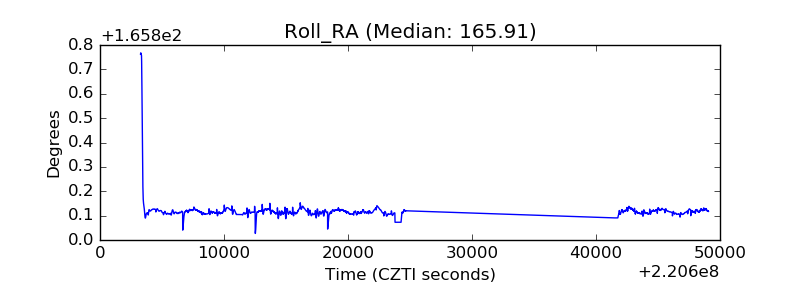 |
| Veto Counter | 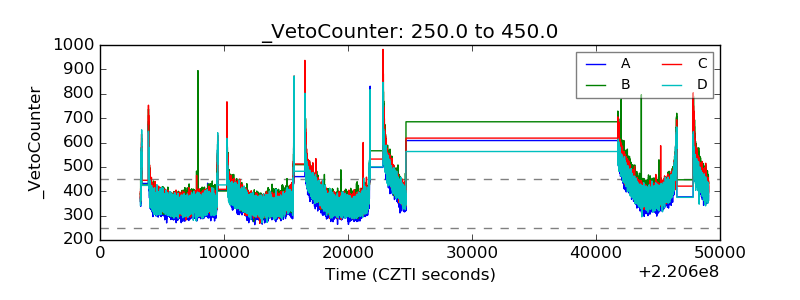 |