| Param | Original file | Final file |
|---|---|---|
| Filename | modeM0/AS1G06_086T02_9000000936_06775cztM0_level2.evt | modeM0/AS1G06_086T02_9000000936_06775cztM0_level2_quad_clean.evt |
| Size (bytes) | 458,801,280 | 89,735,040 |
| Size | 437.5 MB | 85.6 MB |
| Events in quadrant A | 3,148,253 | 573,816 |
| Events in quadrant B | 3,262,082 | 583,920 |
| Events in quadrant C | 3,096,467 | 566,272 |
| Events in quadrant D | 3,942,669 | 536,713 |
| Mode M9 | |||
|---|---|---|---|
| Quadrant | BADHDUFLAG | Total packets | Discarded packets |
| A | 0 | 24 | 0 |
| B | 0 | 24 | 0 |
| C | 0 | 24 | 0 |
| D | 0 | 24 | 0 |
| Mode M0 | |||
|---|---|---|---|
| Quadrant | BADHDUFLAG | Total packets | Discarded packets |
| A | 0 | 13750 | 3 |
| B | 0 | 14029 | 2 |
| C | 0 | 13653 | 2 |
| D | 0 | 16255 | 2 |
| Mode SS | |||
|---|---|---|---|
| Quadrant | BADHDUFLAG | Total packets | Discarded packets |
| A | 0 | 136 | 0 |
| B | 0 | 136 | 0 |
| C | 0 | 136 | 0 |
| D | 0 | 136 | 0 |
| Quadrant | Total seconds | Saturated seconds | Saturation percentage |
|---|---|---|---|
| A | 6548 | 115 | 1.756261% |
| B | 6548 | 151 | 2.306048% |
| C | 6548 | 46 | 0.702505% |
| D | 6548 | 205 | 3.130727% |
Noise dominated data is calculated using 1-second bins in cleaned event files. If a bin has >2000 counts, and if more than 50% of those come from <1% of pixels, then it is considered to be noise-dominated and hence unusable.
| Quadrant | # 1 sec bins | Bins with >0 counts | Bins with >2000 counts | High rate bins dominated by noise | Noise dominated (total time) | Noise dominated (detector-on time) | Marked lightcurve |
|---|---|---|---|---|---|---|---|
| A | 9023 | 6550 | 0 | 0 | 0.00% | 0.00% | 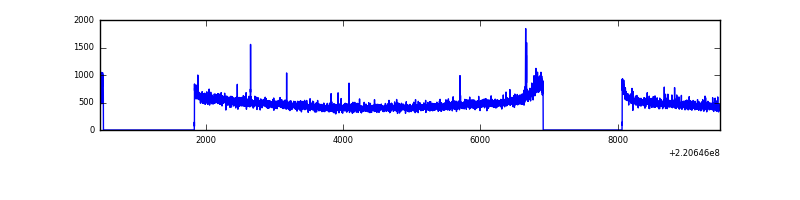 |
| B | 9023 | 6550 | 11 | 11 | 0.12% | 0.17% | 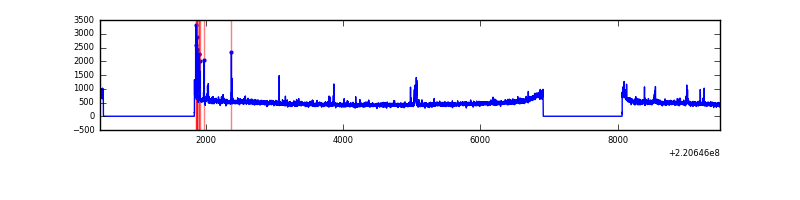 |
| C | 9023 | 6550 | 0 | 0 | 0.00% | 0.00% | 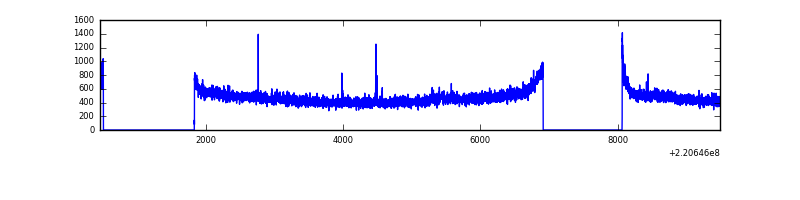 |
| D | 9023 | 6550 | 95 | 95 | 1.05% | 1.45% | 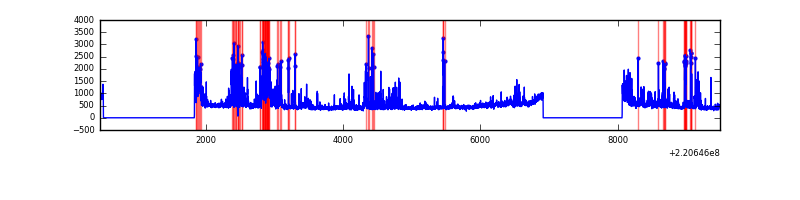 |
Top three noisy pixels from each quadrant. If the there are fewer than three noisy pixels in the level2.evt file, extra rows are filled as -1
| Pixel properties | Quadrant properties | ||||||
|---|---|---|---|---|---|---|---|
| Quadrant | DetID | PixID | Counts | Sigma | Mean | Median | Sigma |
| A | 8 | 15 | 20272 | 119.95 | 802 | 785 | 162.5 |
| A | 13 | 248 | 17934 | 105.56 | 802 | 785 | 162.5 |
| A | 0 | 23 | 11015 | 62.97 | 802 | 785 | 162.5 |
| B | 4 | 48 | 76645 | 491.19 | 808 | 788 | 154.4 |
| B | 0 | 214 | 20069 | 124.85 | 808 | 788 | 154.4 |
| B | 12 | 111 | 14899 | 91.37 | 808 | 788 | 154.4 |
| C | 9 | 247 | 52343 | 285.77 | 776 | 780 | 180.4 |
| C | 9 | 16 | 7069 | 34.85 | 776 | 780 | 180.4 |
| C | 13 | 61 | 6122 | 29.61 | 776 | 780 | 180.4 |
| D | 2 | 152 | 493464 | 2641.82 | 763 | 740 | 186.5 |
| D | 2 | 216 | 288404 | 1542.36 | 763 | 740 | 186.5 |
| D | 8 | 195 | 83997 | 446.4 | 763 | 740 | 186.5 |
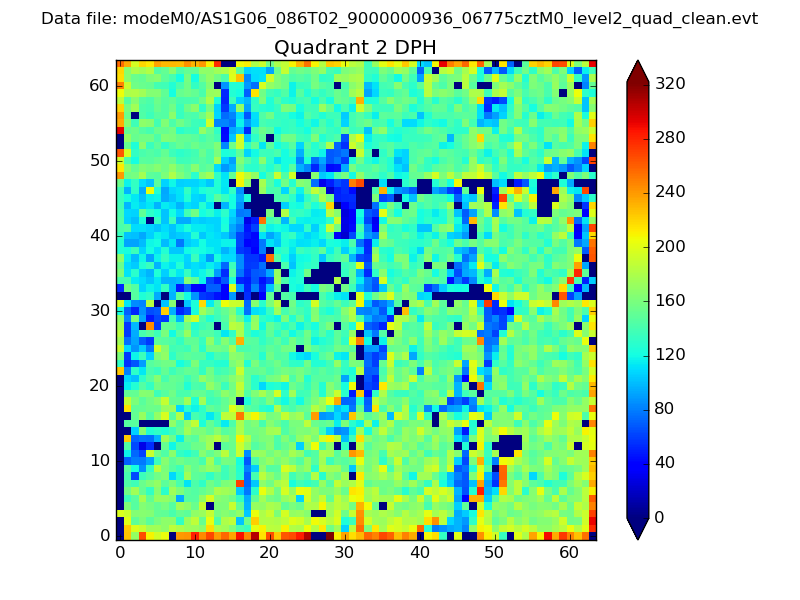
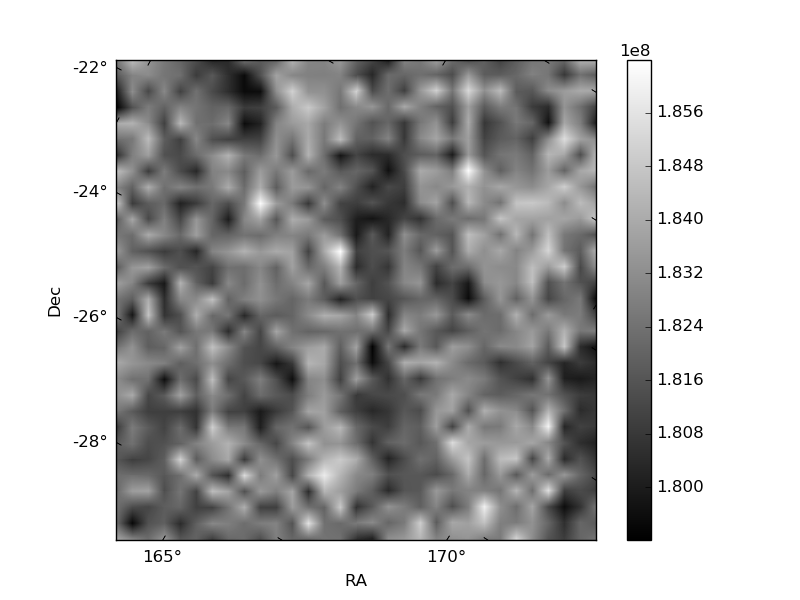
Histogram calculated using DETX and DETY for each event in the final _common_clean file
| Quadrant A | 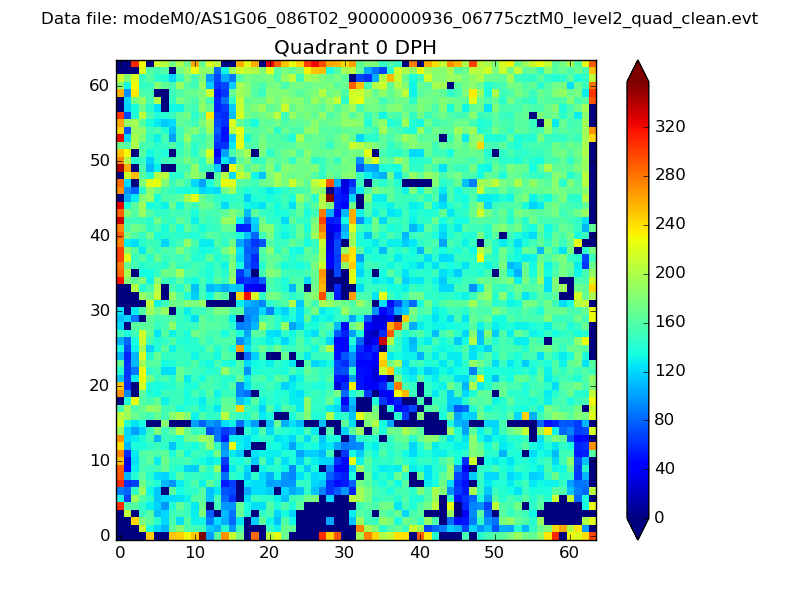 |
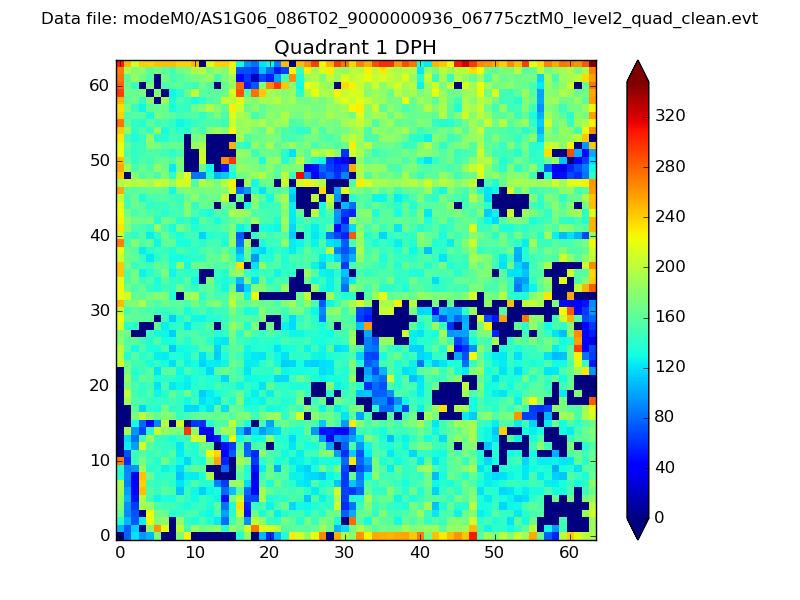 |
Quadrant B |
|---|---|---|---|
| Quadrant D | 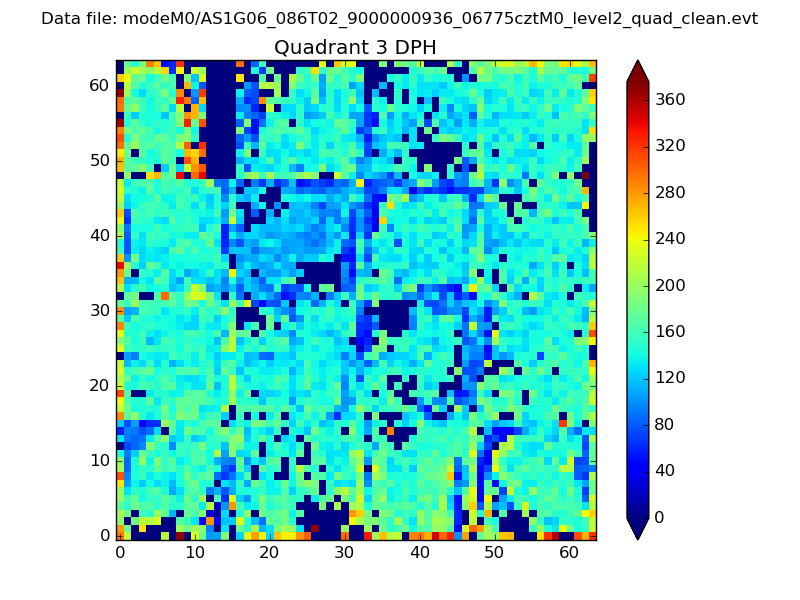 |
 |
Quadrant C |
| Plot type | Count rate plots | Images |
|---|---|---|
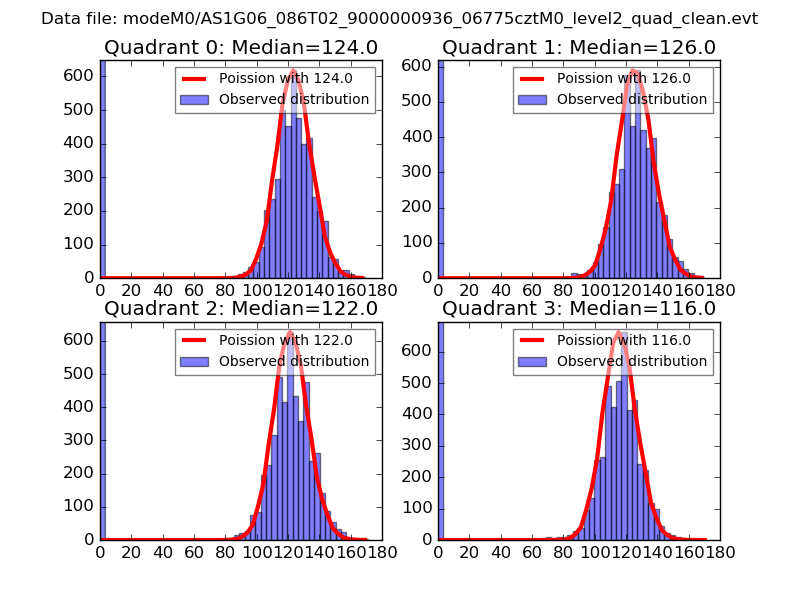
| Comparison with Poisson distribution Blue bars denote a histogram of data divided into 1 sec bins. Red curve is a Poisson curve with rate = median count rate of data. |
 |
 |
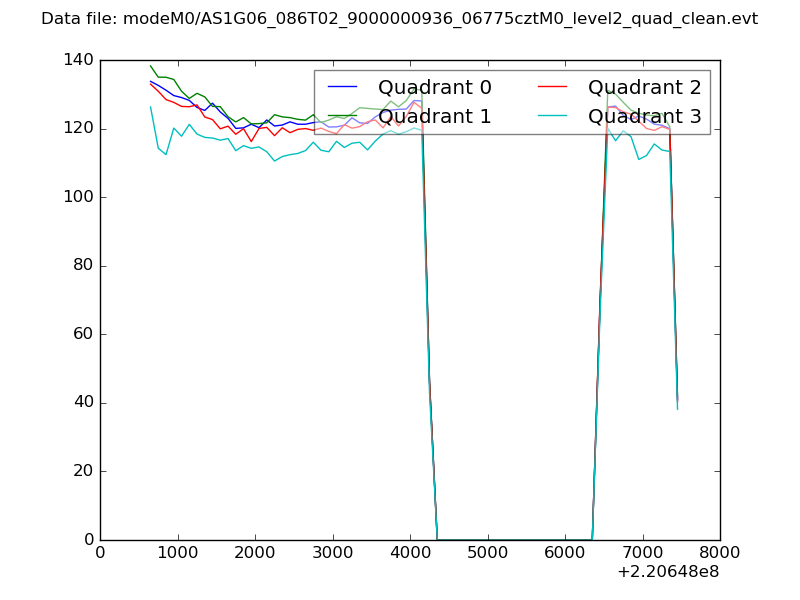
| Quadrant-wise count rates Data is divided into 100 sec bins |
 |
|
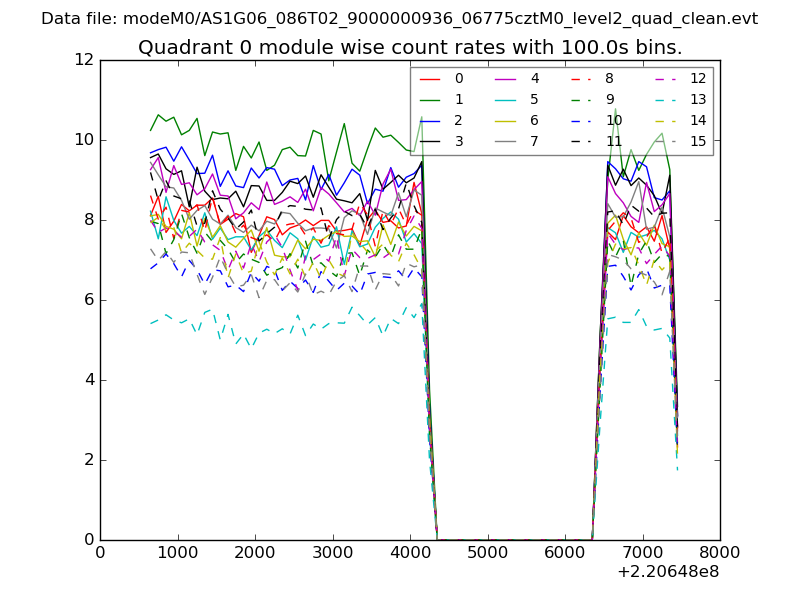
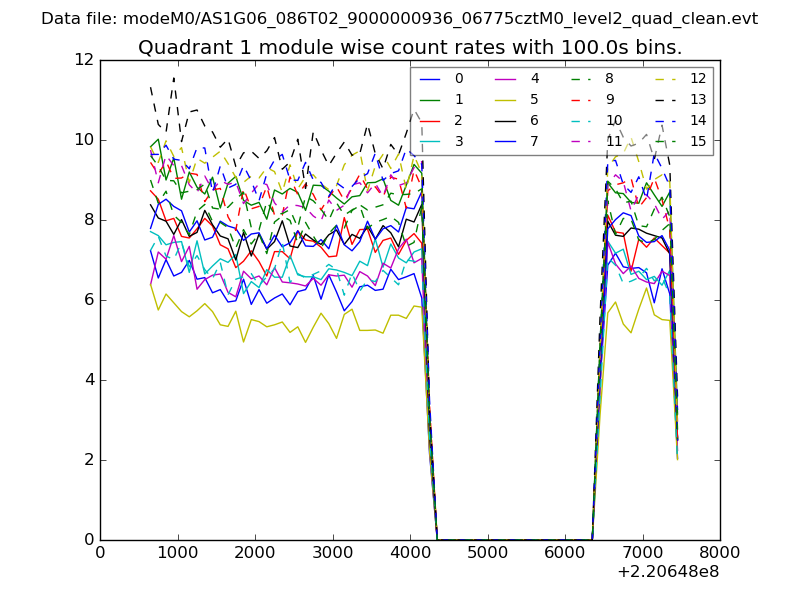
| Module-wise count rates for Quadrant A Data is divided into 100 sec bins |
 |
 |
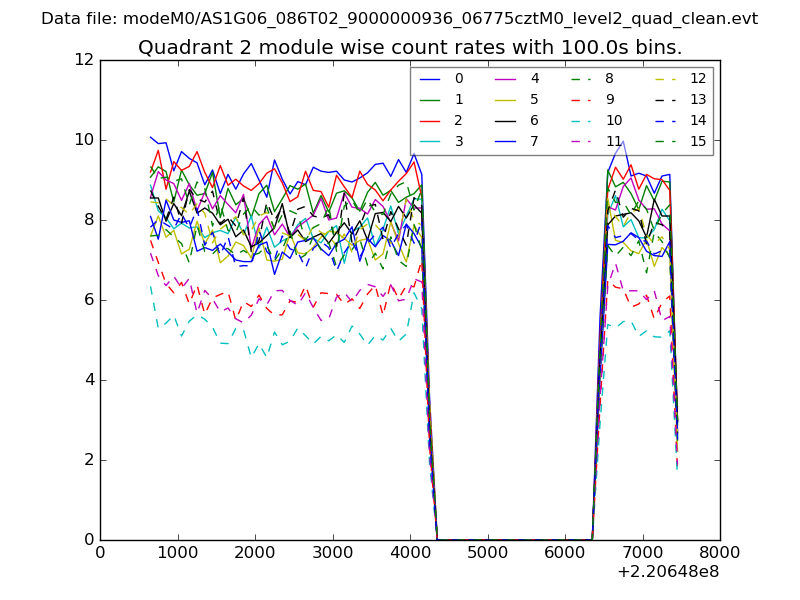
| Module-wise count rates for Quadrant B Data is divided into 100 sec bins |
 |
 |
| Module-wise count rates for Quadrant C Data is divided into 100 sec bins |
 |
 |
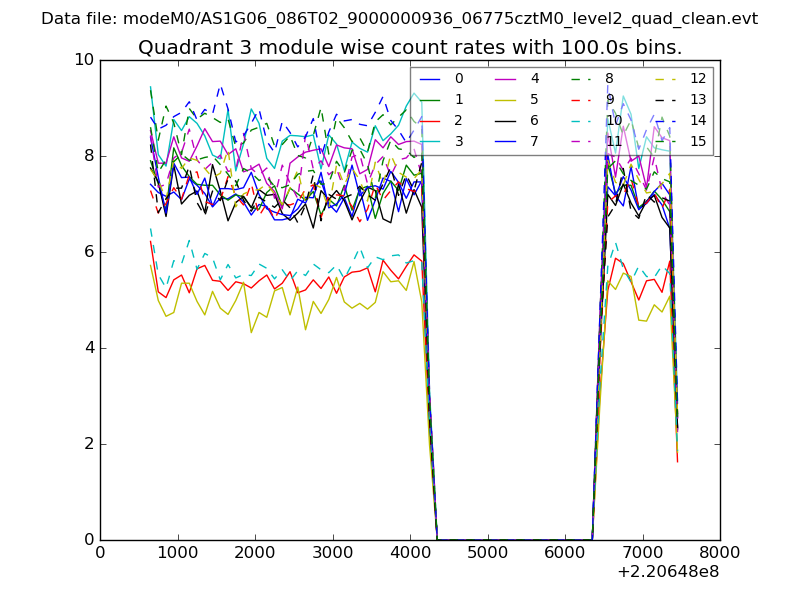
| Module-wise count rates for Quadrant D Data is divided into 100 sec bins |
 |
 |
| Parameter | Plot |
|---|---|
| CZT HV Monitor | 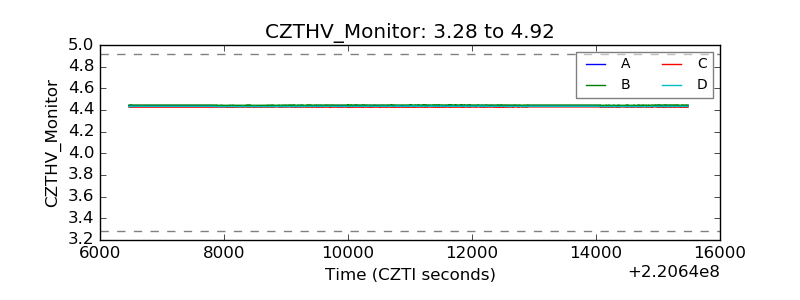 |
| D_VDD | 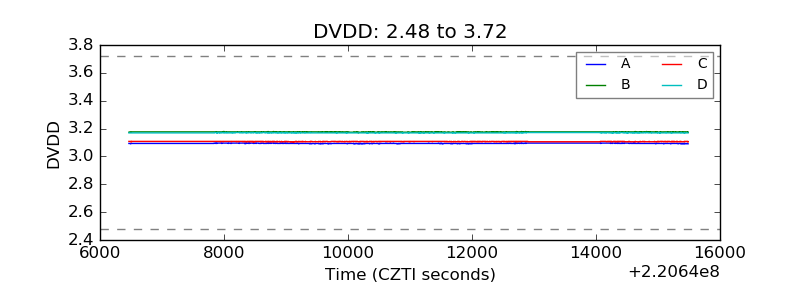 |
| Temperature 1 |  |
| Veto HV Monitor | 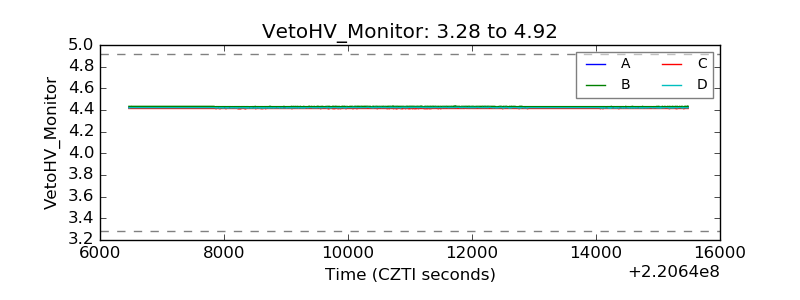 |
| Veto LLD |  |
| Alpha Counter | 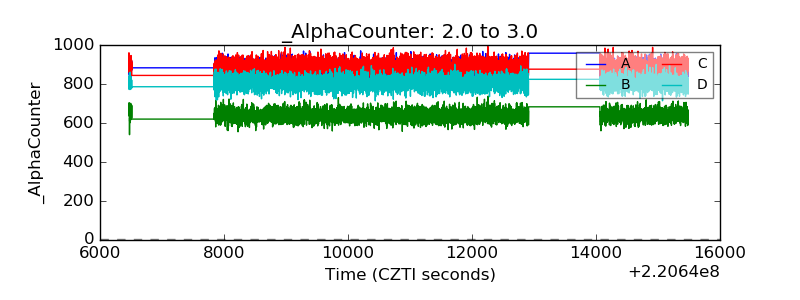 |
| _CPM_Rate | 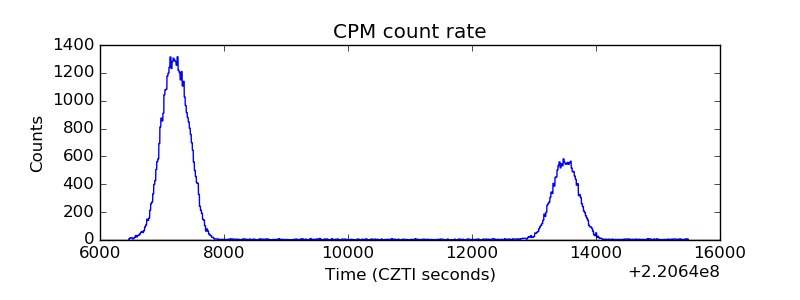 |
| CZT Counter | 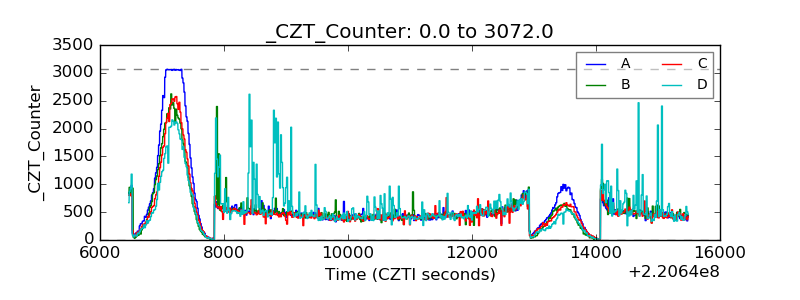 |
| +2.5 Volts monitor |  |
| +5 Volts monitor |  |
| _ROLL_ROT | 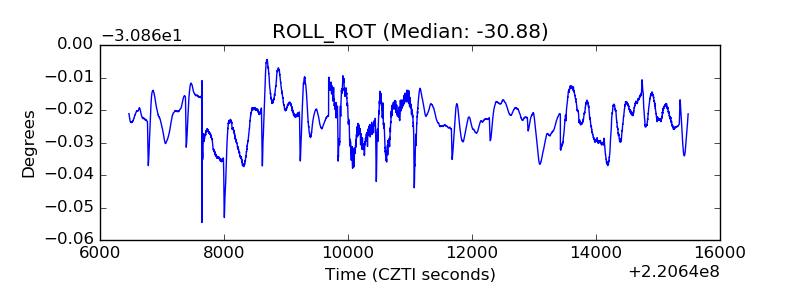 |
| _Roll_DEC | 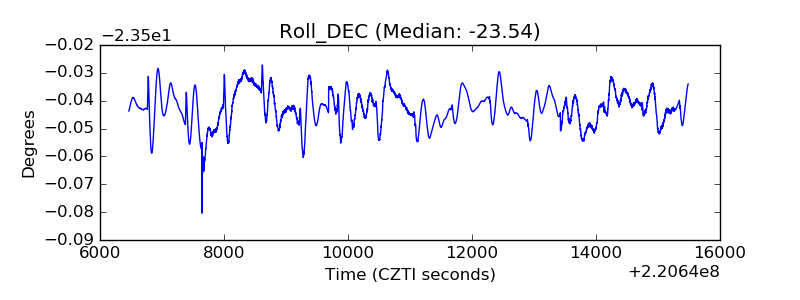 |
| _Roll_RA | 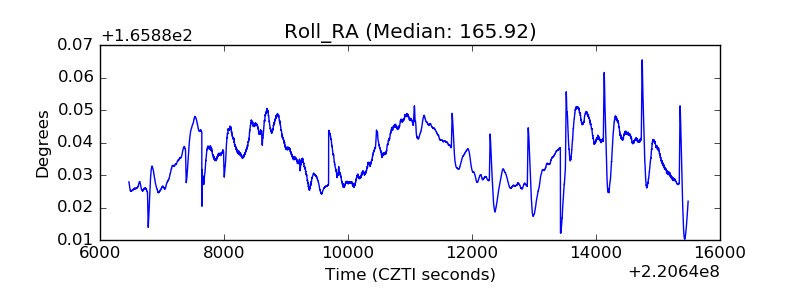 |
| Veto Counter | 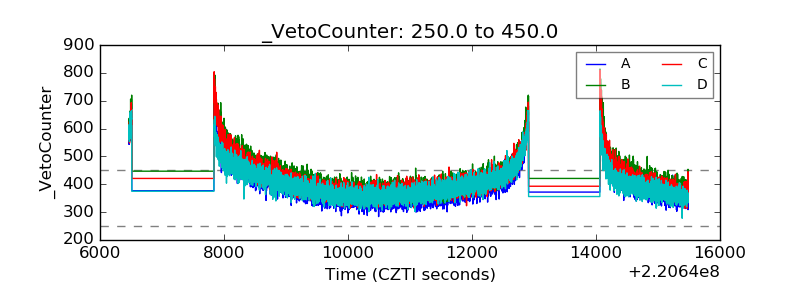 |