| Param | Original file | Final file |
|---|---|---|
| Filename | modeM0/AS1G06_086T02_9000000936_06777cztM0_level2.evt | modeM0/AS1G06_086T02_9000000936_06777cztM0_level2_quad_clean.evt |
| Size (bytes) | 501,482,880 | 96,134,400 |
| Size | 478.3 MB | 91.7 MB |
| Events in quadrant A | 3,594,292 | 597,854 |
| Events in quadrant B | 3,686,570 | 609,835 |
| Events in quadrant C | 3,567,461 | 596,609 |
| Events in quadrant D | 3,814,435 | 569,879 |
| Mode M9 | |||
|---|---|---|---|
| Quadrant | BADHDUFLAG | Total packets | Discarded packets |
| A | 0 | 14 | 0 |
| B | 0 | 14 | 0 |
| C | 0 | 14 | 0 |
| D | 0 | 14 | 0 |
| Mode M0 | |||
|---|---|---|---|
| Quadrant | BADHDUFLAG | Total packets | Discarded packets |
| A | 0 | 16143 | 3 |
| B | 0 | 16347 | 2 |
| C | 0 | 16083 | 2 |
| D | 0 | 16668 | 2 |
| Mode SS | |||
|---|---|---|---|
| Quadrant | BADHDUFLAG | Total packets | Discarded packets |
| A | 0 | 158 | 0 |
| B | 0 | 158 | 0 |
| C | 0 | 158 | 0 |
| D | 0 | 158 | 0 |
| Quadrant | Total seconds | Saturated seconds | Saturation percentage |
|---|---|---|---|
| A | 7725 | 61 | 0.789644% |
| B | 7725 | 79 | 1.022654% |
| C | 7725 | 45 | 0.582524% |
| D | 7725 | 37 | 0.478964% |
Noise dominated data is calculated using 1-second bins in cleaned event files. If a bin has >2000 counts, and if more than 50% of those come from <1% of pixels, then it is considered to be noise-dominated and hence unusable.
| Quadrant | # 1 sec bins | Bins with >0 counts | Bins with >2000 counts | High rate bins dominated by noise | Noise dominated (total time) | Noise dominated (detector-on time) | Marked lightcurve |
|---|---|---|---|---|---|---|---|
| A | 9080 | 7727 | 2 | 2 | 0.02% | 0.03% | 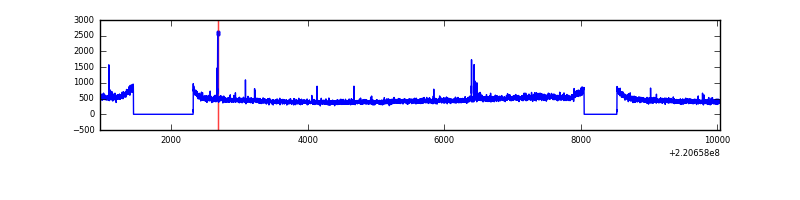 |
| B | 9080 | 7727 | 0 | 0 | 0.00% | 0.00% | 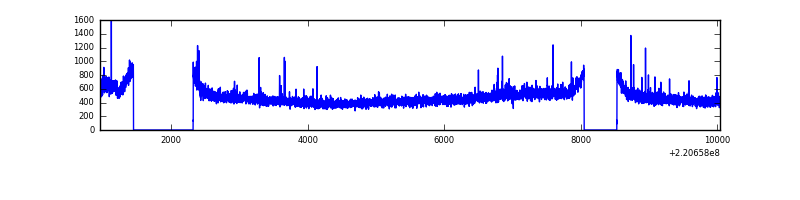 |
| C | 9080 | 7727 | 6 | 6 | 0.07% | 0.08% | 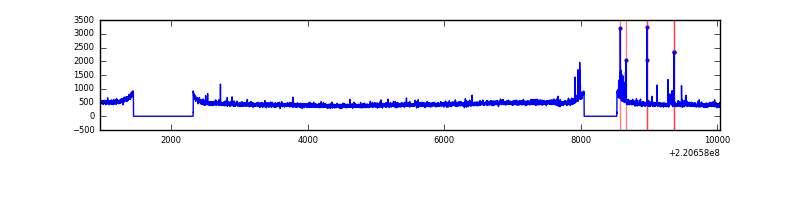 |
| D | 9080 | 7727 | 15 | 15 | 0.17% | 0.19% | 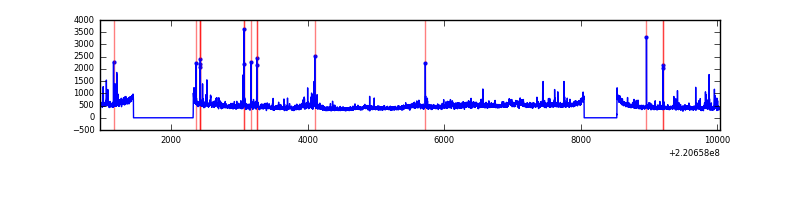 |
Top three noisy pixels from each quadrant. If the there are fewer than three noisy pixels in the level2.evt file, extra rows are filled as -1
| Pixel properties | Quadrant properties | ||||||
|---|---|---|---|---|---|---|---|
| Quadrant | DetID | PixID | Counts | Sigma | Mean | Median | Sigma |
| A | 0 | 23 | 33906 | 174.25 | 913 | 892 | 189.5 |
| A | 13 | 248 | 32696 | 167.86 | 913 | 892 | 189.5 |
| A | 0 | 226 | 11109 | 53.92 | 913 | 892 | 189.5 |
| B | 0 | 214 | 37417 | 203.93 | 926 | 902 | 179.1 |
| B | 12 | 111 | 18042 | 95.72 | 926 | 902 | 179.1 |
| B | 0 | 228 | 16866 | 89.16 | 926 | 902 | 179.1 |
| C | 9 | 247 | 83195 | 395.94 | 889 | 893 | 207.9 |
| C | 12 | 4 | 7214 | 30.41 | 889 | 893 | 207.9 |
| C | 13 | 61 | 6931 | 29.05 | 889 | 893 | 207.9 |
| D | 8 | 195 | 262073 | 1184.62 | 884 | 853 | 220.5 |
| D | 2 | 152 | 124342 | 560.02 | 884 | 853 | 220.5 |
| D | 2 | 14 | 43241 | 192.23 | 884 | 853 | 220.5 |
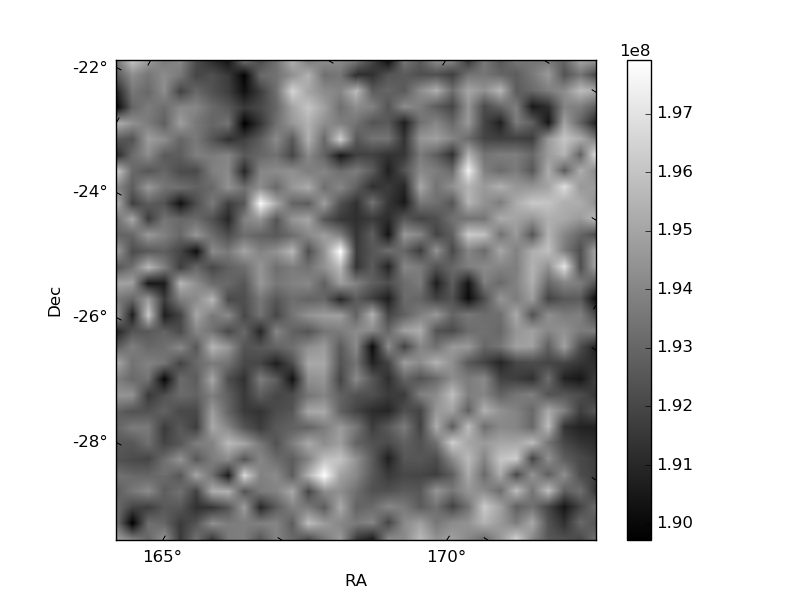
Histogram calculated using DETX and DETY for each event in the final _common_clean file
| Quadrant A | 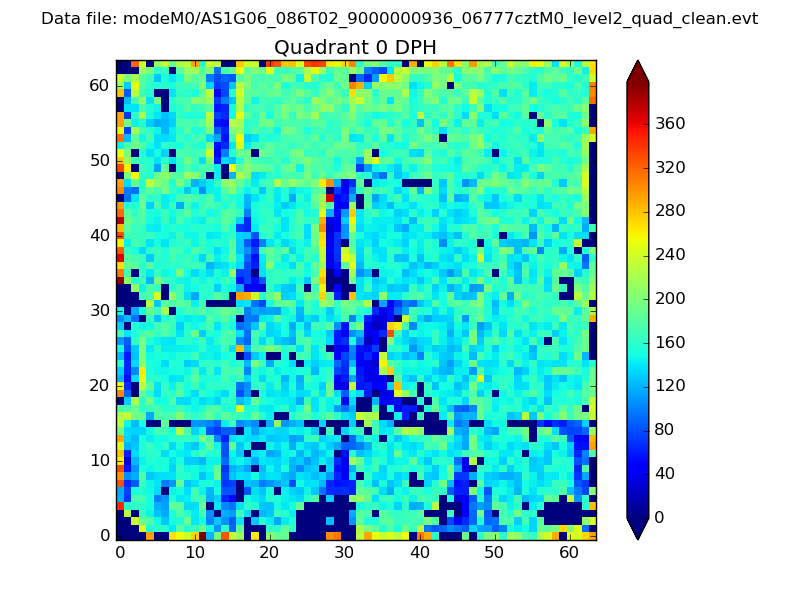 |
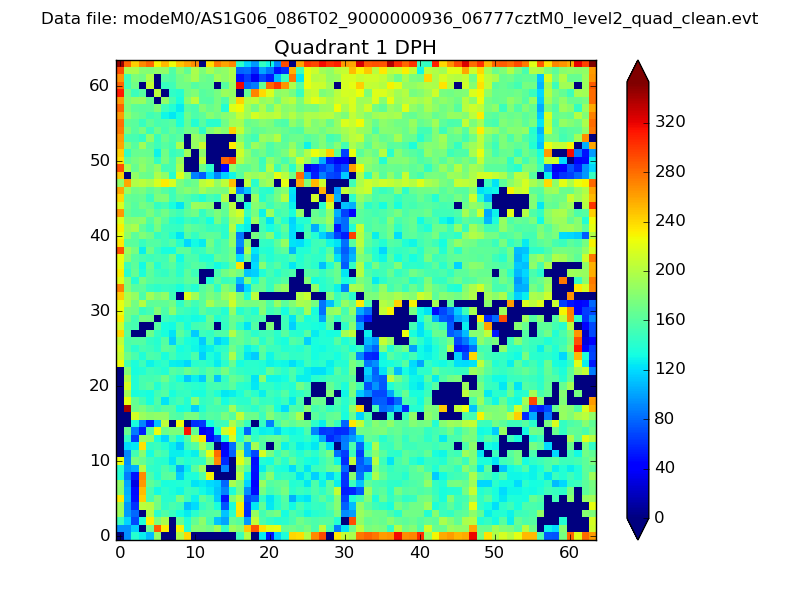 |
Quadrant B |
|---|---|---|---|
| Quadrant D | 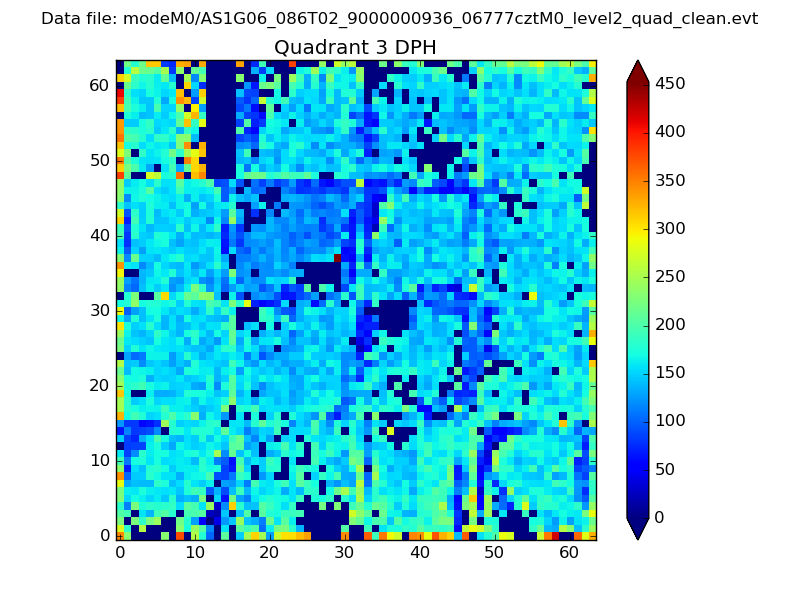 |
 |
Quadrant C |
| Plot type | Count rate plots | Images |
|---|---|---|
| Comparison with Poisson distribution Blue bars denote a histogram of data divided into 1 sec bins. Red curve is a Poisson curve with rate = median count rate of data. |
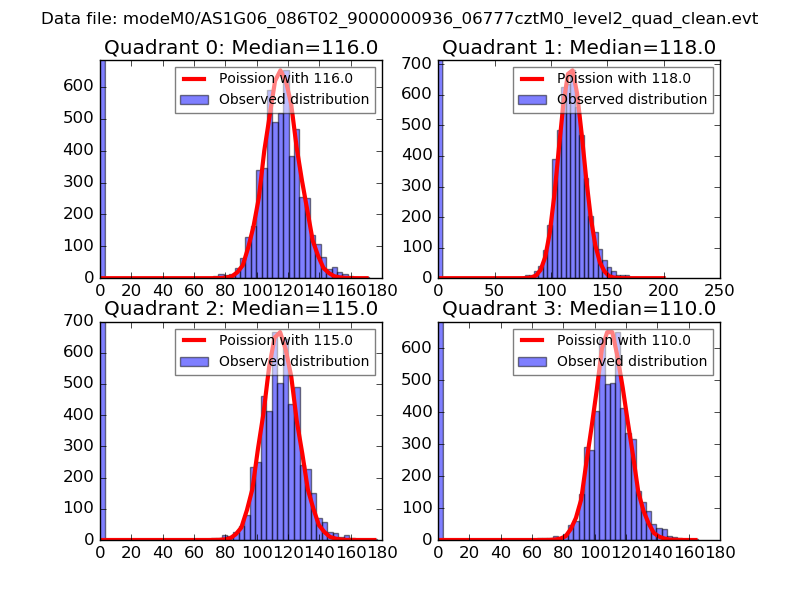 |
 |
| Quadrant-wise count rates Data is divided into 100 sec bins |
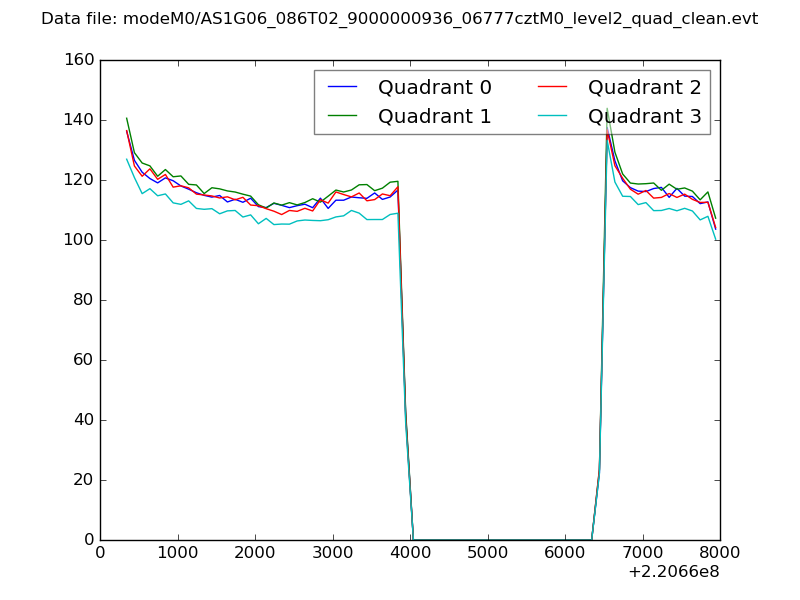 |
|
| Module-wise count rates for Quadrant A Data is divided into 100 sec bins |
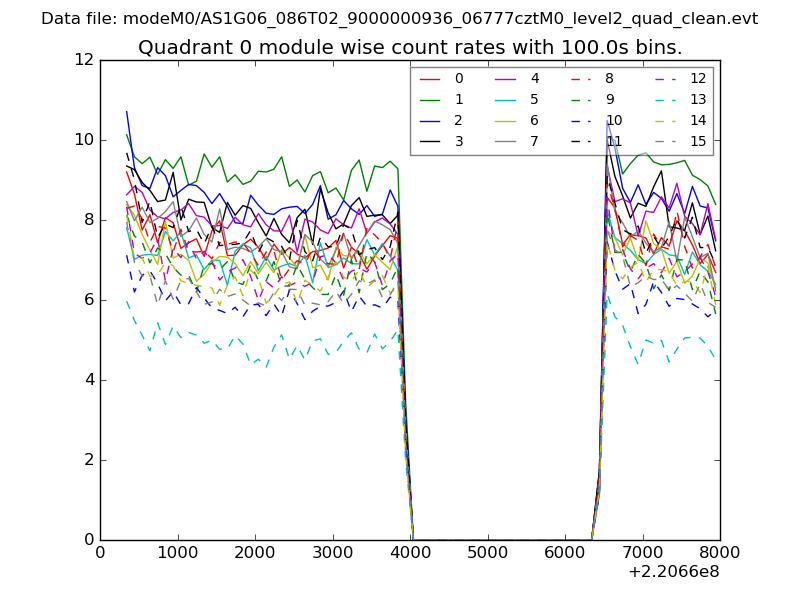 |
 |
| Module-wise count rates for Quadrant B Data is divided into 100 sec bins |
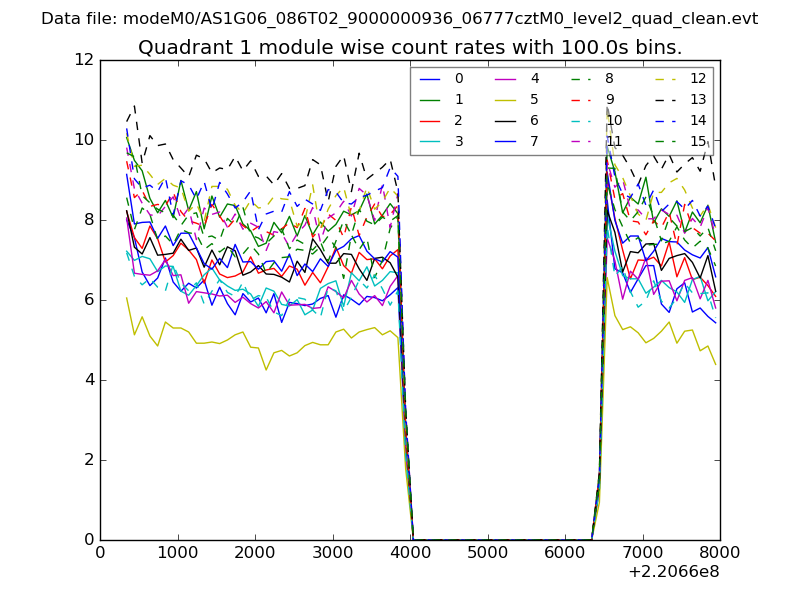 |
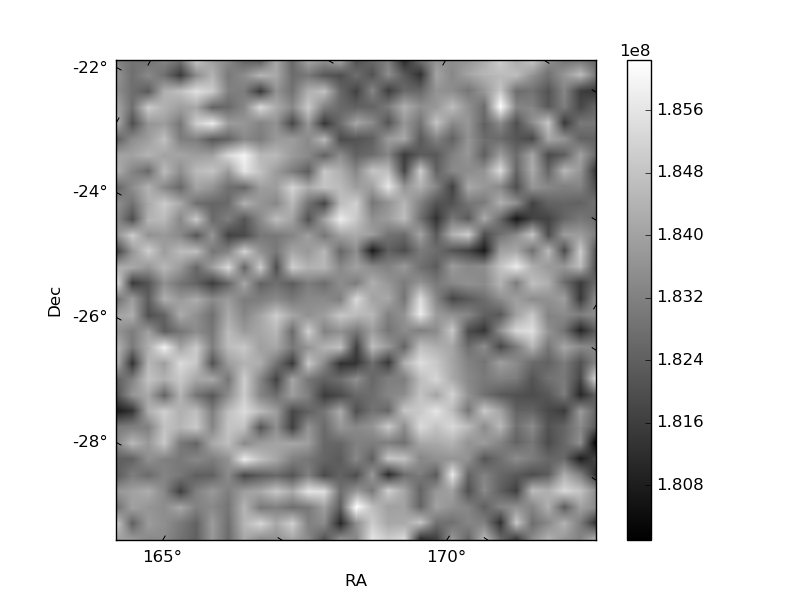 |
| Module-wise count rates for Quadrant C Data is divided into 100 sec bins |
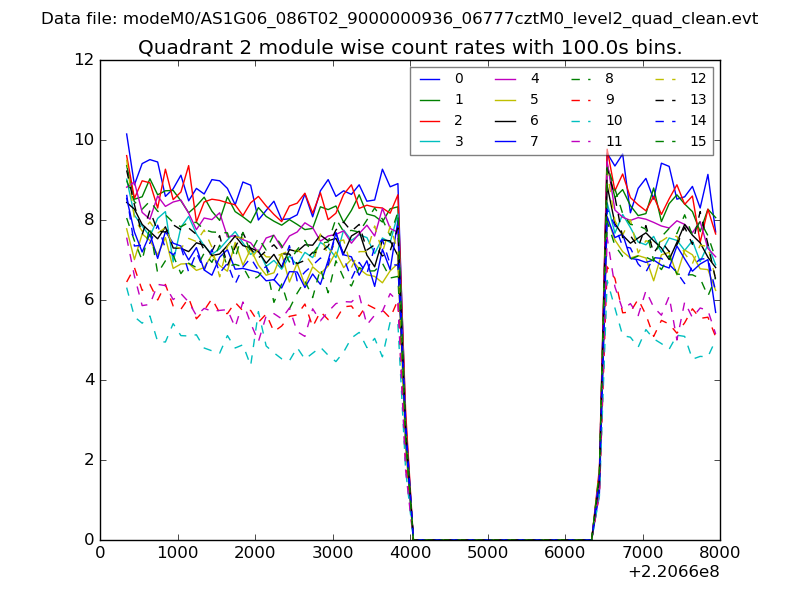 |
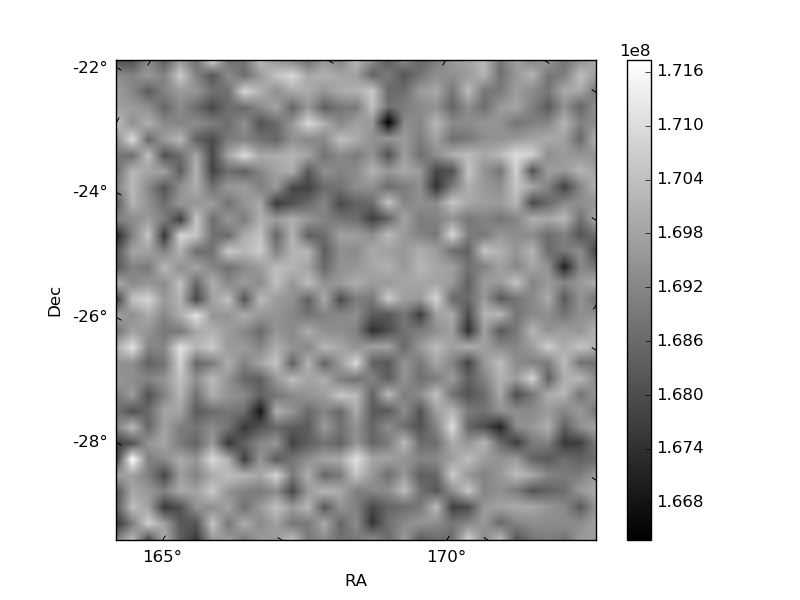 |
| Module-wise count rates for Quadrant D Data is divided into 100 sec bins |
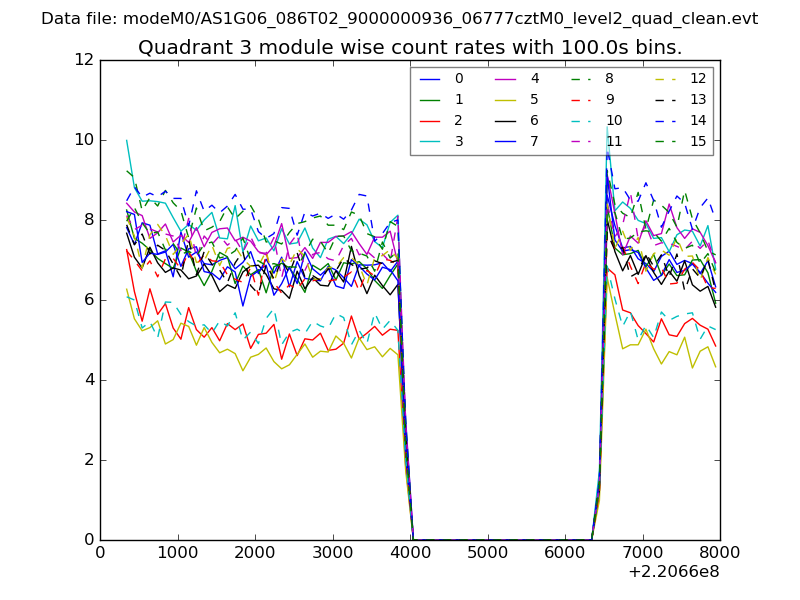 |
 |
| Parameter | Plot |
|---|---|
| CZT HV Monitor | 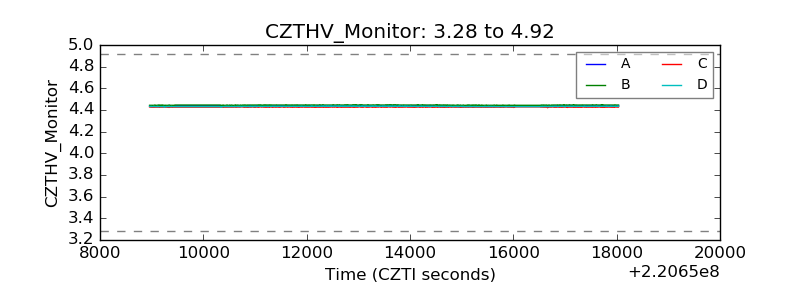 |
| D_VDD | 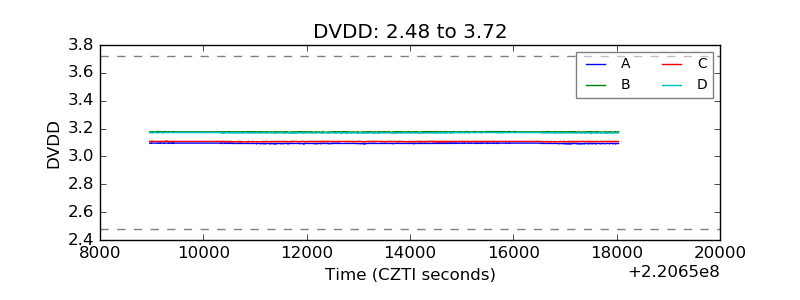 |
| Temperature 1 | 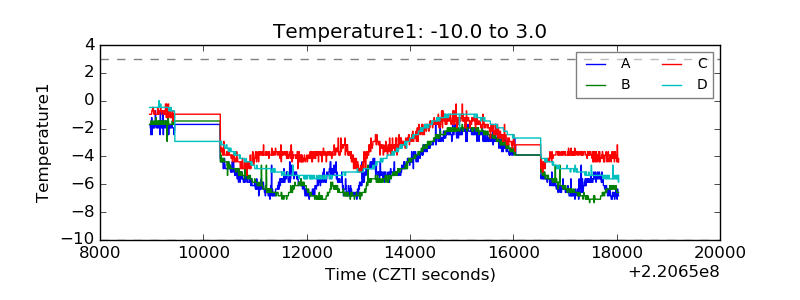 |
| Veto HV Monitor | 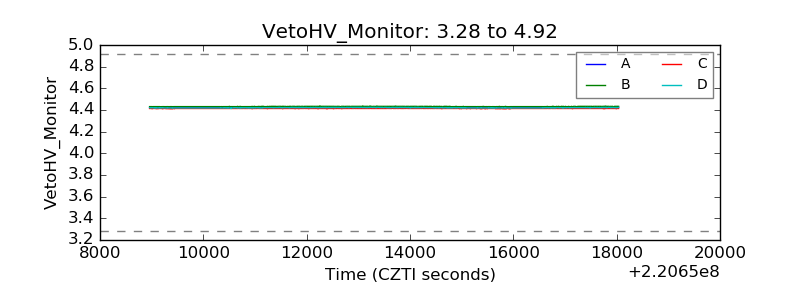 |
| Veto LLD | 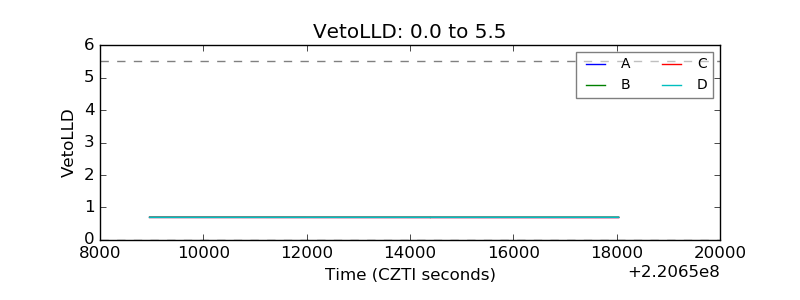 |
| Alpha Counter | 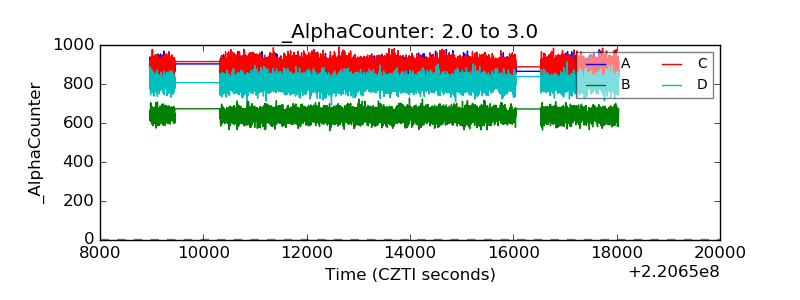 |
| _CPM_Rate | 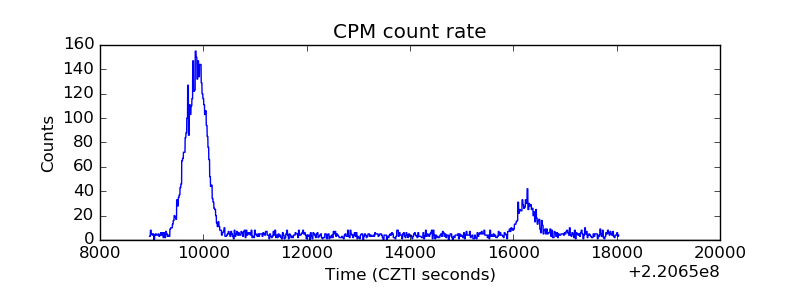 |
| CZT Counter |  |
| +2.5 Volts monitor |  |
| +5 Volts monitor |  |
| _ROLL_ROT | 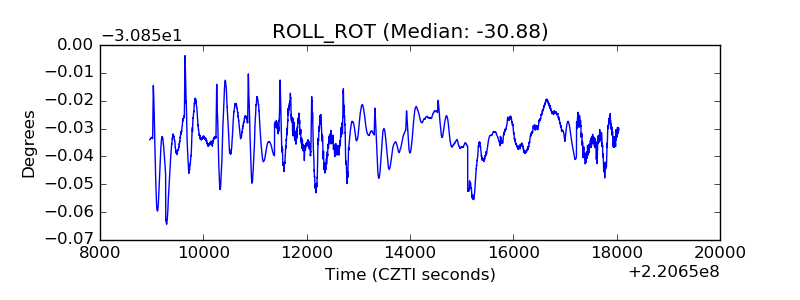 |
| _Roll_DEC | 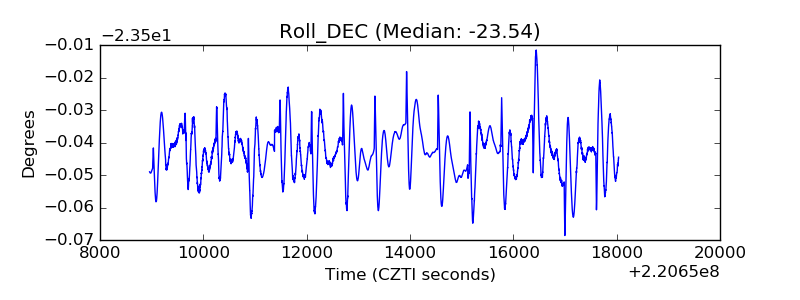 |
| _Roll_RA |  |
| Veto Counter | 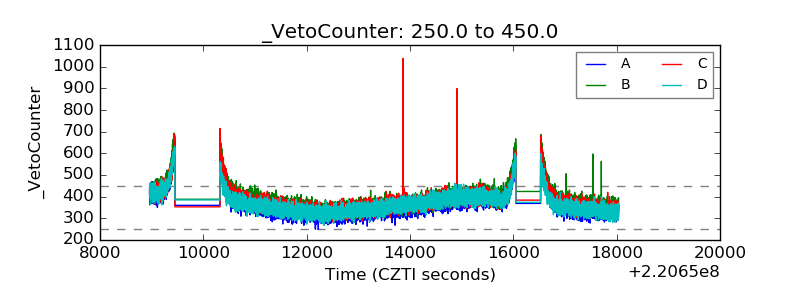 |