| Param | Original file | Final file |
|---|---|---|
| Filename | modeM0/AS1G06_086T02_9000000936_06778cztM0_level2.evt | modeM0/AS1G06_086T02_9000000936_06778cztM0_level2_quad_clean.evt |
| Size (bytes) | 605,669,760 | 105,500,160 |
| Size | 577.6 MB | 100.6 MB |
| Events in quadrant A | 4,635,144 | 654,220 |
| Events in quadrant B | 4,016,208 | 672,561 |
| Events in quadrant C | 3,983,872 | 659,505 |
| Events in quadrant D | 5,137,626 | 624,808 |
| Mode M9 | |||
|---|---|---|---|
| Quadrant | BADHDUFLAG | Total packets | Discarded packets |
| A | 0 | 7 | 0 |
| B | 0 | 7 | 0 |
| C | 0 | 7 | 0 |
| D | 0 | 7 | 0 |
| Mode M0 | |||
|---|---|---|---|
| Quadrant | BADHDUFLAG | Total packets | Discarded packets |
| A | 0 | 19732 | 3 |
| B | 0 | 17773 | 2 |
| C | 0 | 17813 | 2 |
| D | 0 | 21336 | 2 |
| Mode SS | |||
|---|---|---|---|
| Quadrant | BADHDUFLAG | Total packets | Discarded packets |
| A | 0 | 172 | 0 |
| B | 0 | 172 | 0 |
| C | 0 | 172 | 0 |
| D | 0 | 172 | 0 |
| Quadrant | Total seconds | Saturated seconds | Saturation percentage |
|---|---|---|---|
| A | 8412 | 163 | 1.937708% |
| B | 8412 | 81 | 0.962910% |
| C | 8412 | 49 | 0.582501% |
| D | 8412 | 160 | 1.902045% |
Noise dominated data is calculated using 1-second bins in cleaned event files. If a bin has >2000 counts, and if more than 50% of those come from <1% of pixels, then it is considered to be noise-dominated and hence unusable.
| Quadrant | # 1 sec bins | Bins with >0 counts | Bins with >2000 counts | High rate bins dominated by noise | Noise dominated (total time) | Noise dominated (detector-on time) | Marked lightcurve |
|---|---|---|---|---|---|---|---|
| A | 9032 | 8415 | 161 | 161 | 1.78% | 1.91% | 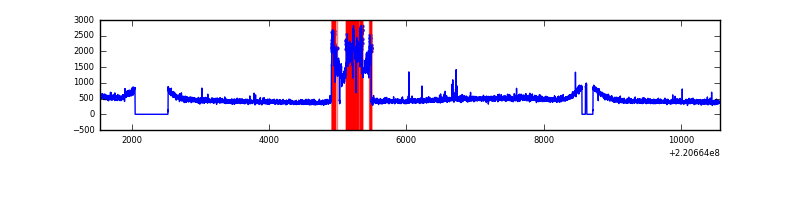 |
| B | 9032 | 8415 | 3 | 3 | 0.03% | 0.04% | 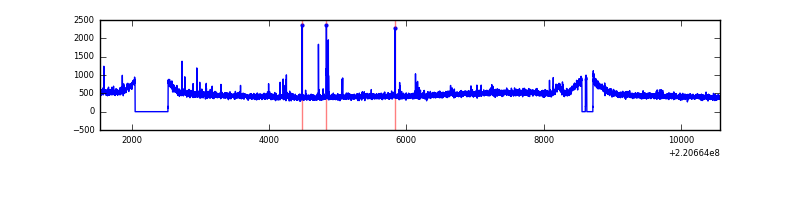 |
| C | 9032 | 8415 | 11 | 11 | 0.12% | 0.13% | 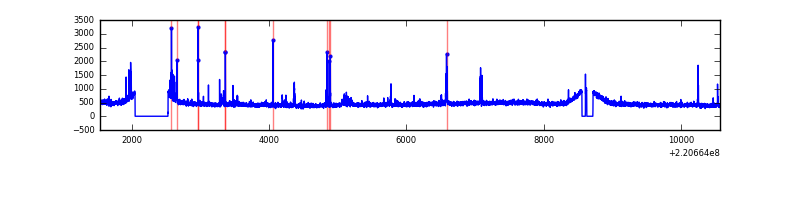 |
| D | 9032 | 8415 | 70 | 70 | 0.78% | 0.83% | 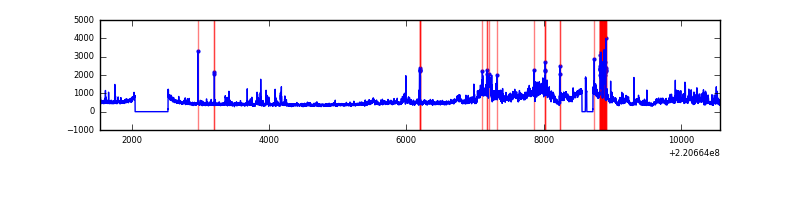 |
Top three noisy pixels from each quadrant. If the there are fewer than three noisy pixels in the level2.evt file, extra rows are filled as -1
| Pixel properties | Quadrant properties | ||||||
|---|---|---|---|---|---|---|---|
| Quadrant | DetID | PixID | Counts | Sigma | Mean | Median | Sigma |
| A | 13 | 170 | 792358 | 3867.35 | 990 | 966 | 204.6 |
| A | 0 | 23 | 20500 | 95.46 | 990 | 966 | 204.6 |
| A | 13 | 248 | 13822 | 62.82 | 990 | 966 | 204.6 |
| B | 4 | 48 | 53799 | 267.85 | 1007 | 982 | 197.2 |
| B | 0 | 214 | 41331 | 204.62 | 1007 | 982 | 197.2 |
| B | 4 | 81 | 20156 | 97.24 | 1007 | 982 | 197.2 |
| C | 9 | 247 | 167856 | 732.18 | 971 | 976 | 227.9 |
| C | 12 | 4 | 9994 | 39.57 | 971 | 976 | 227.9 |
| C | 4 | 254 | 9859 | 38.97 | 971 | 976 | 227.9 |
| D | 8 | 195 | 1022540 | 4299.11 | 957 | 927 | 237.6 |
| D | 2 | 152 | 182866 | 765.63 | 957 | 927 | 237.6 |
| D | 2 | 63 | 173901 | 727.9 | 957 | 927 | 237.6 |
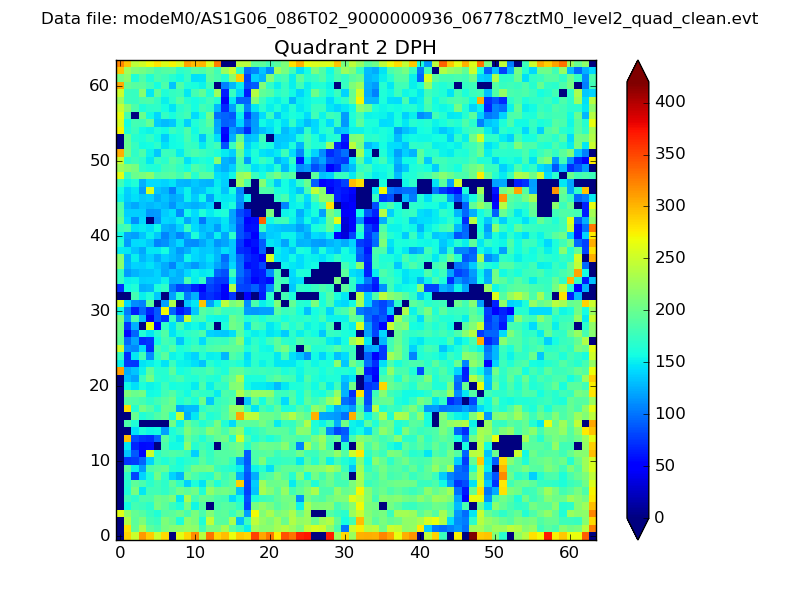
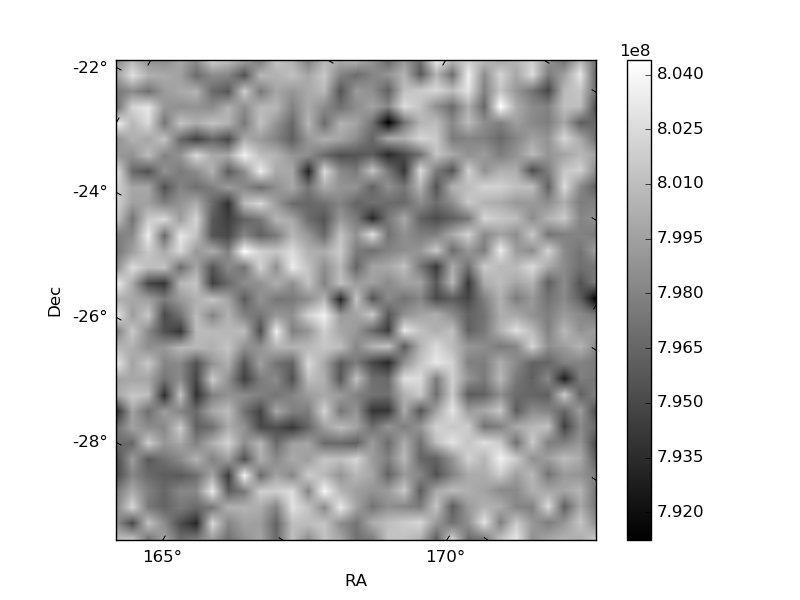
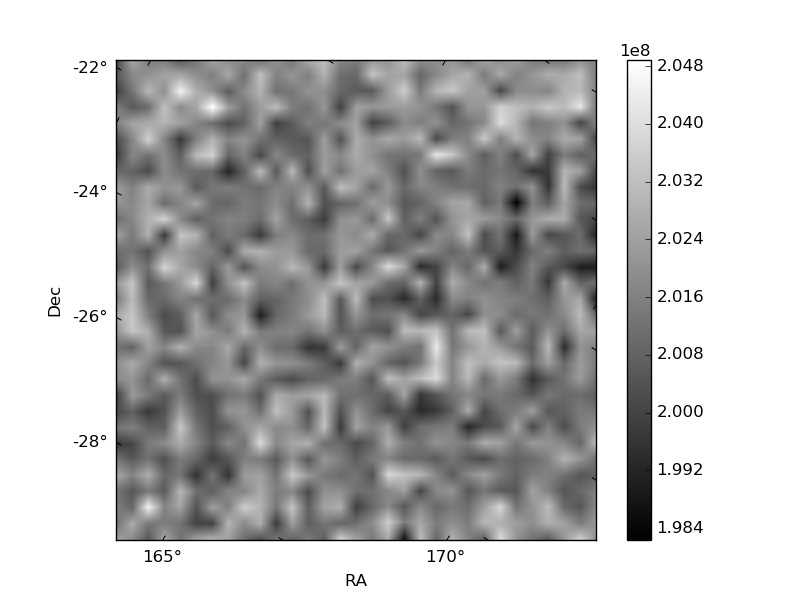
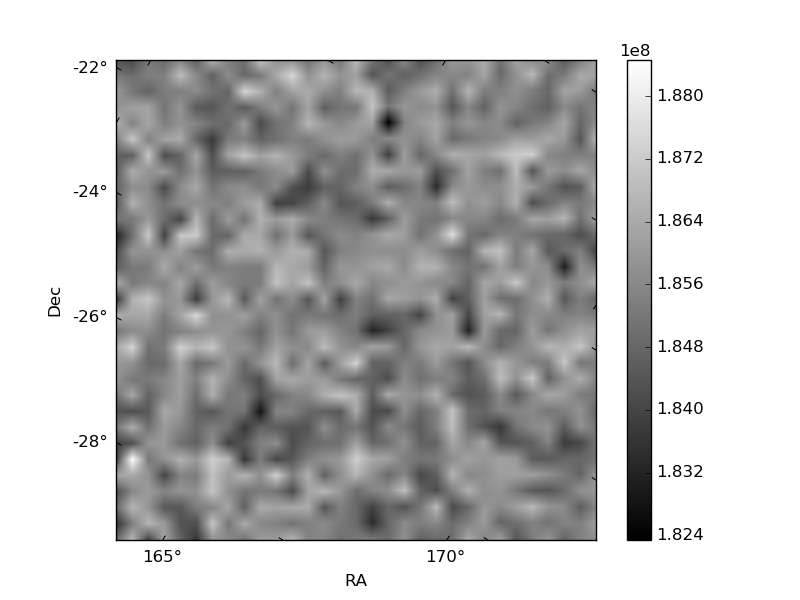
Histogram calculated using DETX and DETY for each event in the final _common_clean file
| Quadrant A | 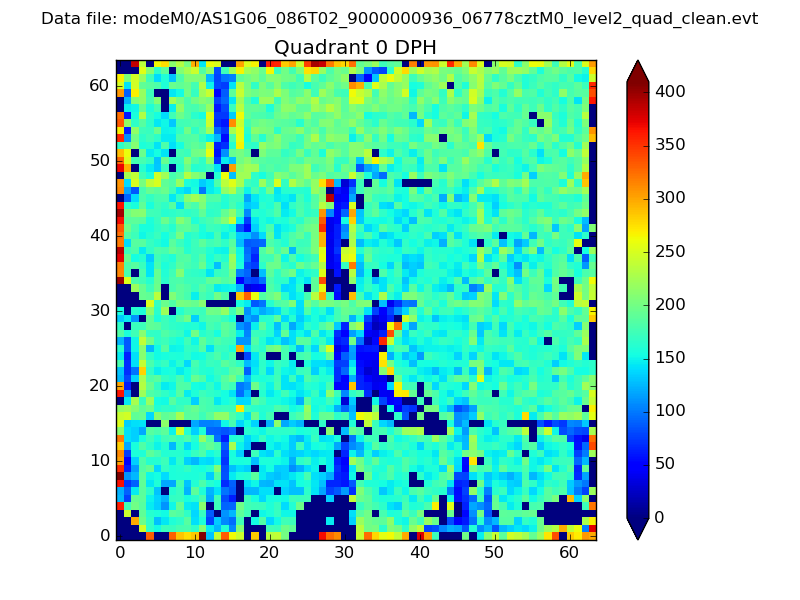 |
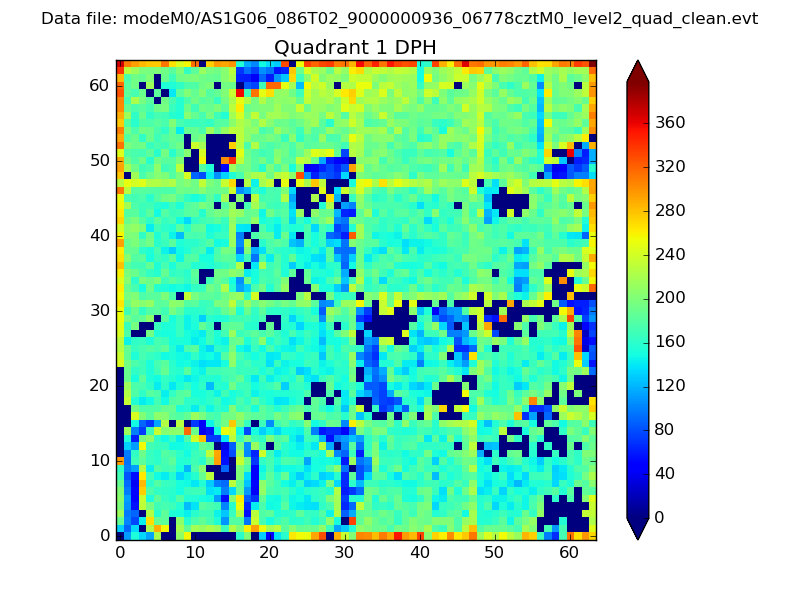 |
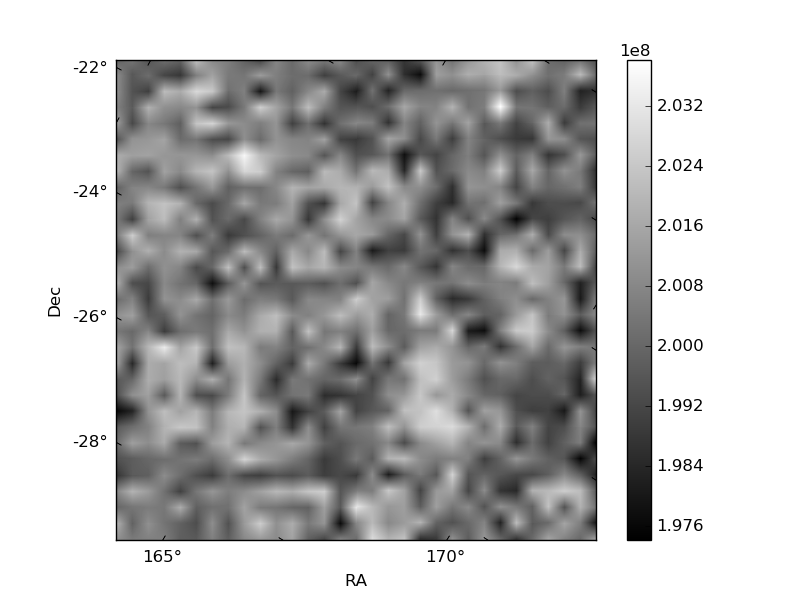
Quadrant B |
|---|---|---|---|
| Quadrant D | 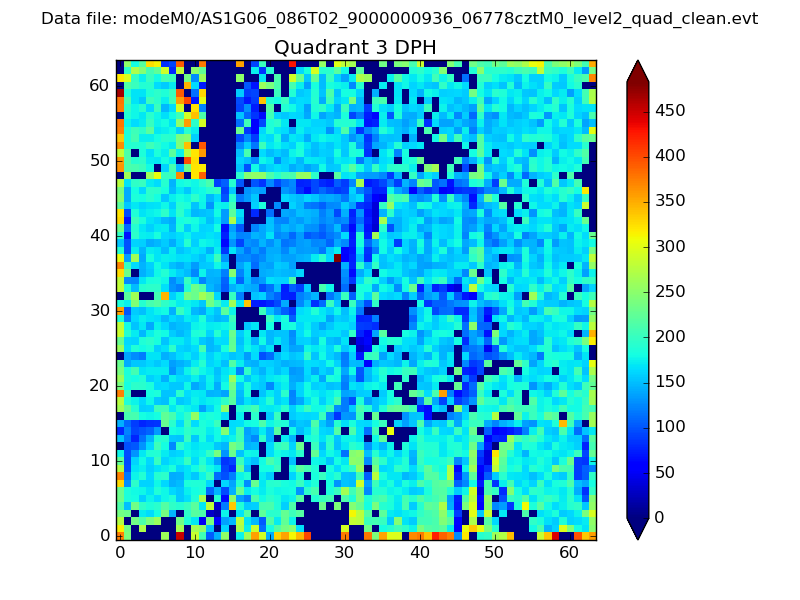 |
 |
Quadrant C |
| Plot type | Count rate plots | Images |
|---|---|---|
| Comparison with Poisson distribution Blue bars denote a histogram of data divided into 1 sec bins. Red curve is a Poisson curve with rate = median count rate of data. |
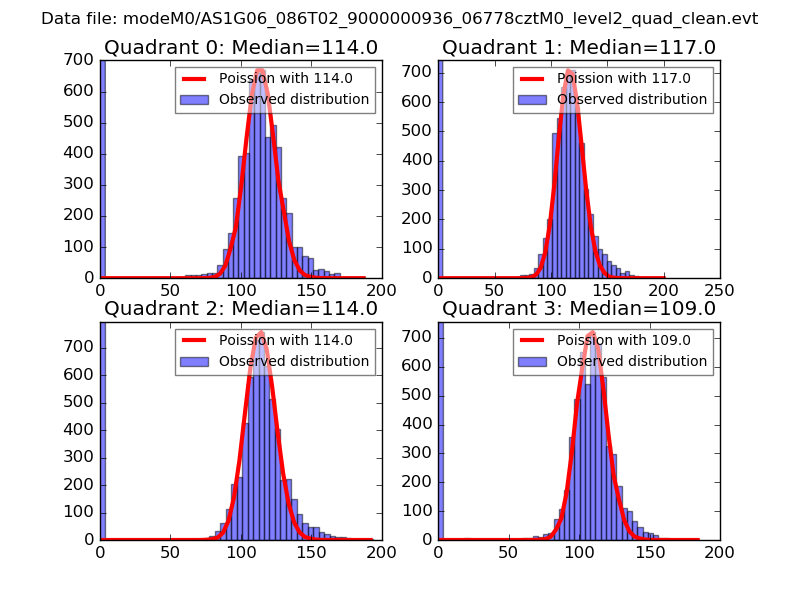 |
 |
| Quadrant-wise count rates Data is divided into 100 sec bins |
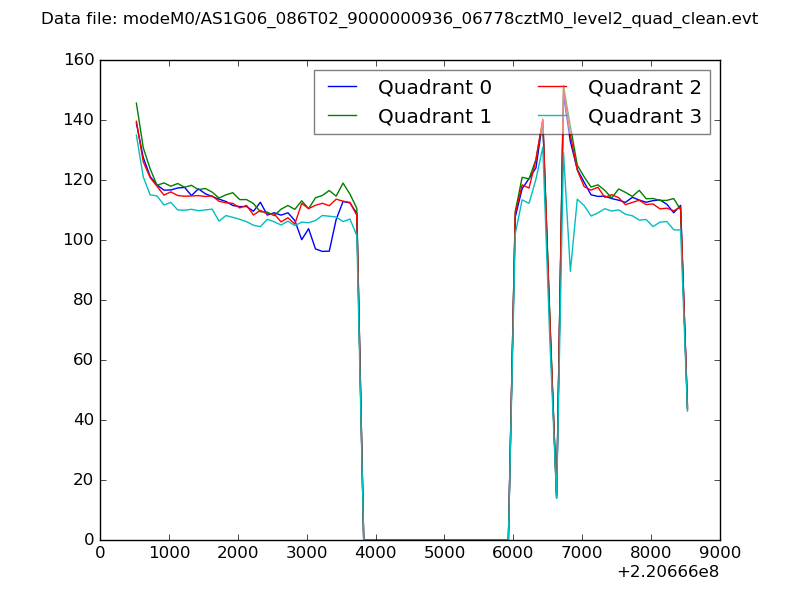 |
|
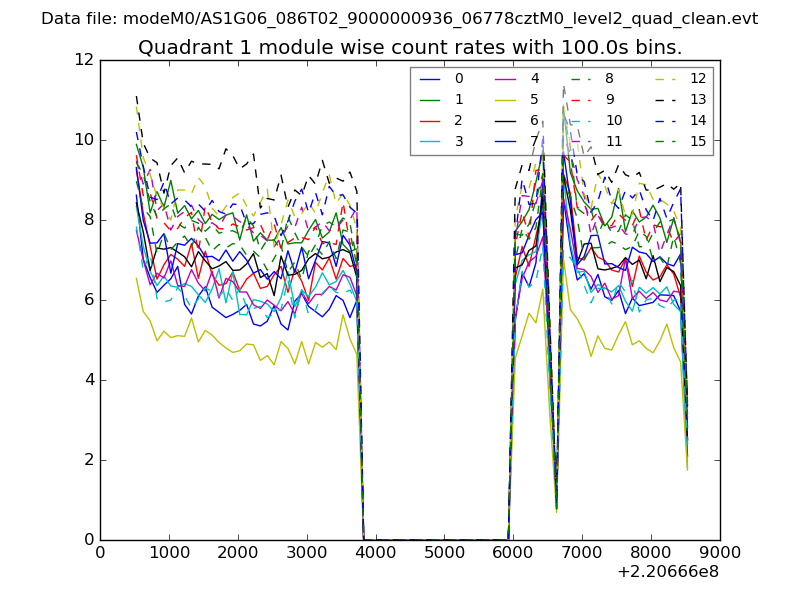
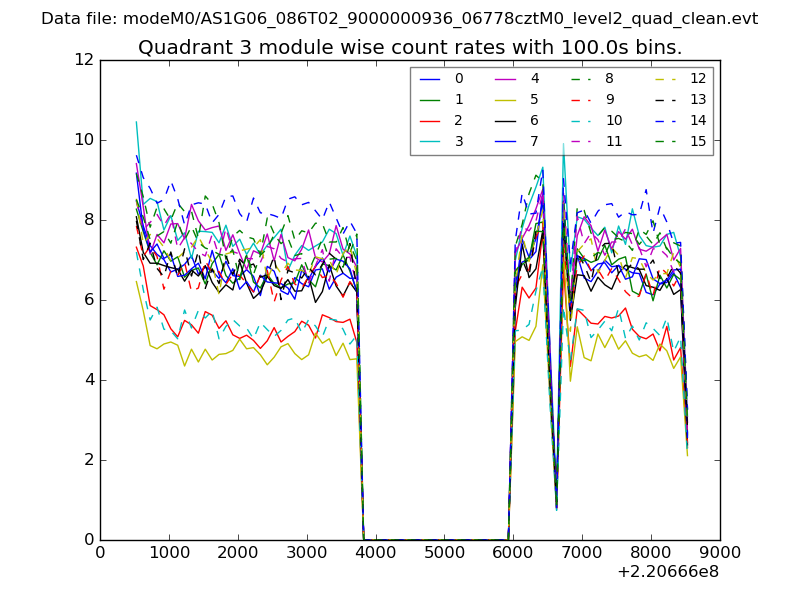
| Module-wise count rates for Quadrant A Data is divided into 100 sec bins |
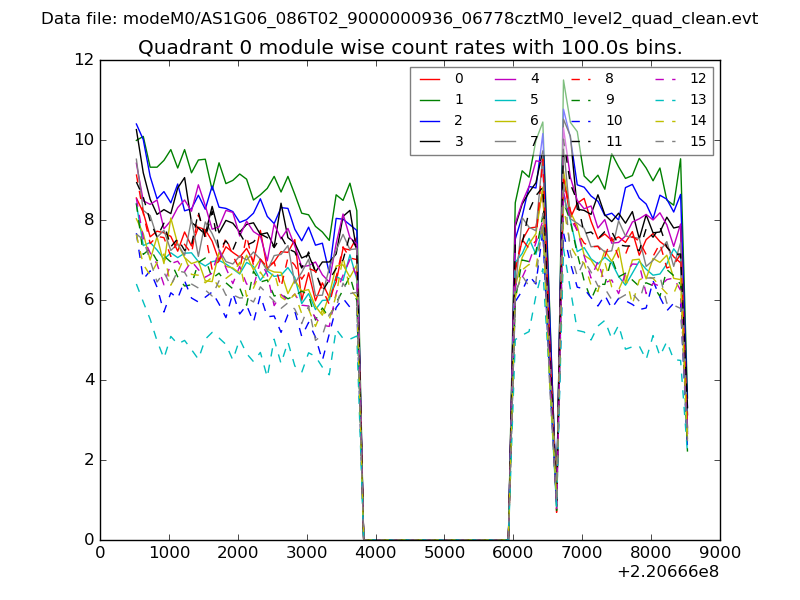 |
 |
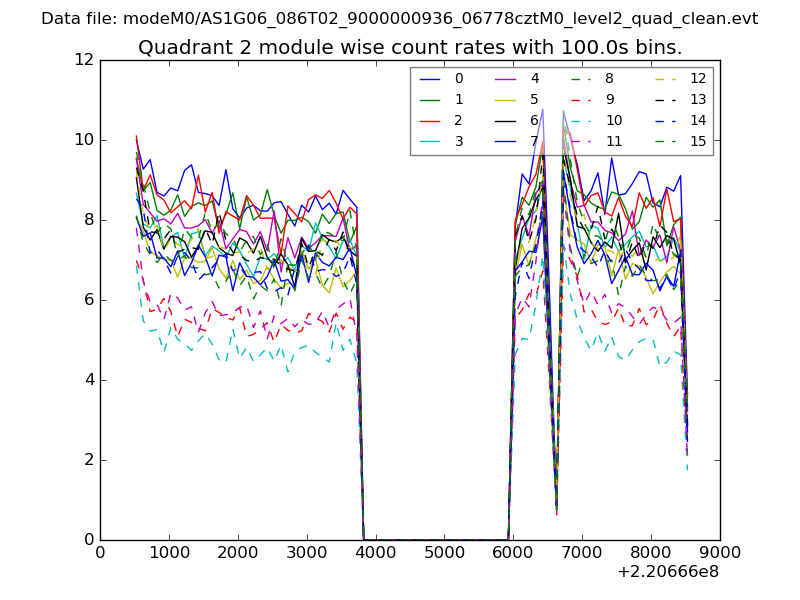
| Module-wise count rates for Quadrant B Data is divided into 100 sec bins |
 |
 |
| Module-wise count rates for Quadrant C Data is divided into 100 sec bins |
 |
 |
| Module-wise count rates for Quadrant D Data is divided into 100 sec bins |
 |
 |
| Parameter | Plot |
|---|---|
| CZT HV Monitor | 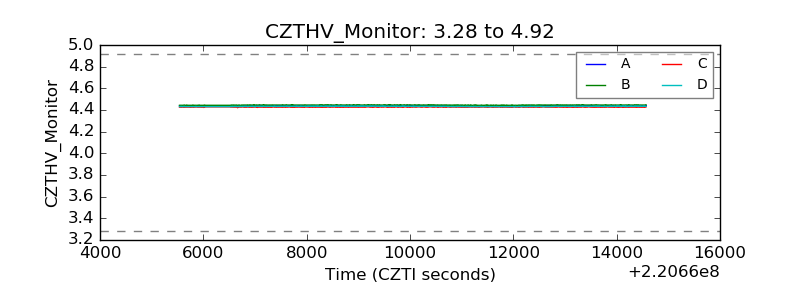 |
| D_VDD | 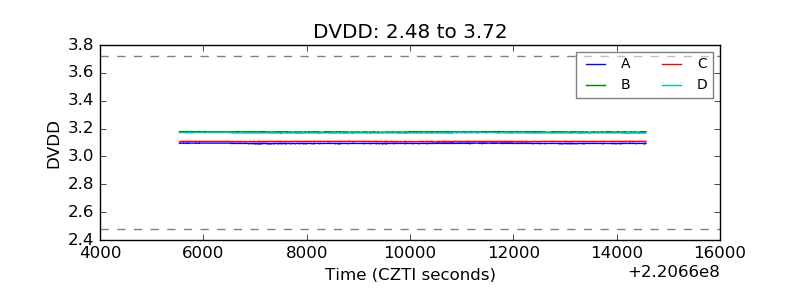 |
| Temperature 1 | 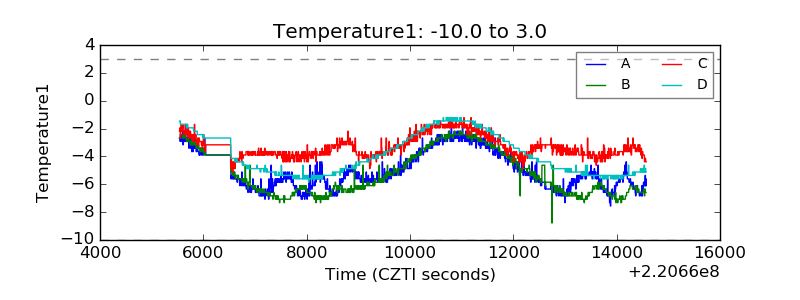 |
| Veto HV Monitor | 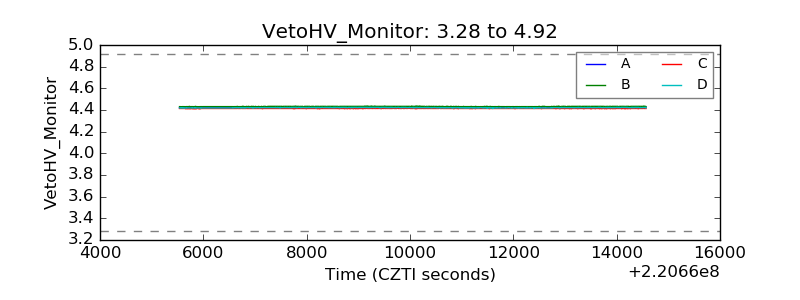 |
| Veto LLD | 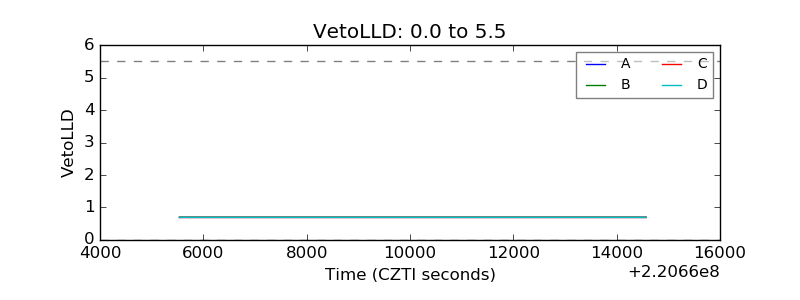 |
| Alpha Counter | 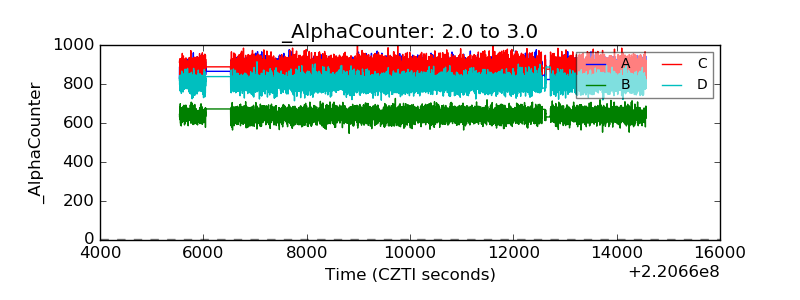 |
| _CPM_Rate | 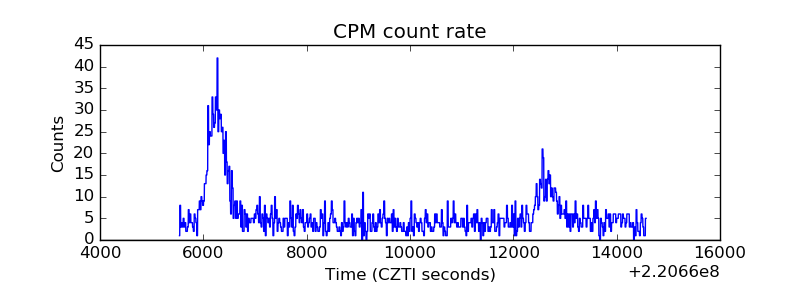 |
| CZT Counter | 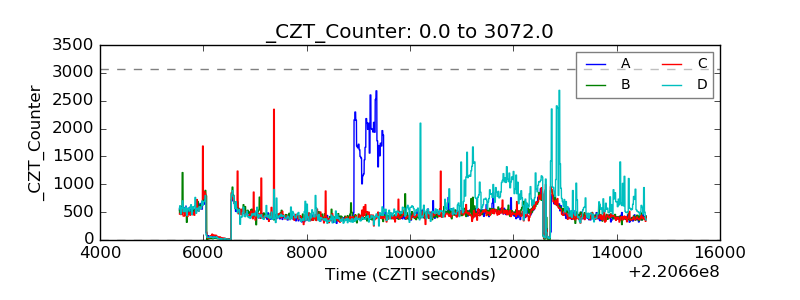 |
| +2.5 Volts monitor |  |
| +5 Volts monitor |  |
| _ROLL_ROT | 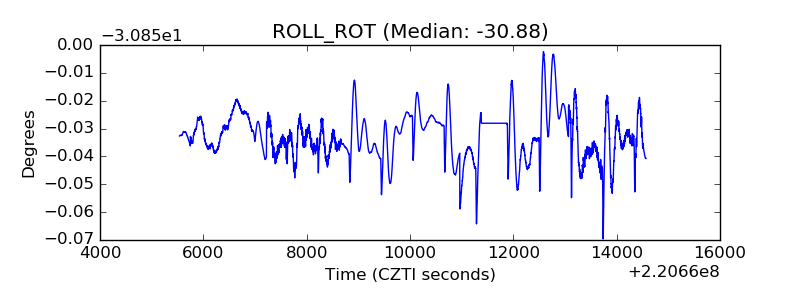 |
| _Roll_DEC | 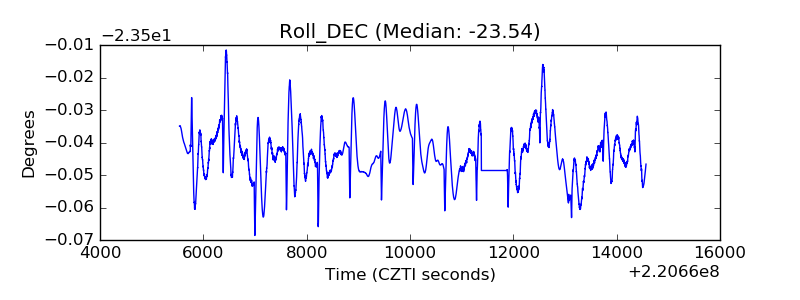 |
| _Roll_RA | 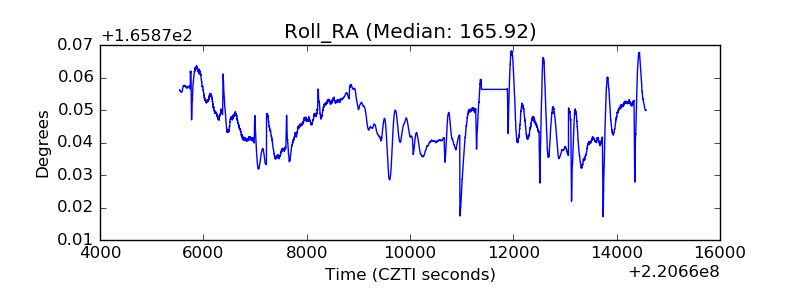 |
| Veto Counter | 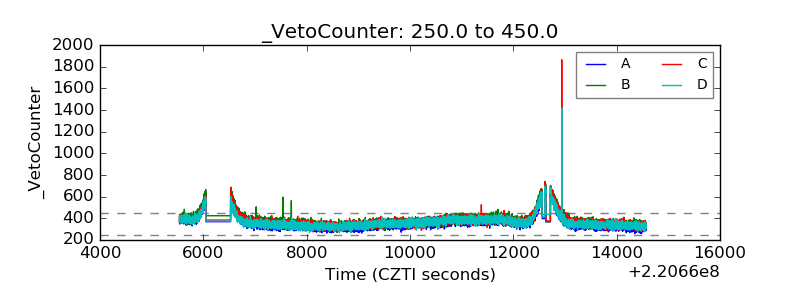 |