| Param | Original file | Final file |
|---|---|---|
| Filename | modeM0/AS1G06_086T02_9000000936_06779cztM0_level2.evt | modeM0/AS1G06_086T02_9000000936_06779cztM0_level2_quad_clean.evt |
| Size (bytes) | 589,775,040 | 115,234,560 |
| Size | 562.5 MB | 109.9 MB |
| Events in quadrant A | 3,929,715 | 728,765 |
| Events in quadrant B | 4,032,061 | 744,885 |
| Events in quadrant C | 4,129,042 | 727,660 |
| Events in quadrant D | 5,186,661 | 690,959 |
| Mode M9 | |||
|---|---|---|---|
| Quadrant | BADHDUFLAG | Total packets | Discarded packets |
| A | 0 | 5 | 0 |
| B | 0 | 5 | 0 |
| C | 0 | 5 | 0 |
| D | 0 | 5 | 0 |
| Mode M0 | |||
|---|---|---|---|
| Quadrant | BADHDUFLAG | Total packets | Discarded packets |
| A | 0 | 17835 | 3 |
| B | 0 | 17989 | 2 |
| C | 0 | 18448 | 2 |
| D | 0 | 21487 | 2 |
| Mode SS | |||
|---|---|---|---|
| Quadrant | BADHDUFLAG | Total packets | Discarded packets |
| A | 0 | 180 | 0 |
| B | 0 | 180 | 0 |
| C | 0 | 180 | 0 |
| D | 0 | 180 | 0 |
| Quadrant | Total seconds | Saturated seconds | Saturation percentage |
|---|---|---|---|
| A | 8606 | 84 | 0.976063% |
| B | 8606 | 116 | 1.347897% |
| C | 8606 | 93 | 1.080641% |
| D | 8606 | 169 | 1.963746% |
Noise dominated data is calculated using 1-second bins in cleaned event files. If a bin has >2000 counts, and if more than 50% of those come from <1% of pixels, then it is considered to be noise-dominated and hence unusable.
| Quadrant | # 1 sec bins | Bins with >0 counts | Bins with >2000 counts | High rate bins dominated by noise | Noise dominated (total time) | Noise dominated (detector-on time) | Marked lightcurve |
|---|---|---|---|---|---|---|---|
| A | 9016 | 8610 | 3 | 3 | 0.03% | 0.03% | 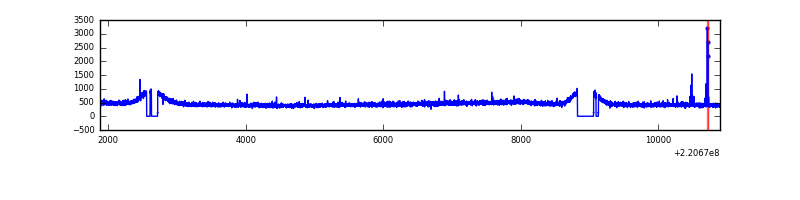 |
| B | 9016 | 8610 | 0 | 0 | 0.00% | 0.00% | 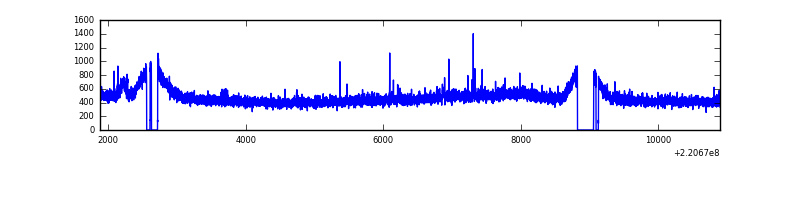 |
| C | 9016 | 8610 | 13 | 13 | 0.14% | 0.15% | 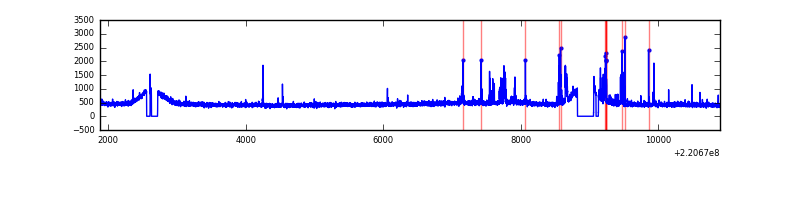 |
| D | 9016 | 8610 | 72 | 72 | 0.80% | 0.84% | 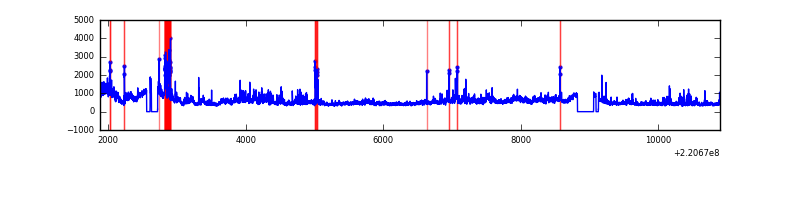 |
Top three noisy pixels from each quadrant. If the there are fewer than three noisy pixels in the level2.evt file, extra rows are filled as -1
| Pixel properties | Quadrant properties | ||||||
|---|---|---|---|---|---|---|---|
| Quadrant | DetID | PixID | Counts | Sigma | Mean | Median | Sigma |
| A | 13 | 248 | 21224 | 96.26 | 1014 | 991 | 210.2 |
| A | 0 | 226 | 10033 | 43.02 | 1014 | 991 | 210.2 |
| A | 12 | 194 | 9404 | 40.03 | 1014 | 991 | 210.2 |
| B | 0 | 214 | 27323 | 131.4 | 1026 | 1000 | 200.3 |
| B | 4 | 81 | 25985 | 124.72 | 1026 | 1000 | 200.3 |
| B | 12 | 111 | 20845 | 99.06 | 1026 | 1000 | 200.3 |
| C | 9 | 247 | 191990 | 815.7 | 995 | 998 | 234.1 |
| C | 12 | 16 | 35690 | 148.17 | 995 | 998 | 234.1 |
| C | 4 | 254 | 9873 | 37.9 | 995 | 998 | 234.1 |
| D | 8 | 195 | 1013225 | 4169.09 | 980 | 945 | 242.8 |
| D | 2 | 152 | 215843 | 885.06 | 980 | 945 | 242.8 |
| D | 2 | 63 | 161575 | 661.56 | 980 | 945 | 242.8 |
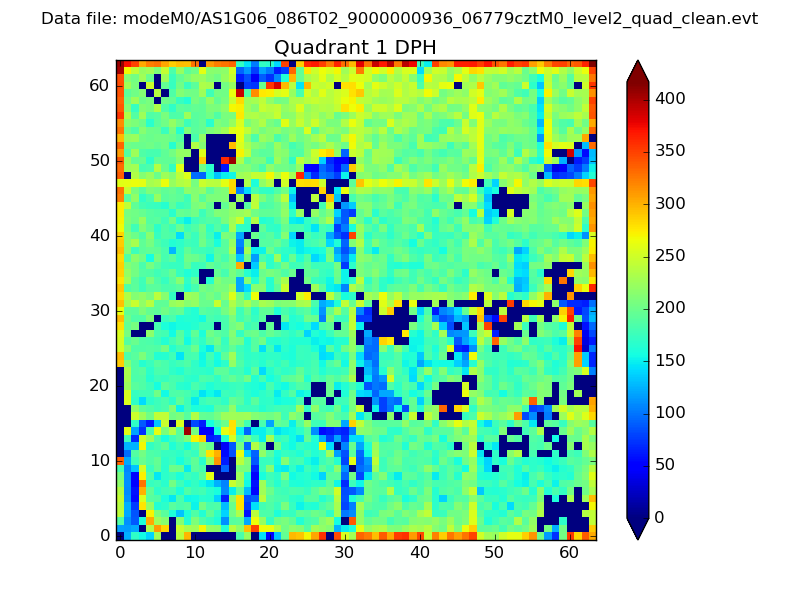
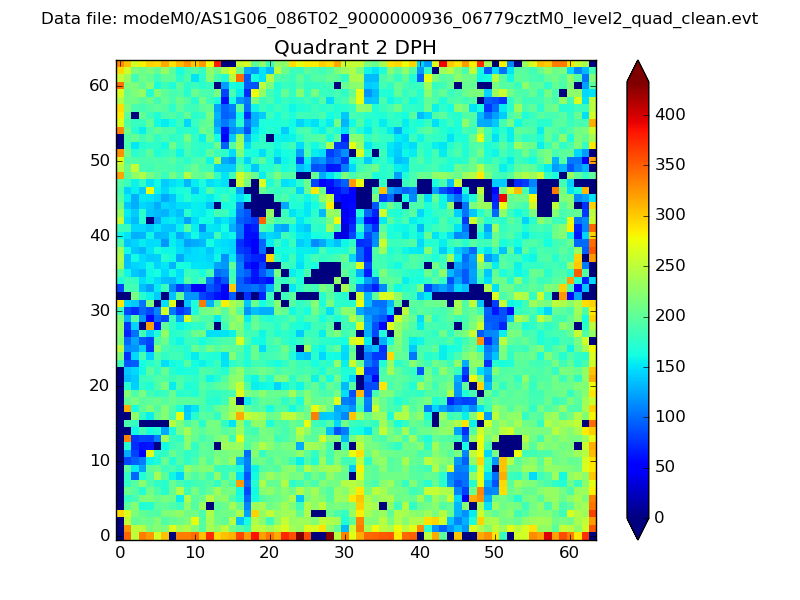
Histogram calculated using DETX and DETY for each event in the final _common_clean file
| Quadrant A |  |
 |
Quadrant B |
|---|---|---|---|
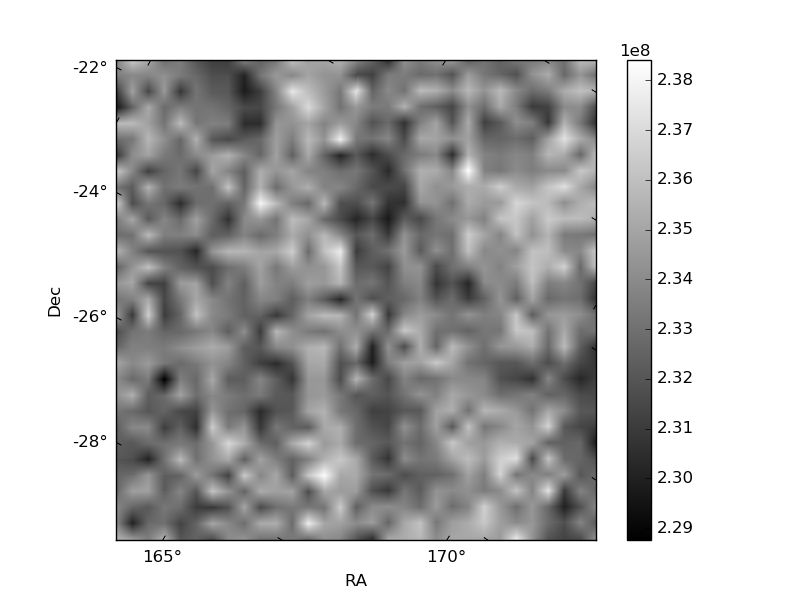
| Quadrant D |  |
 |
Quadrant C |
| Plot type | Count rate plots | Images |
|---|---|---|
| Comparison with Poisson distribution Blue bars denote a histogram of data divided into 1 sec bins. Red curve is a Poisson curve with rate = median count rate of data. |
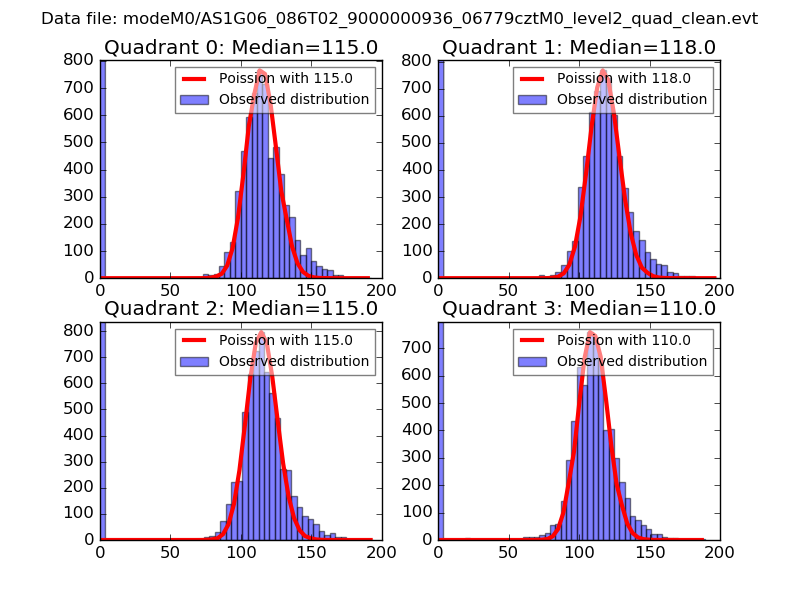 |
 |
| Quadrant-wise count rates Data is divided into 100 sec bins |
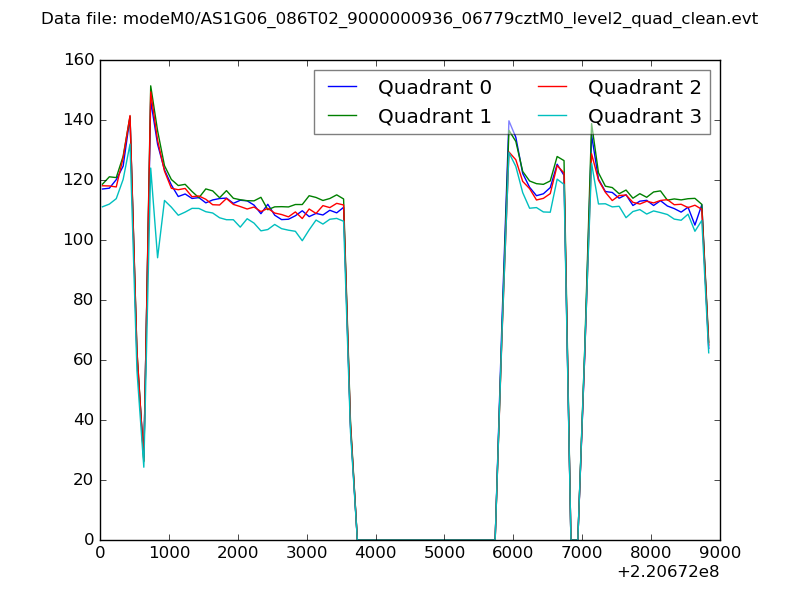 |
|
| Module-wise count rates for Quadrant A Data is divided into 100 sec bins |
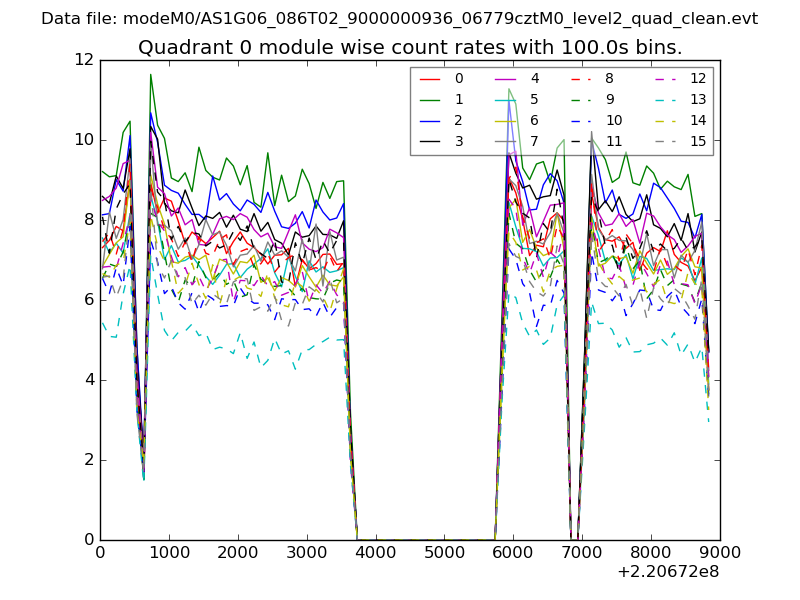 |
 |
| Module-wise count rates for Quadrant B Data is divided into 100 sec bins |
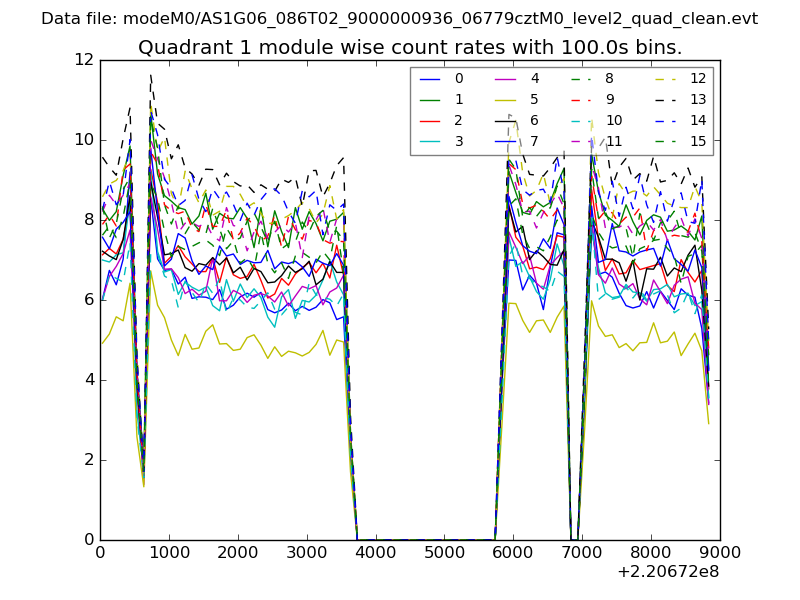 |
 |
| Module-wise count rates for Quadrant C Data is divided into 100 sec bins |
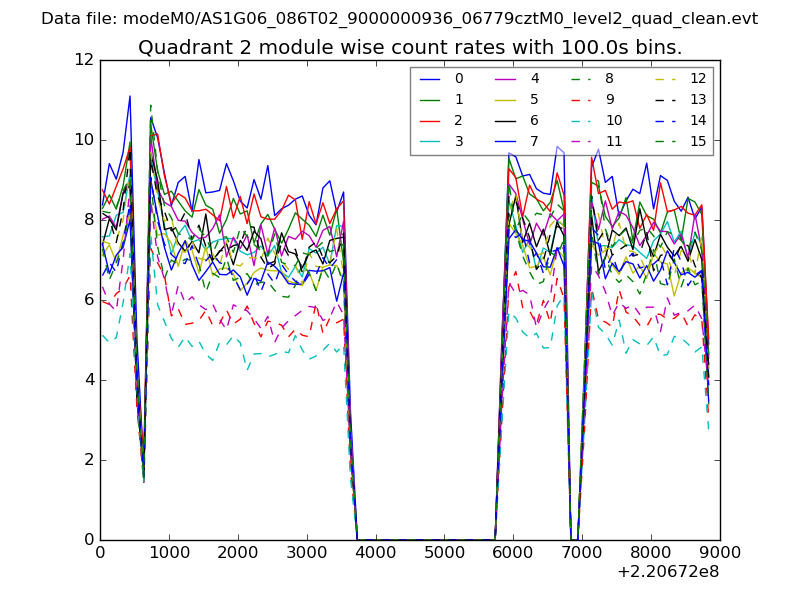 |
 |
| Module-wise count rates for Quadrant D Data is divided into 100 sec bins |
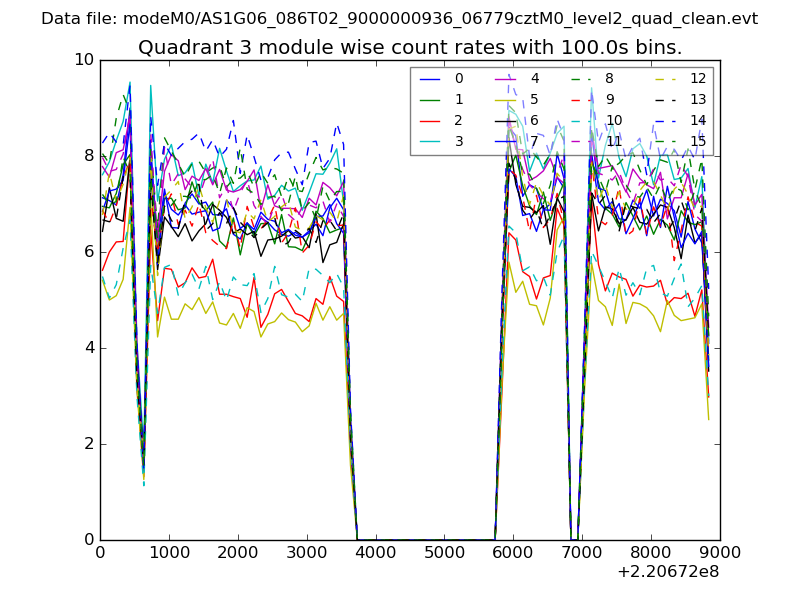 |
 |
| Parameter | Plot |
|---|---|
| CZT HV Monitor | 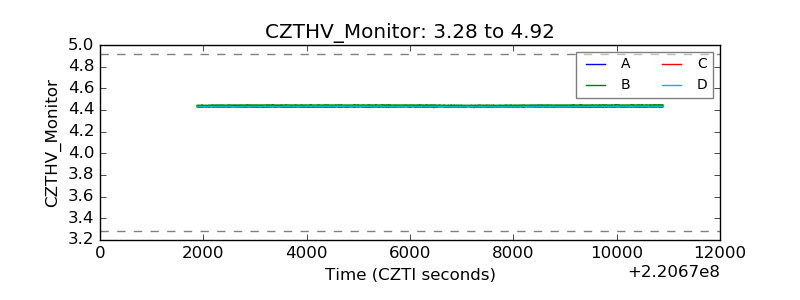 |
| D_VDD | 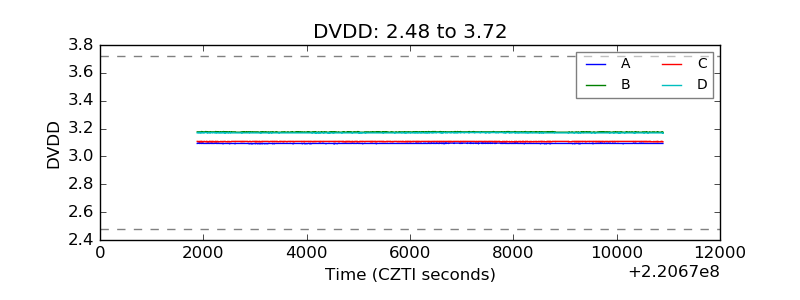 |
| Temperature 1 | 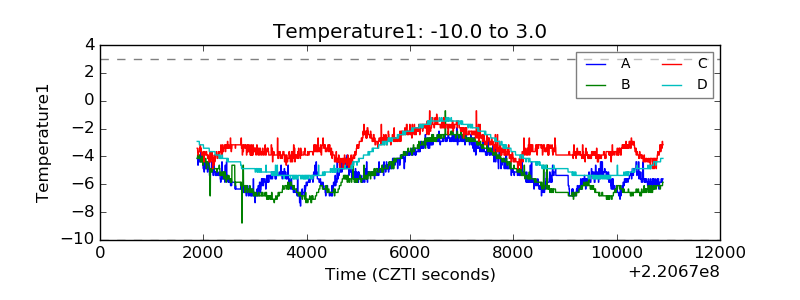 |
| Veto HV Monitor | 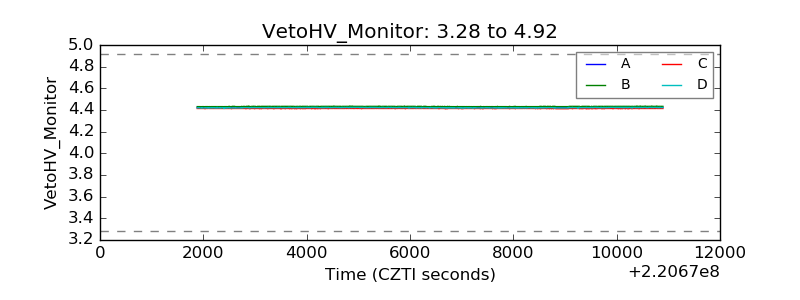 |
| Veto LLD | 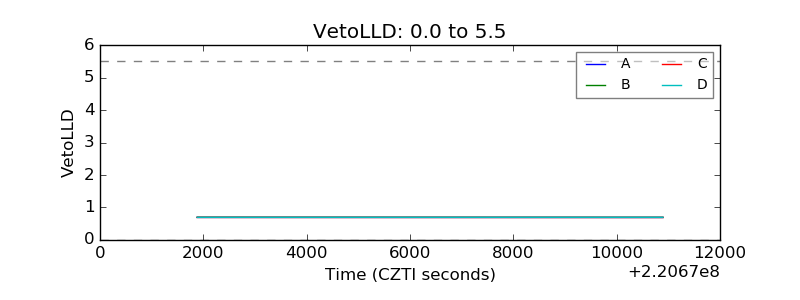 |
| Alpha Counter | 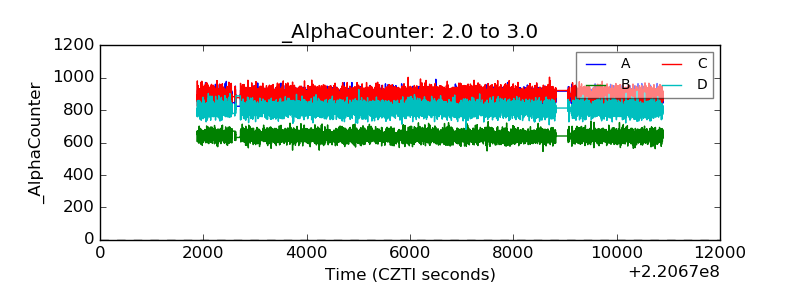 |
| _CPM_Rate | 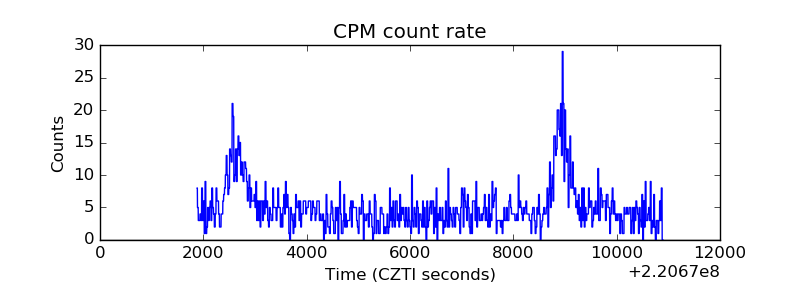 |
| CZT Counter | 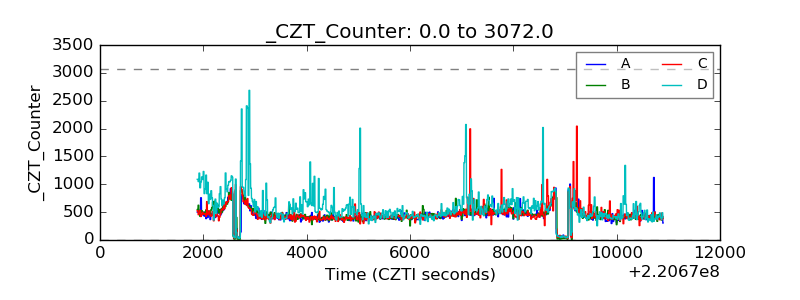 |
| +2.5 Volts monitor |  |
| +5 Volts monitor |  |
| _ROLL_ROT | 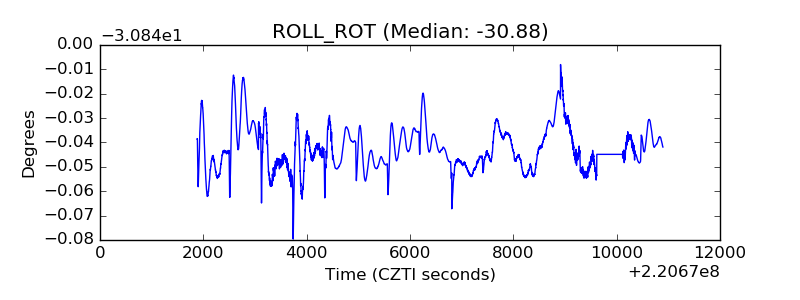 |
| _Roll_DEC | 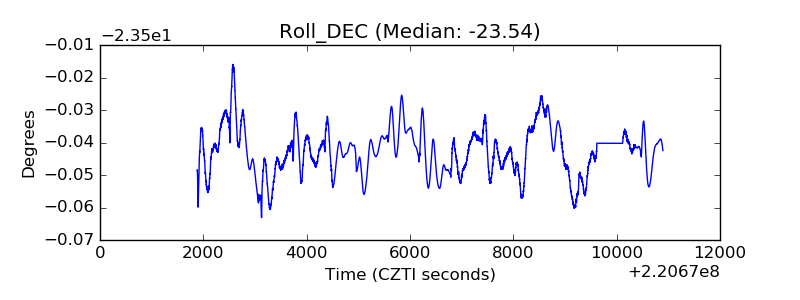 |
| _Roll_RA |  |
| Veto Counter | 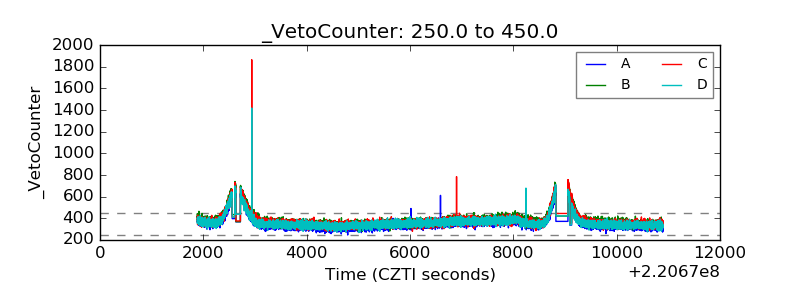 |