| Param | Original file | Final file |
|---|---|---|
| Filename | modeM0/AS1G06_086T02_9000000936_06783cztM0_level2.evt | modeM0/AS1G06_086T02_9000000936_06783cztM0_level2_quad_clean.evt |
| Size (bytes) | 1,595,666,880 | 224,164,800 |
| Size | 1.5 GB | 213.8 MB |
| Events in quadrant A | 9,109,267 | 1,374,977 |
| Events in quadrant B | 9,360,226 | 1,400,023 |
| Events in quadrant C | 9,738,403 | 1,363,725 |
| Events in quadrant D | 18,735,152 | 1,240,742 |
| Mode M9 | |||
|---|---|---|---|
| Quadrant | BADHDUFLAG | Total packets | Discarded packets |
| A | 0 | 29 | 8 |
| B | 0 | 29 | 8 |
| C | 0 | 29 | 5 |
| D | 0 | 29 | 7 |
| Mode M0 | |||
|---|---|---|---|
| Quadrant | BADHDUFLAG | Total packets | Discarded packets |
| A | 0 | 46034 | 4607 |
| B | 0 | 46199 | 4528 |
| C | 0 | 47604 | 4586 |
| D | 0 | 77007 | 7514 |
| Mode SS | |||
|---|---|---|---|
| Quadrant | BADHDUFLAG | Total packets | Discarded packets |
| A | 0 | 460 | 44 |
| B | 0 | 460 | 40 |
| C | 0 | 459 | 37 |
| D | 0 | 462 | 44 |
| Quadrant | Total seconds | Saturated seconds | Saturation percentage |
|---|---|---|---|
| A | 20442 | 131 | 0.640837% |
| B | 20480 | 129 | 0.629883% |
| C | 20459 | 275 | 1.344152% |
| D | 20360 | 2624 | 12.888016% |
Noise dominated data is calculated using 1-second bins in cleaned event files. If a bin has >2000 counts, and if more than 50% of those come from <1% of pixels, then it is considered to be noise-dominated and hence unusable.
| Quadrant | # 1 sec bins | Bins with >0 counts | Bins with >2000 counts | High rate bins dominated by noise | Noise dominated (total time) | Noise dominated (detector-on time) | Marked lightcurve |
|---|---|---|---|---|---|---|---|
| A | 25632 | 20909 | 3 | 3 | 0.01% | 0.01% | 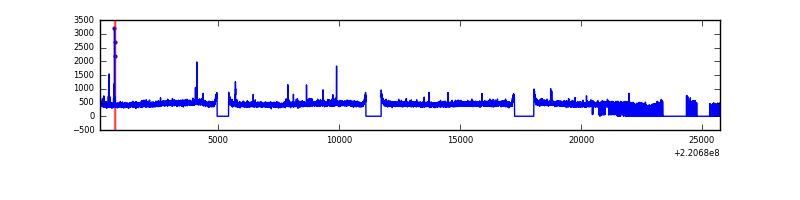 |
| B | 25632 | 20951 | 1 | 1 | 0.00% | 0.00% | 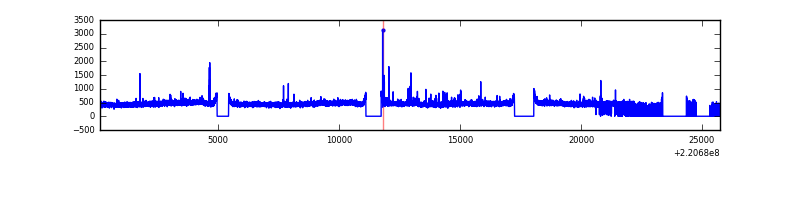 |
| C | 25634 | 20906 | 118 | 118 | 0.46% | 0.56% | 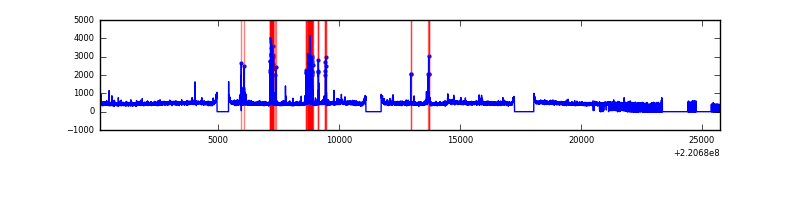 |
| D | 25606 | 20765 | 2293 | 2293 | 8.95% | 11.04% | 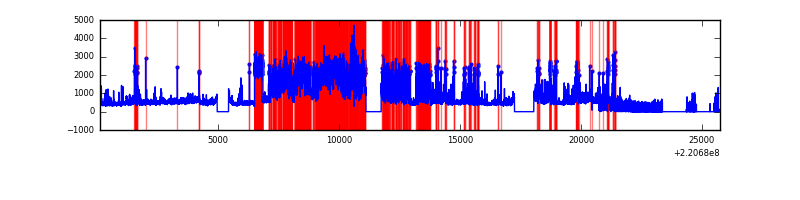 |
Top three noisy pixels from each quadrant. If the there are fewer than three noisy pixels in the level2.evt file, extra rows are filled as -1
| Pixel properties | Quadrant properties | ||||||
|---|---|---|---|---|---|---|---|
| Quadrant | DetID | PixID | Counts | Sigma | Mean | Median | Sigma |
| A | 13 | 248 | 44260 | 87.63 | 2348 | 2294 | 478.9 |
| A | 0 | 226 | 23379 | 44.03 | 2348 | 2294 | 478.9 |
| A | 12 | 194 | 22295 | 41.77 | 2348 | 2294 | 478.9 |
| B | 4 | 81 | 64582 | 136.39 | 2368 | 2310 | 456.6 |
| B | 3 | 220 | 49946 | 104.33 | 2368 | 2310 | 456.6 |
| B | 12 | 111 | 47351 | 98.65 | 2368 | 2310 | 456.6 |
| C | 9 | 247 | 712703 | 1344.07 | 2287 | 2299 | 528.5 |
| C | 12 | 16 | 42980 | 76.97 | 2287 | 2299 | 528.5 |
| C | 8 | 128 | 18027 | 29.76 | 2287 | 2299 | 528.5 |
| D | 2 | 63 | 7795841 | 14454.87 | 2194 | 2123 | 539.2 |
| D | 8 | 195 | 1329684 | 2462.2 | 2194 | 2123 | 539.2 |
| D | 2 | 152 | 961025 | 1778.46 | 2194 | 2123 | 539.2 |
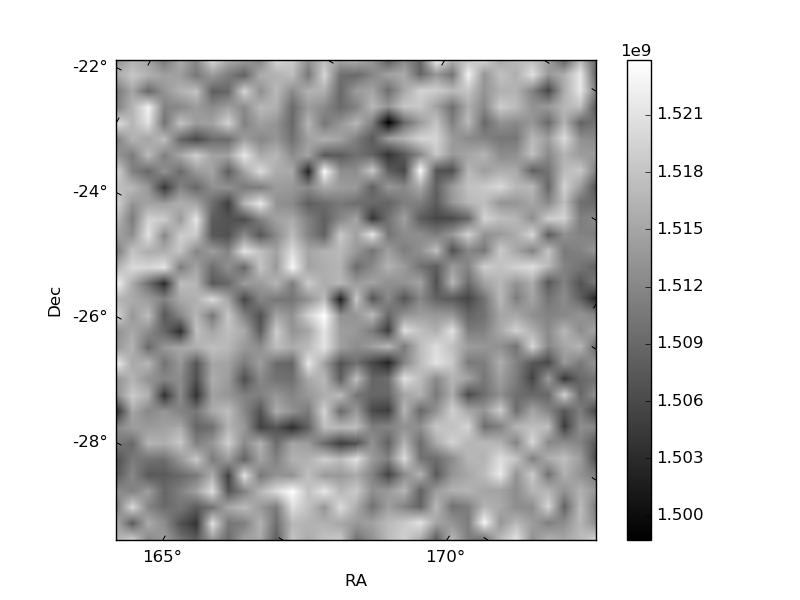
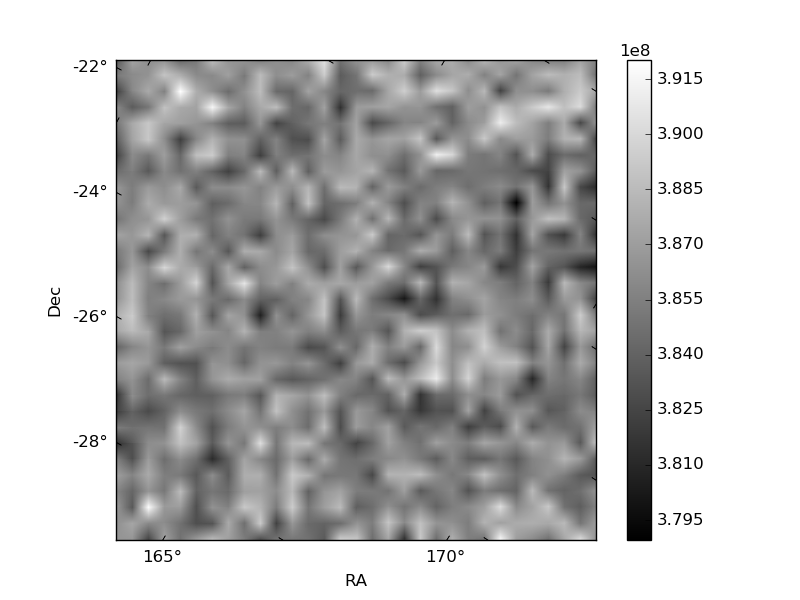
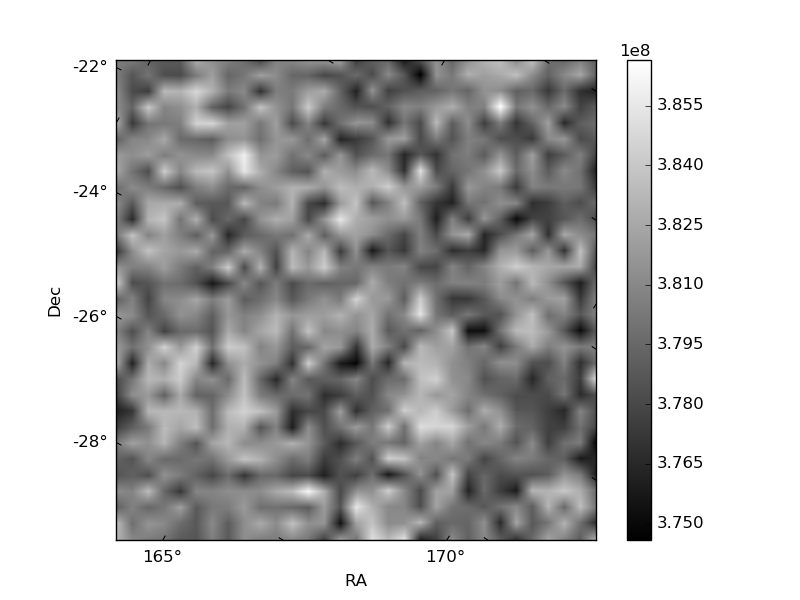
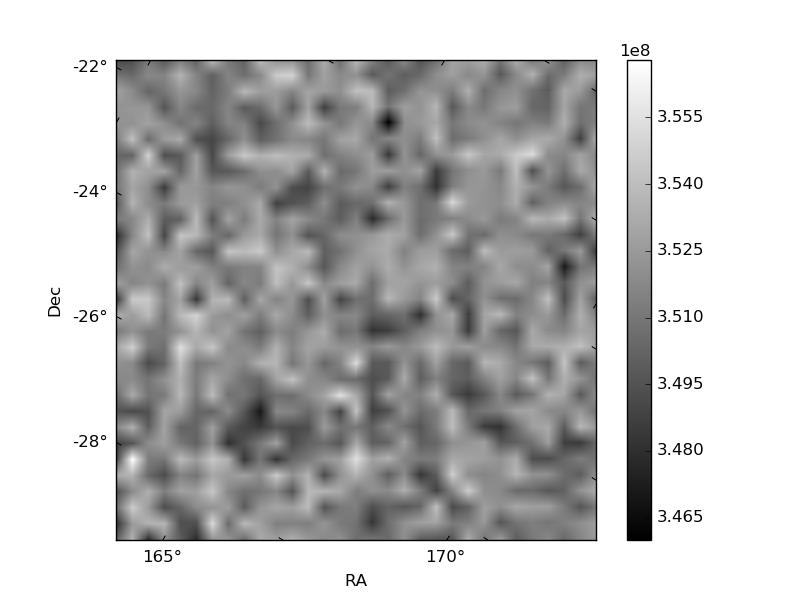
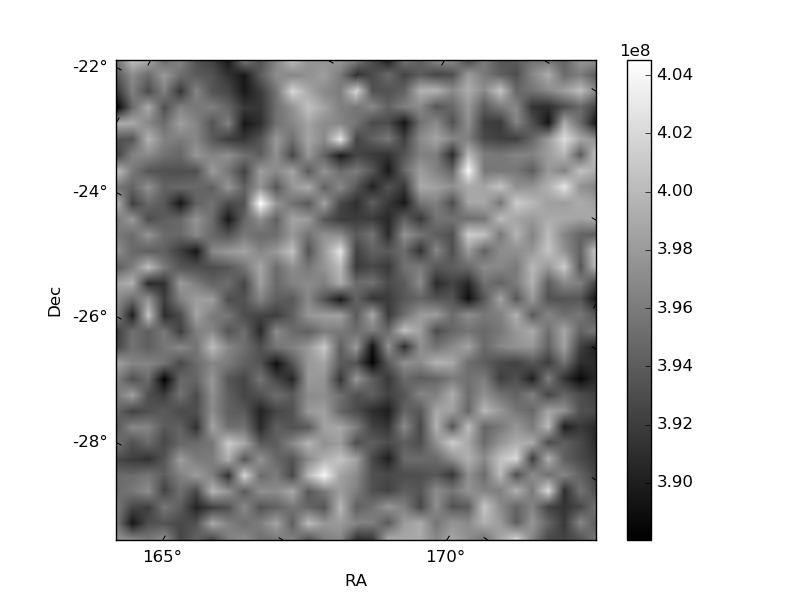
Histogram calculated using DETX and DETY for each event in the final _common_clean file
| Quadrant A | 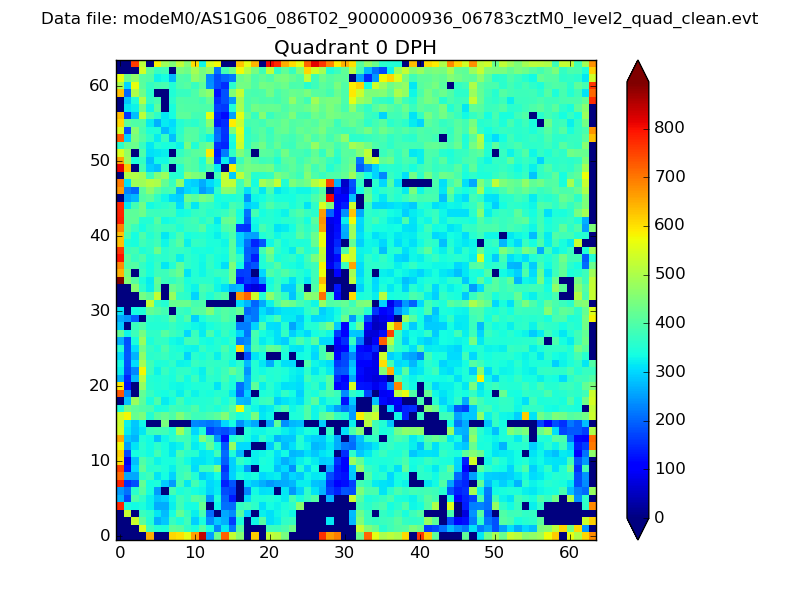 |
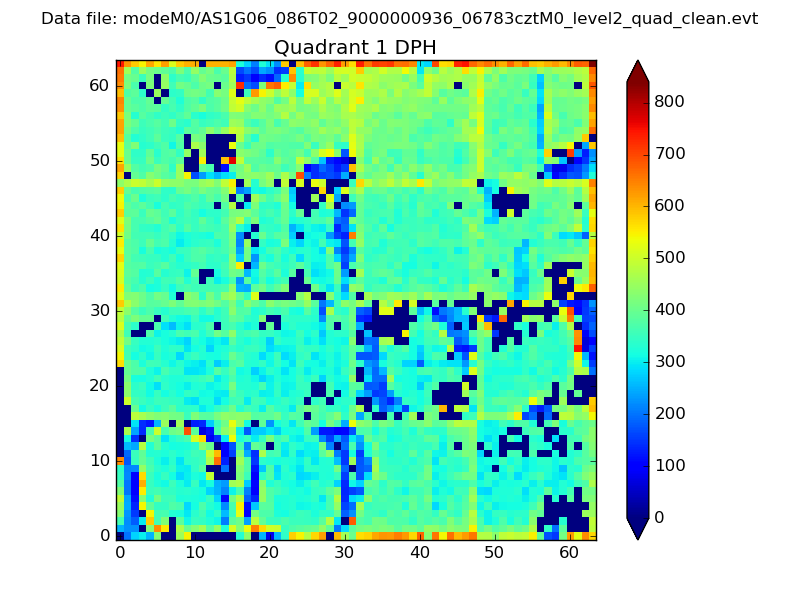 |
Quadrant B |
|---|---|---|---|
| Quadrant D | 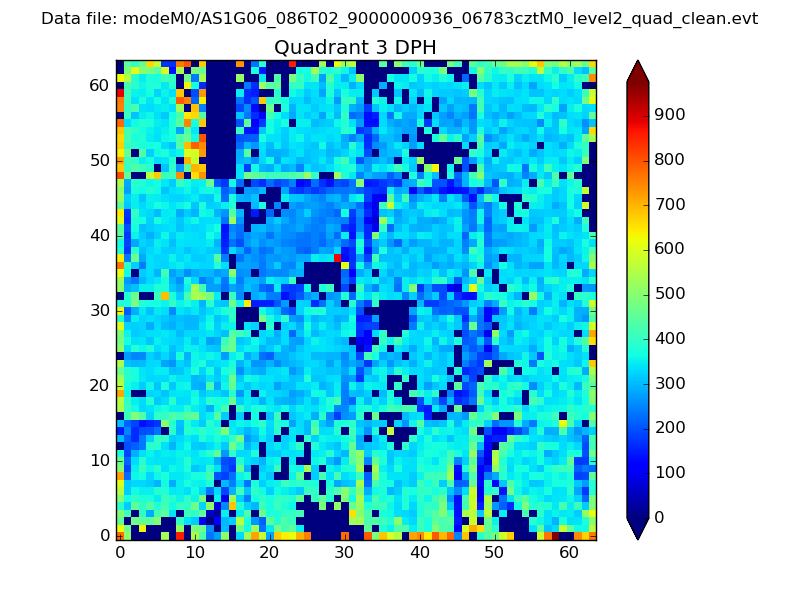 |
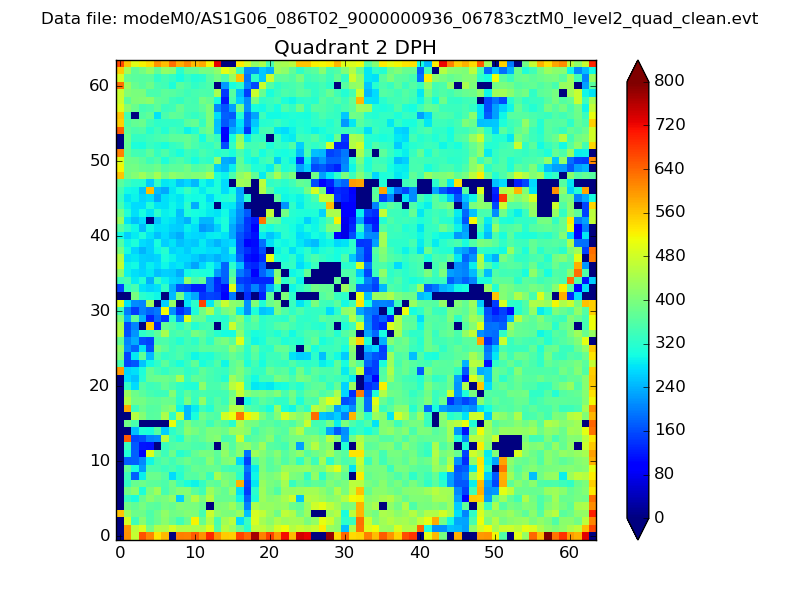 |
Quadrant C |
| Plot type | Count rate plots | Images |
|---|---|---|
| Comparison with Poisson distribution Blue bars denote a histogram of data divided into 1 sec bins. Red curve is a Poisson curve with rate = median count rate of data. |
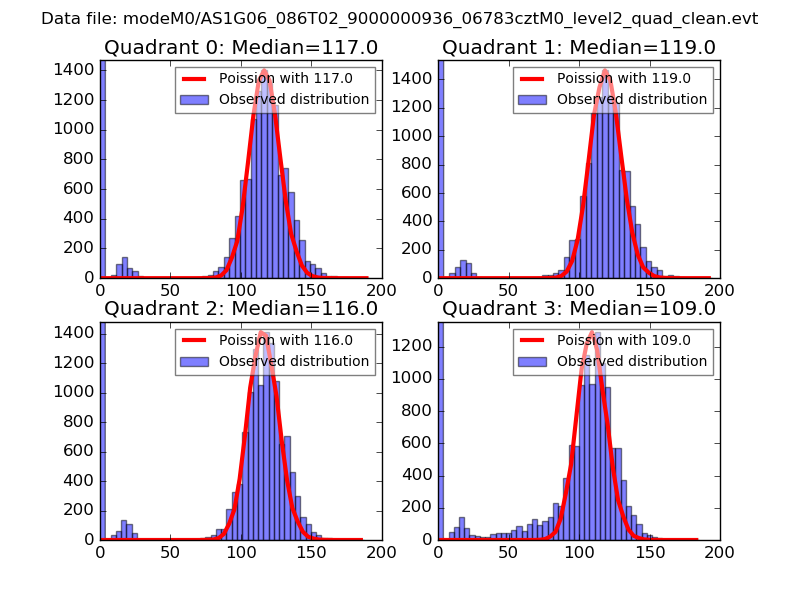 |
 |
| Quadrant-wise count rates Data is divided into 100 sec bins |
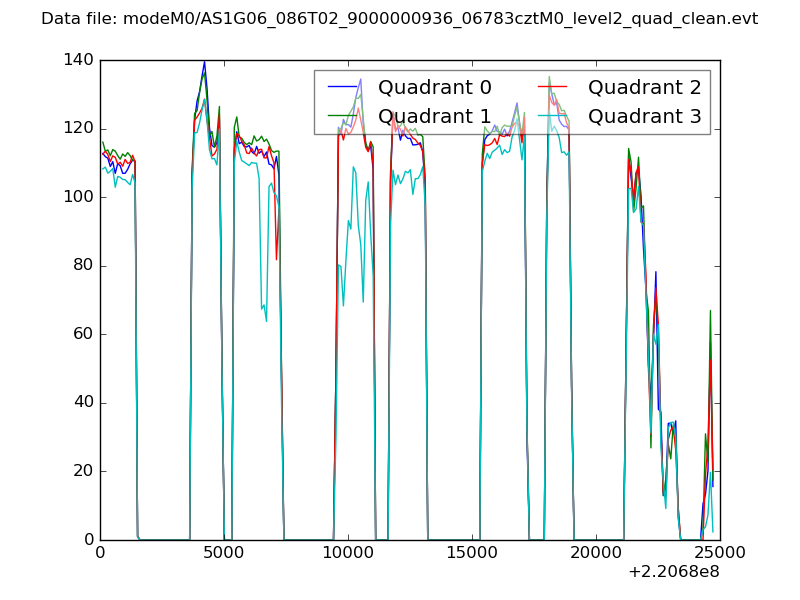 |
|
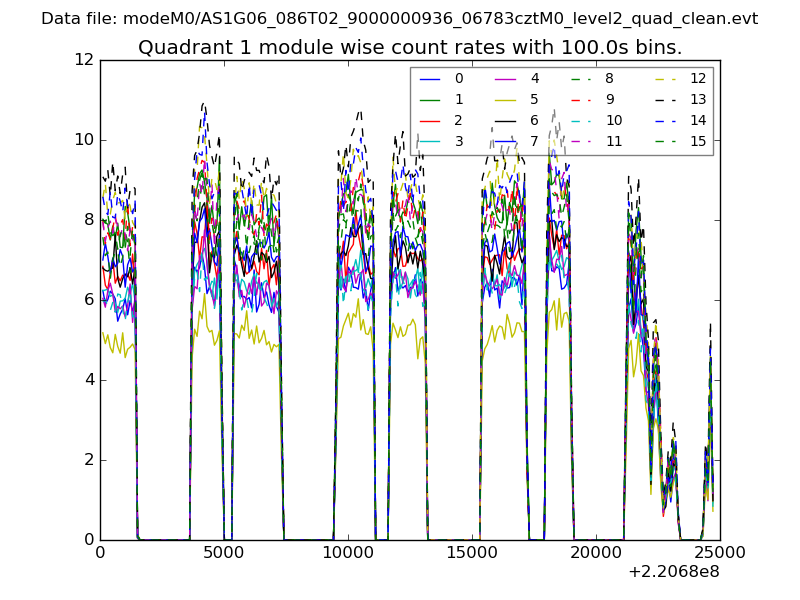
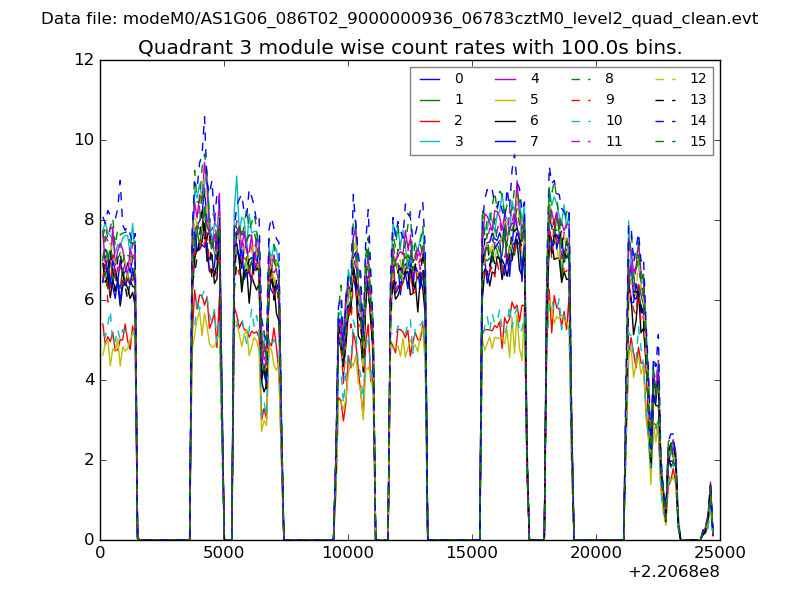
| Module-wise count rates for Quadrant A Data is divided into 100 sec bins |
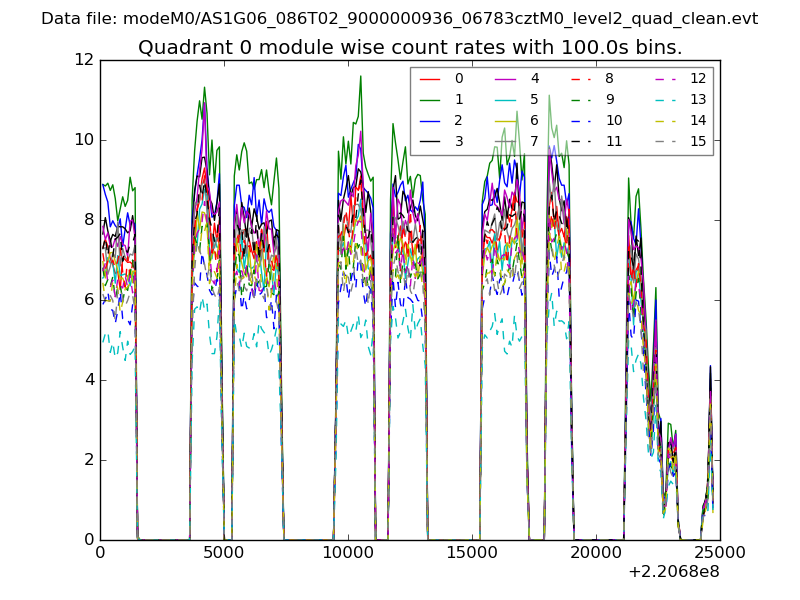 |
 |
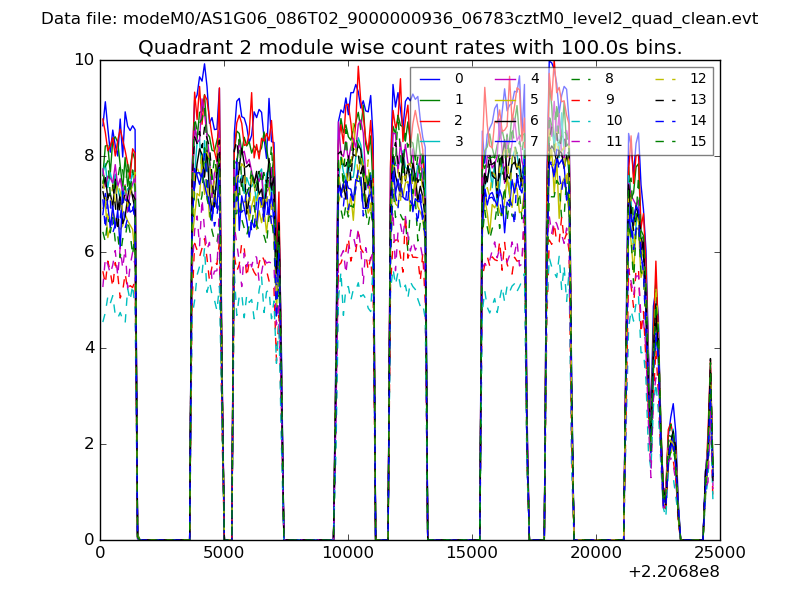
| Module-wise count rates for Quadrant B Data is divided into 100 sec bins |
 |
 |
| Module-wise count rates for Quadrant C Data is divided into 100 sec bins |
 |
 |
| Module-wise count rates for Quadrant D Data is divided into 100 sec bins |
 |
 |
| Parameter | Plot |
|---|---|
| CZT HV Monitor | 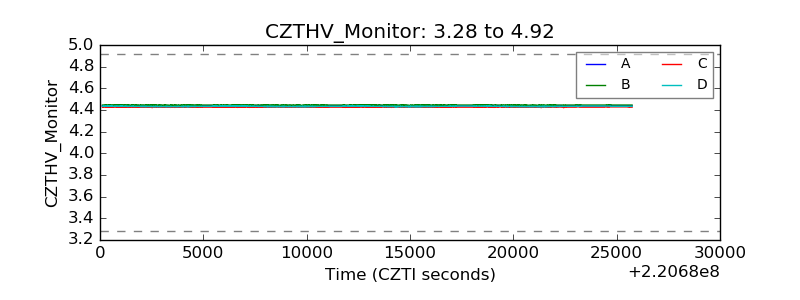 |
| D_VDD |  |
| Temperature 1 | 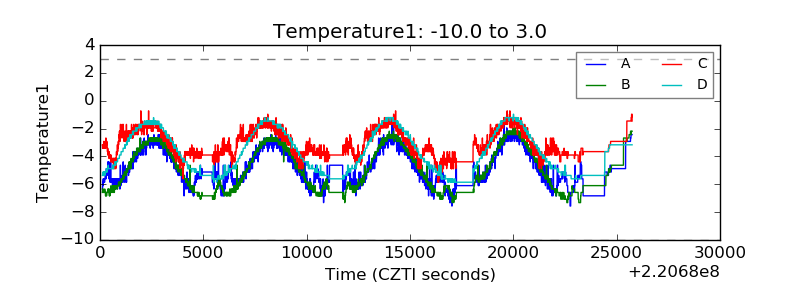 |
| Veto HV Monitor | 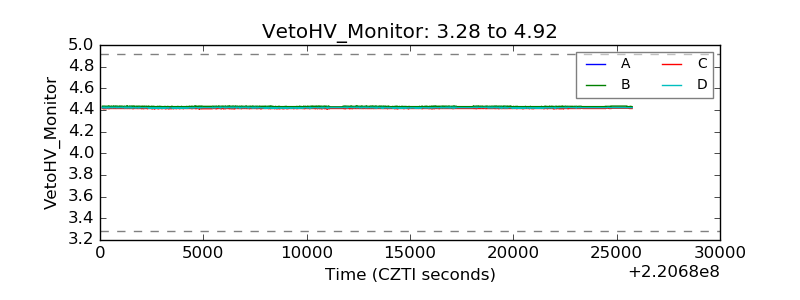 |
| Veto LLD | 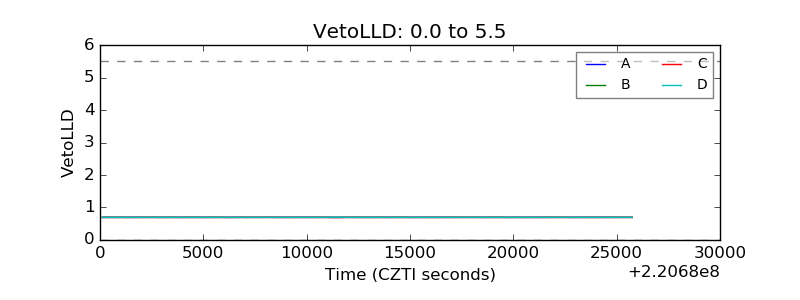 |
| Alpha Counter | 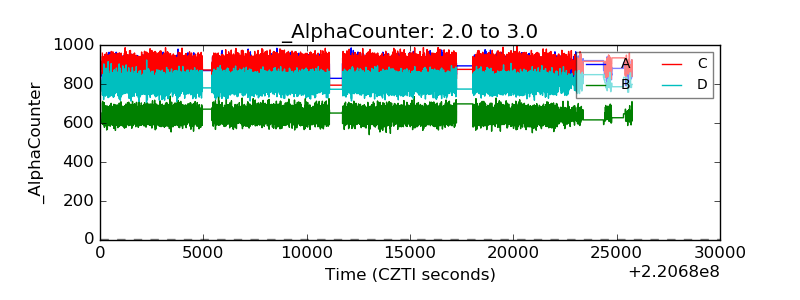 |
| _CPM_Rate | 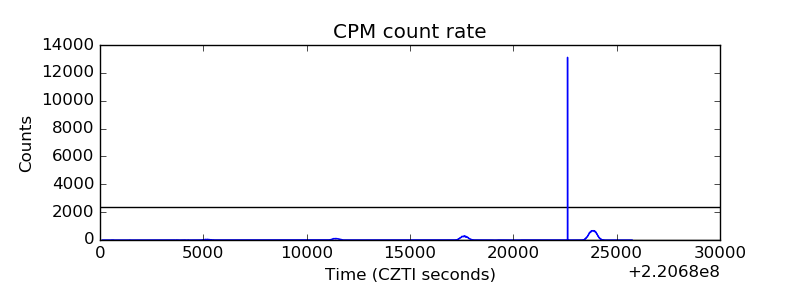 |
| CZT Counter | 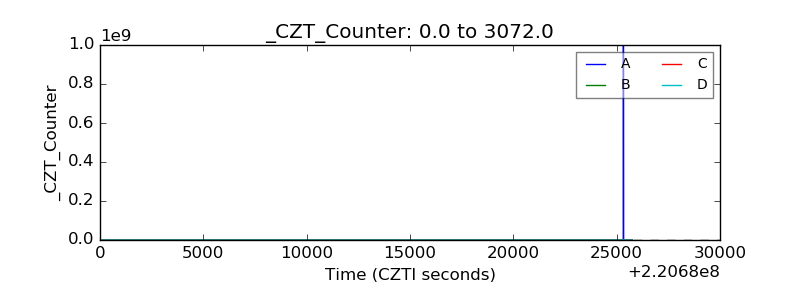 |
| +2.5 Volts monitor | 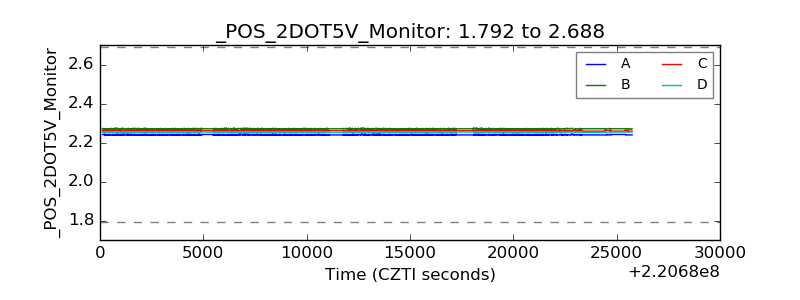 |
| +5 Volts monitor |  |
| _ROLL_ROT | 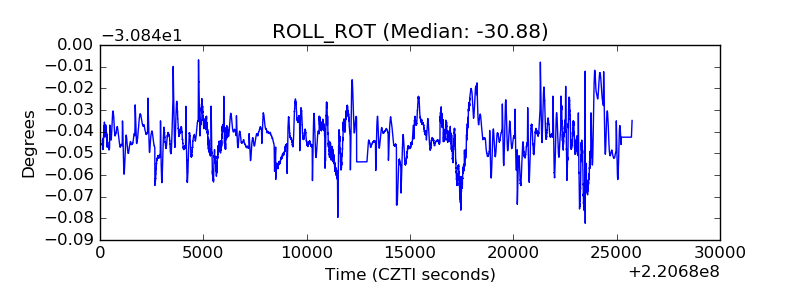 |
| _Roll_DEC | 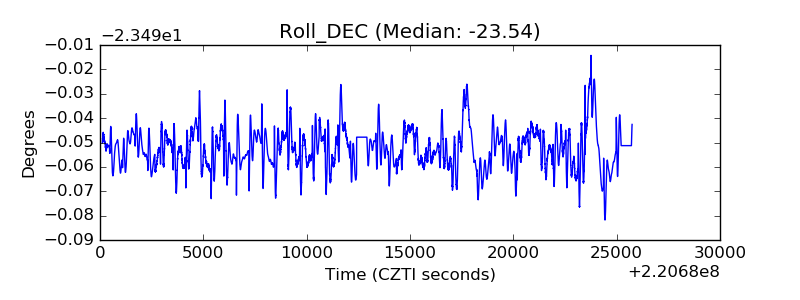 |
| _Roll_RA | 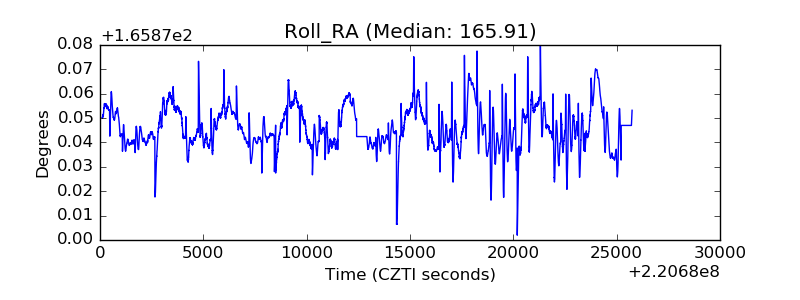 |
| Veto Counter | 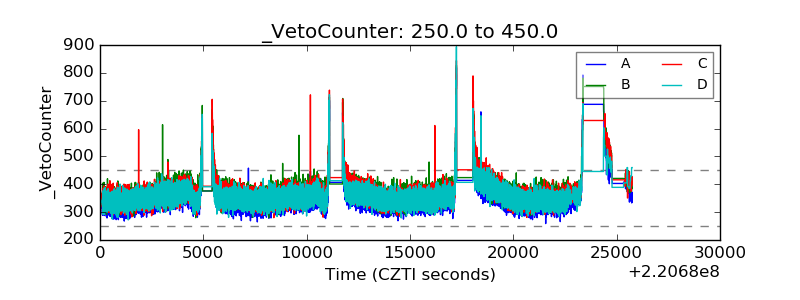 |